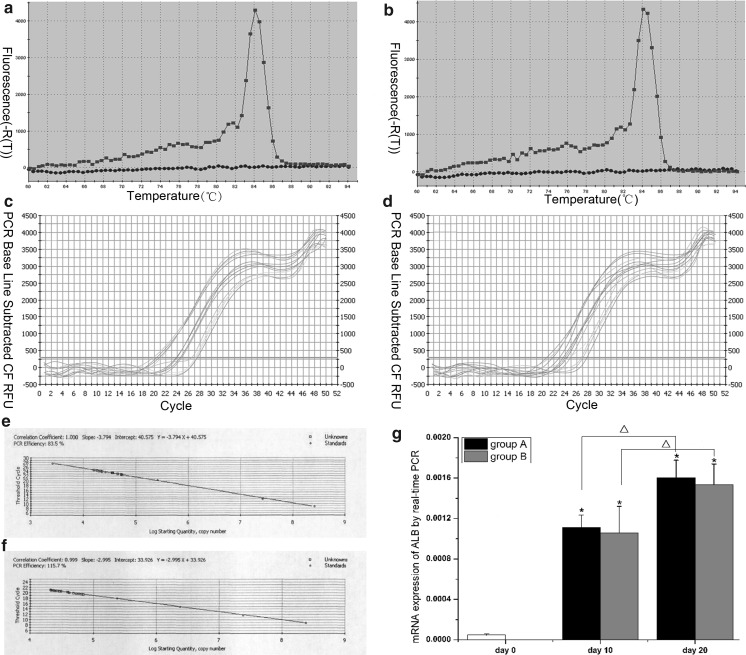
Fig. 6.
Real-time PCR analysis of the mRNA levels for ALB. Melting curve for β-actin (a) and for ALB (b). Amplification curve for β-actin (c) and for ALB (d). Standard curve for β-actin (e) and ALB (f). The relative quantity of the ALB gene (g). Values represent mean ± SD. Significance was set at p < 0.05 and assessed compared with day 0 (asterisk) and compared between groups (triangle)

