Abstract
By means of a model predictive control strategy it was possible to ensure a high batch-to-batch reproducibility in animal cell (CHO-cell) suspensions cultured for a recombinant therapeutic protein (EPO) production. The general control objective was derived by identifying an optimal specific growth rate taking productivity, protein quality and process controllability into account. This goal was approached indirectly by controlling the oxygen mass consumed by the cells which is related to specific biomass growth rate and cell concentration profile by manipulating the glutamine feed rate. Process knowledge represented by a classical model was incorporated into the model predictive control algorithm. The controller was employed in several cultivation experiments. During these cultivations, the model parameters were adapted after each sampling event to cope with changes in the process’ dynamics. The ability to predict the state variables, particularly for the oxygen consumption, led to only moderate changes in the desired optimal operational trajectories. Hence, nearly identical oxygen consumption profiles, cell and protein titers as well as sialylation patterns were obtained for all cultivation runs.
Keywords: CHO cells, Specific erythropoietin production rate, Specific growth rate, Model predictive control, Optimal process design, Reproducibility
Introduction
The reason why most cell cultures for recombinant protein production are controlled in an open loop fashion is that closed loop controllers are quite difficult to construct and need reliable estimates of the actual state of the process.
When carefully operated and without severe distortions, an open loop control strategy runs quite well, particularly when the process is run along robust trajectories (Aehle et al. 2011a). However, in case of significant distortions, corrections must be made to remove the deviations from the desired path. In order to perform such corrections fast enough, i.e. before the system runs into critical situations, they must be performed automatically.
In cell cultures the process dynamics change drastically during the entire cultivation. Hence, the parameters of conventional process controllers must be adapted anyway. In order to adapt the parameters properly, a-priori knowledge about the changes in the process’ dynamics should be employed. This naturally leads to model-supported controllers. For animal cell culture processes, such adaptive controllers were proposed by a few groups only (Siegwart et al. 1999; Frahm et al. 2002).
When process models are applied, it is possible to directly use this representation of a-priori-knowledge for automatic corrections. Then, one can construct more powerful correctors for process deviations. A convincing variant of such model-supported controllers is a forward-looking one, in which the model is used to predict the process behavior for some time interval towards the future.
Exactly this practical procedure was developed for production processes and is already used in chemical process industries (Camacho and Bordons 1995) and refineries (Zhang and Hua 2007; Yüzgeç et al. 2010), where it is referred to as model predictive control. We primarily expect from such a control approach that it leads to a much smoother process operation as compared to conventional control approaches. Significant deviations from the desired path should be recognized much earlier, so that only small actions are necessary to keep the process on the desired track.
Materials and methods
The serum-free CHO-S cell line (Invitrogen, Karlsruhe, Germany) was stably transfected with a hEPO expression vector (pKEXHyg) carrying a hygromycin B (PAA, Pasching, Austria) resistance for stable production of high levels of recombinant human EPO (rhEPO).
As the cultivation stock medium, HyClone’s CHOSFM4-Utility medium (Logan, UT, USA) enriched with hypoxanthin/thymidin (Gibco, Invitrogen, Karlsruhe), 4 mM NaHCO3, 10 mM HEPES and 1 g/L Pluronic was used. Two feeding solutions for the applied fed-batch process, mainly containing glutamine and glucose, respectively, were separately pumped to the bioreactor by peristaltic pumps. The concentrations of both substrates for the presented experiments are depicted in Table 1 of the results and discussion part. All other components added to the feed solutions are described elsewhere (Aehle et al. 2011a).
Table 1.
Glutamine and glucose feed concentrations for the open-loop experiments with different specific growth rates
| μset (h−1) | Glutamine (mM) | Glucose (mM) |
|---|---|---|
| 0.005 | 5 | No feeding |
| 0.01 | 20 | 83 |
| 0.02 | 20 | 83 |
| 0.03 | 40 | 166a |
aAdditional amino acids: 4 g/L serine, 4 g/L valine, 2 g/L methionine
All experiments were carried out in a 2 L fully equipped Biostat B bioreactor (B. Braun, Melsungen, Germany) placed on a balance. The ambient conditions were kept constant at 37 °C, pH 7.15, 20% pO2 and 0.1 L/min airflow rate. More details on the reactor setup can be found in Aehle et al. (2011a).
A quadrupole mass spectrometer (QMA200, Balzers, Lichtenstein) was used to measure online the oxygen volume fraction of the in-and outlet gas flow by multiplexing to determine the culture’s oxygen consumption rate.
During the cultivation, samples were taken for offline analysis. The cell concentration and viability were determined by a CASY system (CASY TT, Roche Innovatis AG, Mannheim, Germany). Glucose and lactate concentrations were measured using the biochemistry analyzer YSI 2700 SELECT (Yellow Springs Instruments, Yellow Springs, OH, USA). Ammonium and glutamine concentrations were determined enzymatically using the ammonium kit (11 112 732 035, R-Biopharm, Darmstadt, Germany) and the glutamic acid kit followed by an asparaginase reaction (10 139 092 035, R-Biopharm, Darmstadt, Germany).
EPO concentrations were determined by immuno-blot assays. The centrifuged supernatants were transferred to nitrocellulose filters. Every filter contained a rhEPO standard (Merk KGaA, Darmstadt, Germany) at different dilution to obtain a calibration curve of EPO concentration and chemiluminescence intensity. The blots were blocked with 5% fat-free dry milk powder in PBS, incubated with the EPO (B-4)-monoclonal antibody (sc-5290, Santa Cruz Biotechnology, Heidelberg, Germany), washed with PBS and incubated with the secondary antibody (horseradish peroxidase (HRPO) conjugated rabbit anti-mouse, Dianova, Hamburg, Germany). After washing, EPO was detected by enhanced chemiluminescence (Luminol®, Roth, Karlsruhe, Germany) and visualized by exposing the blots to a Bio-Rad imager system (ChemiDoc XRS, Bio-Rad Laboratories, Munich, Germany) for 5 min. The mean of each EPO sample includes a fourfold measurement. For the isoelectric focusing (IEF) 500 μL cell culture supernatant was desalted and concentrated to a volume of 50 μL with 5 K NMWL centrifugal filters (Millipore, Merck KGaA, Darmstadt, Germany). Further sample preparations and the used voltage gradient were performed according to Bork et al. (2007) using pH 3-6 IPG stripes (7 cm) and a Protein IEF cell from Bio-Rad (Munich, Germany).
The net specific growth rate μnet = (μ − kd) and other specific reaction rates qi for each time point were calculated using the integral of viable cells (IVC) and the changes in the state variables ci according to Eqs. 1 and 2
 |
1 |
 |
2 |
where Δ(ci · W/ρ) is the difference of the total amount of each state variable ci over time. The measured culture weight W already considered the amount of feed added. For the specific growth rate, qi equals μnet = (μ − kd).
In order to determine the qEPO(μ)-relationship (Pirt 1975), the specific EPO production rate qEPO was simply determined by plotting the amounts of EPO as a function of IVC. The slope in the interval, where the specific growth rate was nearly constant, was taken as qEPO (mg 109 cells−1 h−1). The qEPO(μ) relationship is discussed in more detail below.
The yields Yij were calculated as the ratios of the specific rates qi and qj between the off-line time points. These specific rates of substrates and metabolites were calculated according to Eq. 2.
Basic process representation
Models used in model predictive control procedures are taken to optimize the profile of the controlled variable across the time interval at every time step that was used to update the manipulated variable. Hence, the nonlinear process model structure must not be too complex as they are to be evaluated many times throughout the cultivation. In animal cell cultures, the time increments for adjusting the manipulated variable, usually the feed rate of the growth limiting substrate, are rather long. It is possible to use simple differential equation system models and well established optimizers to determine the optimal path of the manipulated variable for the time horizon considered.
Generally, it is desirable to keep the model complexity as low as possible to reduce the number of free model parameters to a minimum since a lower complexity usually leads to an improved robustness during parameter identification.
Hence we restrict ourselves to the basic mass balances for the total and viable biomass, the substrates glucose and glutamine as well as for the overflow products lactate and ammonium. Thus, the state vector c considered is:
 |
3 |
Initially, the parameters were estimated from offline data acquired in a couple of cultivation runs. The concrete balance equations are
 |
4 |
 |
5 |
cF are the concentrations in the feed solutions which were fed at rate F(t). The volumetric conversion rate expression R is equal to
 |
6 |
For the specific rates, the elements of R, simple approximations were used:
 |
6.1 |
 |
6.2 |
 |
6.3 |
 |
6.4 |
 |
6.5 |
 |
6.6 |
 |
6.7 |
The oxygen consumption rate is of primary importance as this quantity is used to compute the control variable in the controller to be discussed. It is assumed that the oxygen uptake rate is steadily in equilibrium with the biomass concentration and was thus considered by a simple static relationship expressed by a Luedeking–Piret-type model:
 |
7 |
with
 |
7.1 |
An important aspect in such models for animal cell cultures is that the stoichiometry of the net biochemical conversion processes changes with time. This requires changing of some model parameters, particularly the conversion yields with the cultivation time.
Results and discussion
Control objectives
Usually, the general objectives of the EPO production are twofold. The process should be run (1) at maximal productivity where (2) the reproducibility of the process operation can be kept at high level and thus the product quality more consistent.
The specific product formation with rate qEPO is most often related to the specific growth rate μ of the cells. In order to determine the qEPO(μ)-relationship, data from a set of open loop experiments were used (Aehle et al. 2011a).
For the open-loop experiments with different setpoint specific growth rates μset different glutamine and glucose feed concentrations were used. The concrete data are compiled in Table 1.
Both feed solutions were separately fed to the culture in an open-loop control mode using exponential feeding rates according to Eqs. 8 and 9
 |
8 |
 |
9 |
where F0 is a function of the cell concentration X0, culture weight W0 at the start point t0 of the feeding, the substrate concentration S in the bioreactor (S is either glutamine or glucose), the substrate concentration Sf in the feed solution and the yield coefficients YSX.
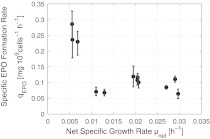
The glutamine feed was started from the beginning t0Gln = 0 h whereas the glucose feed was started at t0Glc = 75 h. The results with respect to the specific EPO formation rate as a function of the specific growth rate of the cells obtained in open loop experiments is shown in Fig. 1.
Fig. 1.
Specific product formation rate as a function of the net cell growth rate
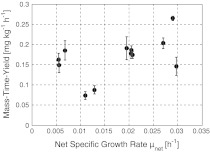
The reason for the smallest specific EPO formation rate qEPO at a specific growth rate μ of about 0.011–0.013 h−1, which does not seems to fit into the general decrease of qEPO with increasing μ, needs further investigation. However, it does not have an impact on the conclusions for the optimal specific growth rate when Fig. 2 is taken into account together with the discussion on reproducibility. Fig. 2 shows the calculated mass–time–yield, i.e. the mass of product produced per mass of culture up to the entire culture time.
Fig. 2.
Mass–time–yield of EPO. The data points are corresponding to those from the last two figures
Results depicted in Fig. 2 suggest that it is favorable to run the cultures at higher specific growth rates. However, as pointed out by Aehle et al. (2011b) and Jenzsch et al. (2004), from the perspective of process reproducibility, the cultivation should be run at specific growth rates lower than μmax as then the process becomes robust. As not only the qEPO(μ)-relationship is of importance for the choice of μ but also the protein quality, we performed IEF measurements for the various specific growth rates to make sure that the chosen μ does not significantly influence the posttranslational modifications, particularly the sialylation pattern (Fig. 3). Wang et al. (2002) also observed identical EPO sialylation patterns for different specific growth rates using different culture modes. Hence, we chose a specific growth rate of 0.02 h−1.
Fig. 3.
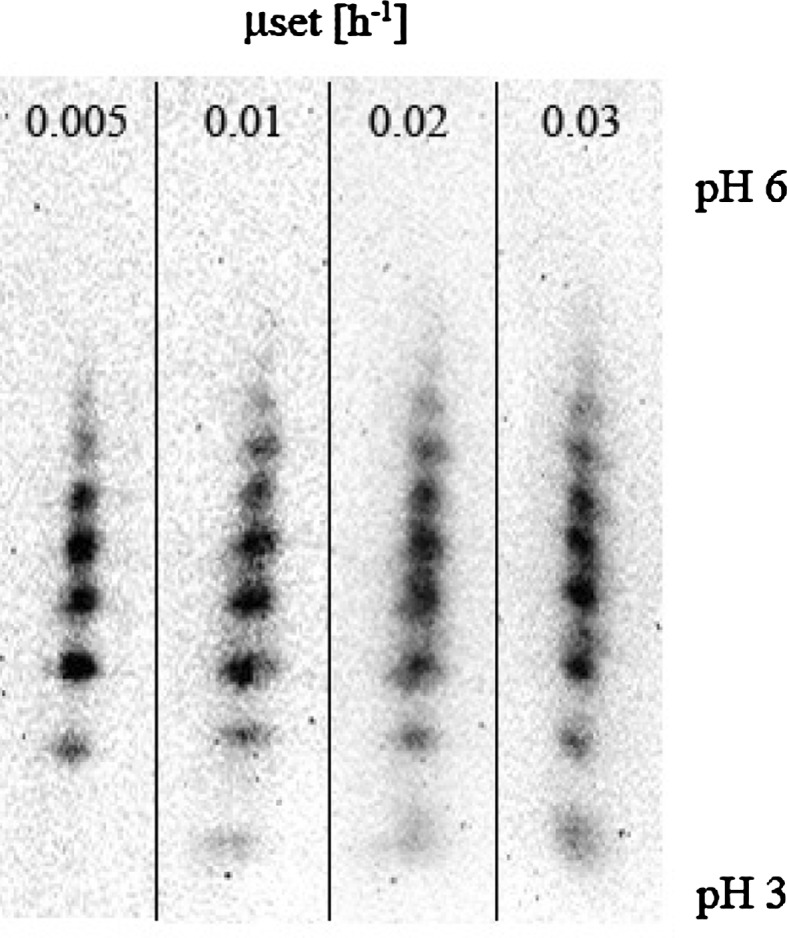
IEF results of the final samples at the end of processes with the different specific growth rates. Every spot represents EPO with a different degree of sialylation
In production bioreactors, it is not convenient to control the process to the optimal μ as this would require to accurately estimating this variable. Although this would generally be possible, it is easier to choose a control variable that is strictly related to μ but can be easily measured online. Possibilities for such variables are the total carbon dioxide amount produced or the total amount of oxygen consumed by the cells. Both variables can be determined online in cultivations via offgas analyzer data.
Model implementation
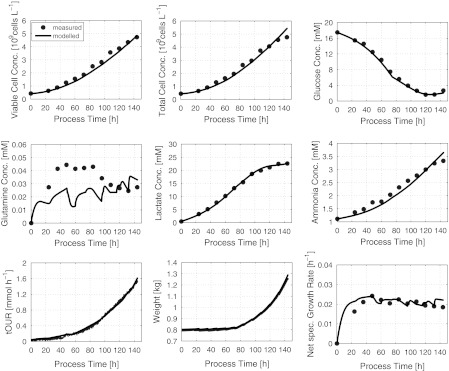
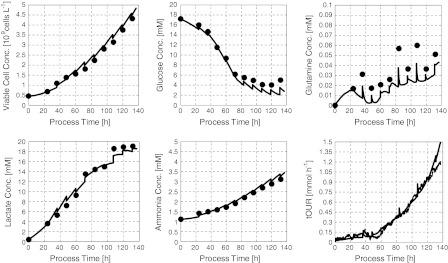
The model considers 7 state variables, the concentrations of viable and total cells, two substrates, two metabolites and OUR. 19 model parameters were estimated using measurement data from 5 cultivation runs performed around the specific growth rate of 0.02 h−1. The estimates are compiled in Table 2. Figure 4 gives an impression of the model quality by a comparison of the model results with the measurement data from one experiment.
Table 2.
Overview of model parameters and their values after identification for the cultivation shown in Fig. 4
| Parameter | Value | Parameter | Value |
|---|---|---|---|
| qGlcmax | 0.18 mmol 109 cells−1 h−1 |  |
0.48 mmol 109 cells−1 |
| qGlnmax | 0.06 mmol 109 cells−1 h−1 | YOGlc | 2.57 mmol mmol−1 |
| KGlc | 2.25 mM | YOGln | 10.43 mmol mmol−1 |
| KGln | 0.23 mM | k1 | 0.32 mM |
| KLac | 52.26 mM | k2 | 3.14 mM |
 |
5.39 mM | mGln | 5 × 10⁻³ mmol 109 cells−1 h−1 |
| kdmax | 6 × 10⁻³ h−1 | mAA | 2 × 10⁻⁴ mmol 109cells−1 h−1 |
| YGlcX | 6.97 mmol 109 cells−1 | KO | 1.05 mM |
| YGlnX | 0.97 mmol 109 cells−1 | mO | 0.06 mmol 109 cells−1 h−1 |
| YLacGlc | 1.59 mmol mmol−1 |
Fig. 4.
Offline fit of the model to process measurement data from the CHO culture described above
The model perfectly describes the measurement data. At a first glance, this does not seem to apply for the glutamine concentration. Here, however, it should be kept in mind that the glutamine concentrations in a true glutamine-limited fed batch process are in the order of magnitude of the Monod constant KGln. These concentrations are clearly below values where reliable measurements can be expected from the analytical techniques usually used. Hence, a match of data and model results for glutamine cannot be expected.
The controller itself does not need the measured glutamine concentrations as the controlled variable, the mass of oxygen consumed, primarily depend on the cell concentration and the specific growth rate. Thus, the controller performance does not suffer from the less accurate measured glutamine concentration.
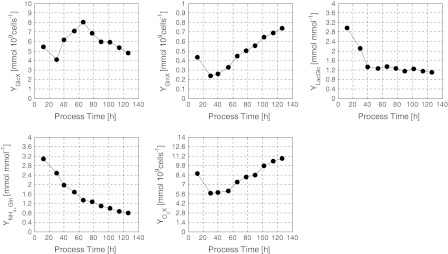
It is important to note, that this balance model structure is quite generally applicable to fed-batch processes in animal cell cultures. All parameters, particularly the yields, must of course be adapted to the actual strain. Moreover, the yields are by no means constant and they significantly change with time. Examples of their variation during the glutamine limited fed-batch cultivation are given in Fig. 5.
Fig. 5.
Main yield coefficients determined from measured data and their dynamic changes during the Gln-limited fed-batch process
The changes in these parameter values cannot be predicted to a sufficient accuracy. Hence, in online applications of that model which are necessary in a model predictive controller, the yield parameters must be adapted online. This can be done within a moving window. In several experiments it was found that the best identification results can be achieved using an interval that contained the last three offline measurements. From a sensitivity analysis of the model (results not presented), it turned out that 5 model parameters, kdmax, KLac,  , KOGlc and mAA could be kept constant throughout the entire process. The parameter identification can then be performed with a standard Nelder–Mead downhill simplex technique (e.g. MATLAB’s fminsearch).
Adaptation of the model parameters
Whenever new measurement values for the offline variables became available, the model parameters were updated by fitting the model to the process data from the last period of 24 h. After each adaptation of the model parameters, the new starting point for the prediction was then taken as the average of the last prediction and the measurement values. The simple arithmetic mean was used assuming that the measurement error is roughly equal to the modeling error. For the period up to the next sampling point of the offline data, the model was used with the parameters just determined to make predictions for the coming 12 h with a time increment of 144 s.
Figure 6 shows the results of the model parameter adaptation for the various process variables.
Fig. 6.
Online estimate of the current process state together with the corresponding offline and online measurement data
Model predictive controller
With the fairly general process model for cell cultures and the exponential feed rate profile it is now possible to derive a model-supported controller. Its essential features are
The parameters of the basic model are periodically fitted to the measurement data within a moving window containing the last three offline measurement values of the viable and total biomass, glutamine, glucose, lactate, ammonia as well as the online values of the oxygen consumption rate. This adaptation is performed at each time instant where new offline measurements became available (each 12 h).
This model is then used to predict the future process behavior in a time interval up to a time horizon of 12 h ahead.
At each time instant at which online measurements become available (time increment of 144 s), the algorithm computes the optimal glutamine feed rate (action variable) in order to minimize the deviations (RMSE) between the predicted and the desired
 profile within the time horizon of 12 h without violating the constraints with respect to all variables involved. Note,
  is the controlled variable.
Only the first value of the computed optimal action variable profile is needed at the actual time instant and is thus sent to the glutamine feeding pump.
The time increment 144 s was derived from stimulus/response experiments performed with glutamine pulses. This led to direct estimates of the process response times and thus the process’ dynamics. These experiments are described in detail in Aehle et al. (2011b).
Control performance
The control performance can be seen by comparison between the desired profile of the controlled variable and the measured one.
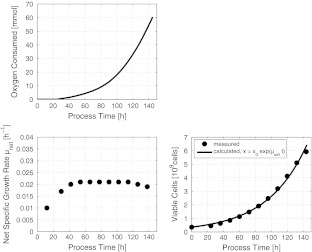
The reference profile was developed during the cultivation with the study number S693. Here an open loop cultivation was performed with an exponential glutamine feed corresponding to a specific growth rate of μset = 0.02 h−1. As this cultivation run without significant distortions, the profile of the total amount of oxygen consumed, was taken. It was slightly smoothed and then taken as the setpoint of  for the set of experiments performed with the controller. The control profile and the corresponding profiles of the specific biomass growth rate and cell counts are shown in Fig. 7.
Fig. 7.
Upper plot: set point profile for the controlled variable  . Lower plots: corresponding net specific biomass growth rate (left) and biomass profile (right)
In this reference cultivation, the desired specific biomass growth rate of 0.02 h−1 was obtained after about 40 h cultivation time and was then kept constant for roughly 100 h. Note that the  signal values depict credible values only after 1 day. This requires open loop control for the first day of cultivation.
Its success can best be judged by the reproducibility obtained in a series of cultivations (Fig. 8).
Fig. 8.
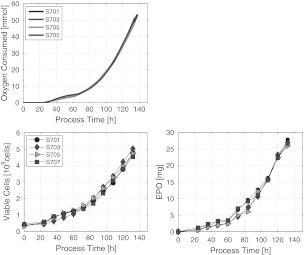
Four successively performed CHO-cell cultivations controlled with the model predictive  -controller
The results shown in Fig. 8 depict an excellent batch-to-batch reproducibility with respect to the controlled variable the total amount of oxygen consumed by the cells.
As the objective is not consuming oxygen but proliferating cells expressing the desired product, we must look for the corresponding biomass or cell count and product mass profiles. The cell count profiles of the four cultivations are shown in Fig. 8.
Again, we find an excellent reproducibility of the biomass profiles. This essentially means that the variables  and Xv are tightly related to each other. Also the product mass profiles proved to be highly reproducible.
It must be taken into account that the product data depict a higher measurement error than the cell count measurement and the error in the measured control variable. Nevertheless, it becomes clear that the product amount can be obtained in a highly reproducible way.
Finally we look at the product quality for the 4 controlled runs. The corresponding sialylation patterns presented do not show any significant variations from batch-to-batch (Fig. 9). As can be seen, the number of bands and the intensity did not change. Hence, the reproducibility is confirmed even in the sialylation pattern.
Fig. 9.
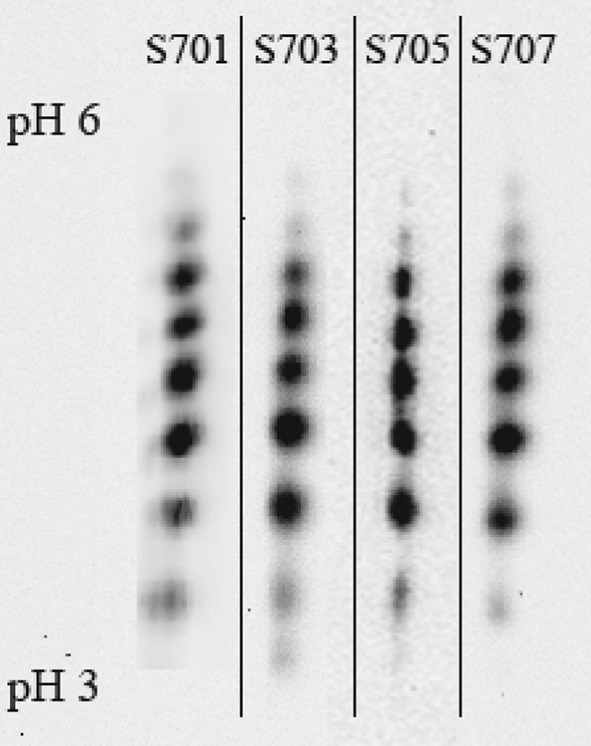
IEF results of the samples taken at t = 144 h for the MPC controlled experiments. Every spot represents EPO with a different degree of sialylation
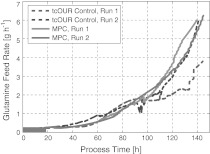
An important advantage to all other controllers we investigated at this cell culture is that the model predictive controller effectively works in such a way that it takes care of all constraints with respect to the inputs, the outputs and the biological variables. As it tries to find an optimal path towards the time horizon of the cultivation while not violating the constraints, it does not make abrupt corrections. Hence, the signal of the manipulated variable is much smoother than for other controllers. This is an immediate advantage in cell cultures where cells sensitively react on changes in their environment. A typical profile of the glutamine feed rate adjusted during one cultivation is shown in Fig. 10.
Fig. 10.
Typical profile of the manipulated variable, the glutamine feed rate. Here a comparison is made with the so-called tcOUR controller as discussed in Aehle et al. (2011b)
The comparison with a controller that does not look ahead, like the so-called tcOUR controller (Aehle et al. 2011b), shows that the feed rates did not need to make abrupt changes in the case of the model predictive controller.
Hence, the model predictive controller does not only lead to a high reproducibility, it also performs with moderated actions taking into account the estimated future development of the culture.
Conclusions
Model predictive control is a technique that employs a simple process model to perform forward-looking corrections to a substrate feed rate at a running cell culture.
The technique has the advantage, compared to conventional feedback controllers, that it takes changes in the process development into account that are to be expected on the base of à-priori knowledge about the process behavior. The actions of the controller, here the adjustments to the feed rate, can be made in such a way that no constraint to the process operational procedure is violated accompanied with only moderate changes. In this way, the probability of disturbing the culture by controller actions can be excluded.
The performance of the controller is fairly good which can best be judged by the batch-to-batch reproducibility obtained in cultures that are operated with this controller. The controller does not employ a complex esoteric model. On the contrary, the model is quite universal and the model parameters are adjusted online.
Acknowledgments
The financial support by the Ministry of Science and Education by means of the Excellence Initiative Sachsen-Anhalt is gratefully acknowledged.
Glossary
- IVC
Integral of viable cells (109 cells h)
- XV
Viable cell density (109 cells L−1)
- Xt
Total cell density (109 cells L−1)
- Glc
Glucose concentration (mM)
- Gln
Glutamine concentration (mM)
- Lac
Lactate concentration (mM)
- NH4
Ammonia concentration (mM)
- P
Protein (mg)
- W
Culture weight (kg)
- F
Overall feed rate (kg h−1)
- FBase
Base consumption rate (kg h−1)
- FEvap
Evaporation rate (kg h−1)
- FGlc
Glucose feed rate (kg h−1)
- FGln
Glutamine feed rate (kg h−1)
- FSample
Sampling rate (kg h−1)
- XV0
Viable cell density at start of feeding (109 cells L−1)
- W0
Culture weight at start of feeding (kg)
- Sf
Substrate feed concentration (mM)
- S
Substrate concentration (mM)
- ρ
Liquid density (kg L−1)
- t
Time (h)
- t0
Start of feeding (h)
- x
Viable cells (109 cells)
- μ
Specific growth rate (h−1)
- μnet
Net specific growth rate μnet = μ − kd (h−1)
- μset
Setpoint specific growth rate (h−1)
- qi
Specific consumption/production rate of state variable i (mmol 109 cells−1 h−1)
- qGlcmax
Maximum specific glucose consumption rate (mmol 109 cells−1 h−1)
- qGlnmax
Maximum specific glutamine consumption rate (mmol 109 cells−1 h−1)
- kd
Cell decay rate (h−1)
- kdmax
Maximum cell decay rate (h−1)
- kdeg
Degradation constant for glutamine kdeg = 0.004 (h−1)
- YSX
Yield consumed Substrate per cells formed (mmol 109 cells−1 h−1)
- YGlcX
Yield glucose consumed per cells formed (mmol 109 cells−1)
- YGlnX
Yield glutamine consumed per cells formed (mmol 109 cells−1 h−1)
- YLacGlc
Yield lactate formed per glucose consumed (mmol mmol−1)

Yield ammonia formed per cells formed (mmol 109 cells−1 h−1)
- YOGlc
Yield oxygen consumed per glucose consumed (mmol mmol−1)
- YOGln
Yield oxygen consumed per glutamine consumed (mmol mmol−1)
- KGlc
Glucose saturation constant (mM)
- KGln
Glutamine saturation constant (mM)
- KLac
Lactate inhibition constant for lactate (mM)

Ammonia inhibition constant for ammonia (mM)
- KO
Inhibition constant (mM)
- k1
Constant 1 for glucose (mM)
- k2
Constant 2 for glucose (mM)
- mGln
Glutamine maintenance constant (mmol 109 cells−1 h−1)
- mO
Oxygen maintenance constant (mmol 109 cells−1 h−1)

Amount of oxygen consumed (mmol)
- mAA
Specific ammonia production rate at low glutamine concentrations (mmol 109 cells−1 h−1) (Zeng et al. 1998)
- OUR
Oxygen uptake rate (mmol L−1 h−1)
- tOUR
Total oxygen uptake rate (mmol h−1)
- tcOUR
 total cumulative oxygen uptake rate (mmol)
References
- Aehle M, Kuprijanov A, Schaepe S, Simutis R, Lübbert A. Increasing batch-to-batch reproducibility of CHO cultures by robust open-loop control. Cytotechnology. 2011;63:41–47. doi: 10.1007/s10616-010-9320-y. [DOI] [PMC free article] [PubMed] [Google Scholar]
- Aehle M, Schaepe S, Kuprijanov A, Simutis R, Lübbert A. Simple and efficient control of CHO cell cultures. J Biotechnol. 2011;153:56–61. doi: 10.1016/j.jbiotec.2011.03.006. [DOI] [PubMed] [Google Scholar]
- Bork K, Reutter W, Weidemann W, Horstkorte R. Enhanced sialylation of EPO by overexpression of UDP-GlcNAc 2-epimerase/ManAc kinase containing a sialuria mutation in CHO cells. FEBS Lett. 2007;581:4195–4198. doi: 10.1016/j.febslet.2007.07.060. [DOI] [PubMed] [Google Scholar]
- Camacho EF, Bordons C. Model predictive control in the process industry. London: Springer; 1995. [Google Scholar]
- Frahm B, Lane P, Atzert H, Munack A, Hoffmann M, Hass VC, Pörtner R. Adaptive, model-based control by the open-loop-feedback-optimal (OLFO) controller for the effective fed-batch cultivation of hybridoma cells. Biotechnol Prog. 2002;18:1095–1103. doi: 10.1021/bp020035y. [DOI] [PubMed] [Google Scholar]
- Jenzsch M, Simutis R, Lübbert A (2004) Application of model predictive control to cultivation processes for protein production with genetically modified bacteria. In: Proceedings of the 9th international IFAC symposium, Nancy, pp 511–516
- Pirt SJ. Principles of microbe and cell cultivation. Oxford: Blackwell Scientific Publications; 1975. [Google Scholar]
- Siegwart P, Côté J, Male K. Adaptive control at low glucose concentration of HEK-293 cell serum-free cultures. Biotechnol Prog. 1999;15:608–616. doi: 10.1021/bp990077v. [DOI] [PubMed] [Google Scholar]
- Wang MD, Yang M, Huzel N, Butler M. Erythropoietin production from CHO cells grown by continuous culture in a fluidized-bed reactor. Biotechnol Bioeng. 2002;77:194–203. doi: 10.1002/bit.10144. [DOI] [PubMed] [Google Scholar]
- Yüzgeç U, Palazoglu A, Romagnoli JA. Refinery scheduling of crude oil unloading, storage and processing using a model predictive control strategy. Comput Chem Eng. 2010;34:1671–1686. doi: 10.1016/j.compchemeng.2010.01.009. [DOI] [Google Scholar]
- Zeng A-P, Hu W-S, Deckwer W-D. Variation of stoichiometric ratios and their correlation for monitoring and control of animal cell cultures. Biotechnol Prog. 1998;14:434–441. doi: 10.1021/bp9800337. [DOI] [PubMed] [Google Scholar]
- Zhang BJ, Hua B. Effective MILP model for oil refinery-wide production planning and better energy utilization. J Clean Prod. 2007;15:439–448. doi: 10.1016/j.jclepro.2005.08.004. [DOI] [Google Scholar]


