

Abstract
Objective
Epidemiologic data regarding the association between ABO blood groups and risk of coronary heart disease (CHD) have been inconsistent. We sought to investigate the associations between ABO blood group and CHD risk in prospective cohort studies.
Methods and Results
Two large, prospective cohort studies (the Nurses’ Health Study [NHS] including 62,073 women and the Health Professionals Follow-up Study [HPFS] including 27, 428 men) were conducted with more than 20 years of follow-up (26 years in NHS and 24 years in HPFS). A meta-analysis was performed to summarize the associations from the present study and previous studies. In NHS, during 1,567,144 person-years of follow-up, 2,055 participants developed CHD; in HPFS, 2,015 participants developed CHD during 517,312 person-years of follow-up. ABO blood group was significantly associated with the risk of developing CHD in both women and men (log-rank test; P = 0.0048 and 0.0002 respectively). In the combined analysis adjusted for cardiovascular risk factors, compared with participants with blood group O, those with blood groups A, B or AB, were more likely to develop CHD (adjusted hazard ratios [95% CI] for incident CHD were 1.06 [ 0.99-1.15], 1.15 [ 1.04-1.26], and 1.23 [1.11-1.36]; respectively). Overall, 6.27% of the CHD cases were attributable to inheriting a non-O blood group. Meta-analysis indicated that non-O blood group had higher risk of CHD (RR= 1.11; 95% CI, 1.05 – 1.18; P = 0.001) compared with O blood group.
Conclusions
These data suggest that ABO blood group is significantly associated with CHD risk. Compared with other blood groups, those with the blood type O have moderately lower risk of developing CHD.
Keywords: ABO, coronary heart disease, cohort study, meta-analysis
Human blood group antigens are glycoproteins and glycolipids expressed on the surface of red blood cells, and a variety of human tissues, including epithelium, sensory neurons, platelets and vascular endothelium.1 It has long been acknowledged that human ABO blood type might affect the risk factors of cardiovascular disease. In non-O individuals, plasma levels of factor VIII (FVIII) -von Willebrand factor (vWF) complex are approximately 25% higher than group O individuals.2 Accumulating evidence indicates that elevated FVIII-vWF levels are a risk factor for coronary heart disease (CHD). 3, 4 Other studies also indicate that ABO blood group might influence plasma lipid levels.5, 6 Recently, several genome-wide association studies found that variants at ABO locus were associated with plasma lipid levels7, 8 and inflammatory markers including soluble intercellular adhesion molecule 1 (sICAM-1),9, 10 plasma soluble E-selectin levels 11, 12 and P-selectin levels,10 and tumor necrosis factor-alpha (TNF-α),13 which were markers of inflammation associated with the CHD risk.
A number of epidemiologic studies have examined the relation between ABO blood type and risk of cardiovascular diseases. In 2008, a meta-analysis investigated the associations between several types of vascular disease and ABO blood groups.14 A consistent relation between non-O blood group and an increased CHD risk was observed in cross-sectional case-control studies;15-17 however, data from prospective cohort studies were inconsistent,18-22 probably due to the small sample size of these cohort studies.
In this study, we conducted prospective analyses on human blood groups and CHD risk in two large cohorts: the Nurses’ Health Study (NHS) and the Health Professionals Follow-up Study (HPFS). In addition, we also combined our data with previously published prospective studies in a meta-analysis.
Methods
Study population
The NHS cohort began in 1976 when 121,700 female nurses aged 30-55 years living in 11 U.S. states responded to a questionnaire regarding medical, lifestyle, and other health-related information. Questionnaires have been sent biennially to update this information. Diet intakes were assessed by food frequency questionnaire (FFQ) in 1980, 1984, 1986, 1990, 1994, 1998, and 2002. At baseline, we excluded those with a history of CHD, cancer, stroke, coronary artery bypass graft or angina. After these exclusions, 62,073 women reporting their ABO blood group had follow-up from 1980 through 2006 and were included in the analyses.
The HPFS enrolled in 51,529 males aged 40 to 75 years at baseline in 1986. The cohort participants are sent a biennial questionnaire regarding medical conditions and lifestyle characteristics such as smoking status, medication use, and physical activity. Every four years, the participants are sent a FFQ to assess their diet intakes. We excluded those who reported a history of myocardial infarction (MI), angina, coronary artery bypass graft, stroke, or cancer on the baseline questionnaire, resulting in a baseline population of 27,428 with ABO blood group data for the current analysis. This study was approved by the Harvard Institutional Review Board, and all participants provided written informed consent.
Assessment of ABO blood group
The assessment of ABO blood group has been described in detail elsewhere.23 Briefly, in both the NHS and HPFS, participants were asked to report their blood type (A, B, AB, O, or unknown) and their Rh factor (positive, negative, or unknown) on the 1996 questionnaire. We conducted a validation study by performing serologic testing in a subsample of 98 subjects. The consistency of self-reported and serologically confirmed ABO blood type was 93% for NHS and 90% for HPFS, and the consistency of self-reported and serologically confirmed Rh type was 100% for NHS and 96% for HPFS. We also validated the self-report ABO blood type using germline genetic data in 187 participants from NHS and HPFS and found 92% concordance.24 Of the participants in the NHS and HPFS who returned the 1996 questionnaire, 75% reported ABO blood group; of these, 92.3% also reported Rh factor type. The characteristics of those participants who provided blood type and those who did not were similar (data not shown).
Assessment of covariates
BMI was calculated as weight in kilograms divided by the square of height in meters (kg/m2). Physical activity was expressed as metabolic equivalents (MET) per hour, which were calculated with data from a self-report questionnaire focused on types and durations of activities over the previous year. Participants were also asked about recent smoking status (current, past, never), alcohol intake, and aspirin use, history of hypertension, high blood cholesterol, and diabetes mellitus, and parental history of CHD before age 60. To represent the long-term intake of dietary factors and to reduce measurement error, we conducted analyses using updating dietary data by taking the average of all available dietary questionnaires.25
Ascertainment of CHD endpoint
We identified incident cases of CHD (non-fatal MI or fatal CHD) that occurred after the return of the 1980 questionnaire but before June 1, 2006 in women (NHS) and occurred between the return of the 1986 questionnaire and June 1, 2006 in men (HPFS). We requested permission to review medical records of the participants who reported having a MI on each biennial questionnaire. A physician unaware of the self-reported risk factor status verified the report of MI through review of medical/hospital records by using the World Health Organization criteria of symptoms and either typical ECG changes or elevated cardiac enzymes. 26 Fatal CHD was confirmed by medical records or autopsy reports, or by CHD listed as the cause of death on the death certificate and there was evidence of previous CHD in the records. Deaths were ascertained from state vital statistics records and the National Death Index or reported by the family members and the postal system.
Statistical analysis
We used Cox proportional hazards models to assess the association between the ABO blood group and risk of CHD. For multivariate analysis, we adjusted for the following potential confounders, which were updated at each 2-year cycle: age (continuous), smoking (never, past, current with cigarette use of 1-14/day, 15-24/day, 25+/day, missing), BMI (< 22.0, 22.0-22.9, 23.0-24.9, 25.0-28.9, ≥29.0 kg/m2), alcohol intake (0g/day, up to 5g/day, 5-15g/day, >15g/day), parental history of CHD before age 60 (yes/no), physical activity (MET h/wk in quintiles), aspirin use (<1/wk, 1-2/wk, 3-6/wk, 7-14/wk, 15+/wk), menopausal status and postmenopausal hormone use (pre-menopausal, never, past, current hormone use) in women, history of hypertension (yes or no), history of high blood cholesterol (yes or no), and history of diabetes (yes or no). We also adjusted for race/ethnicity (white or non-white) and dietary factors, which were updated at 4-year cycle: multiple vitamin or vitamin E supplement (yes or no), total energy intake, polyunsaturated, saturated and trans fats, long-chain omega-3 fatty acids, dietary fiber, and folate intake (all in quintiles). In secondary analyses, we conducted stratified analyses by age (< 65 and ≥65 y), BMI (< 25 and ≥25 kg/m2), smoking (never or past and current smoking), alcohol intake (drinking and non-drinking), physical activity (median as cutpoint), and diabetes history (yes or no). Tests of interaction between ABO blood group and potential effect modifiers were assessed by entering the cross-product of ABO blood group and the dichotomized covariate into the Cox proportional hazard model. We used the log-rank test to compare the CHD-free survival among ABO blood group and cumulative pure incidence curves to plot 1-Kaplan-Meier survival rate.27
Meta-analysis
The MEDLINE and EMBASE database was searched up to May 2010 for published articles on cohort studies that examined ABO blood group in relation to risk of CHD. Keywords used to identify relevant articles were: “cardiovascular disease” (as standardized medical subject heading [MeSH] term) AND (“ABO blood group system”). Together with the current study, a total of seven studies were included in our meta-analysis. Data extraction was independently performed by two of the authors (MAH and LQ) and there were no differences in the extracted information. We used the STATA version 9.2 statistical program (STATA, http://www.stata.com/) to conduct the meta-analysis. Summary measures were calculated from the logarithm of the RRs and corresponding standard errors of the individual studies using random effects models that incorporate both a within study and an additive between-studies component of variance.28 The heterogeneity of study results was calculated using the Cochran Q test 29 and the I2 statistic. 29 Visual inspection of the funnel plot, Begg, and Egger tests were used to evaluate possible publication bias.30, 31
Results
Baseline characteristics
In both NHS and HPFS, the baseline characteristics of the participants were similar across the four ABO blood groups (Table 1). The distributions of the ABO blood groups were comparable between NHS and HPFS cohorts. The frequency for blood type O, A, B, and AB was 42.9%, 36.0%, 13.3%, and 7.8% in women and 43.0%, 37.2%, 12.3%, and 7.5% in men.
Table 1.
Baseline Characteristics of study subjects according to ABO blood type in NHS (1980) and HPFS (1986)
| Characteristic | NHS | HPFS | ||||||
|---|---|---|---|---|---|---|---|---|
|
| ||||||||
| O | A | B | AB | O | A | B | AB | |
| No. of subjects | 26640 | 22358 | 8263 | 4812 | 11801 | 10213 | 3365 | 2049 |
| Percentage of subjects (%) | 42.9 | 36.0 | 13.3 | 7.8 | 43.0 | 37.2 | 12.3 | 7.5 |
| Age, y | 45.9 (7.1) | 45.8 (7.1) | 45.7 (7.1) | 46.9 (6.9) | 53.1 (9.0) | 53.0 (8.8) | 53.1 (8.9) | 53.1 (9.4) |
| White, % | 96.9 | 97.8 | 96.2 | 96.3 | 95.8 | 96.6 | 93.3 | 93.8 |
| BMI, kg/m2 | 24.3 (4.5) | 24.2 (4.2) | 24.3 (4.9) | 24.1 (4.6) | 25.4 (3.1) | 25.4 (3.1) | 25.4 (3.1) | 25.4 (3.1) |
| Physical activity, METs* | 14.3 (19.1) | 13.9 (19.3) | 14.5 (17.8) | 15.2 (17.6) | 21.5 (29.2) | 21.4 (28.4) | 21.9 (29.9) | 22.6 (34.0) |
| Current smoking, % | 26.8 | 25.7 | 26.4 | 26.2 | 8.9 | 8.5 | 9.2 | 9.9 |
| Alcohol intake, g/d | 5.16 (9.08) | 5.04 (9.63) | 5.11 (8.88) | 5.37 (8.07) | 11.6 (15.6) | 11.5 (14.9) | 11.1 (14.7) | 11.2 (15.4) |
| Postmenopausal, % | 28.6 | 28.1 | 28.0 | 32.5 | - | - | - | - |
| Current PMH users, % | 23.5 | 22.5 | 20.7 | 21.2 | - | - | - | - |
| Total energy intake, kcal/d | 1761 (519) | 1761 (501) | 1746 (496) | 1757 (550) | 2019 (618) | 2015 (616) | 1964 (603) | 2000 (632) |
| History of hypertension, % | 14.4 | 13.6 | 14.0 | 14.8 | 18.9 | 18.2 | 18.0 | 20.7 |
| History of high cholesterol, % | 4.6 | 4.8 | 4.7 | 5.3 | 9.9 | 11.4 | 11.2 | 11.7 |
| History of diabetes, % | 1.51 | 1.51 | 1.67 | 1.70 | 1.69 | 1.78 | 1.72 | 3.03 |
| Family history of CHD, % | 15.5 | 15.6 | 16.2 | 16.0 | 12.0 | 12.4 | 11.8 | 14.7 |
BMI, body mass index; CHD, coronary heart disease; MET, metabolic equivalents; NHS, Nurses’ Health Study; HPFS, Health Professionals Follow-up Study; PMH, postmenopausal hormones.
In NHS, the physical activity data in 1986 was used. The continuous variables are presented as mean (SD) and the categories variables presented as percentage.
ABO blood group and CHD risk
During up to 26 years of follow-up of 62,073 women (1,567,143 person-years) in the NHS, we confirmed 2,055 CHD cases (including 1,666 non-fatal MI and 389 fatal CHD); in HPFS, the period of follow-up was 20 years and 2,015 CHD cases (including 1,420 non- fatal MI and 595 fatal CHD) were documented in 27,428 subjects (517,313 person-years). The incident rates of CHD per 100,000 person-years were 125, 128, 142, and 161 for those with blood type O, A, B, and AB in women and 373, 382, 387, and 524 for those with blood type O, A, B, and AB in men. The cumulative incidence of CHD was statistically significantly different among the four ABO blood groups in both cohorts (log-rank test; P = 0.0048 in NHS and 0.0002 in HPFS; respectively; Figure 1). In the combined analysis, compared with participants with blood group O, those with blood groups A, B, or AB were more likely to develop CHD (age-adjusted hazard ratios [95% CI] for CHD, 1.05 [0.98-1.13], 1.11 [1.01-1.23], and 1.23 [1.10-1.37], respectively) (Table 2). The associations were not substantially altered by multivariate adjustment for other potential risk factors and dietary factors (multivariate-adjusted hazard ratios [95% CI] for CHD, 1.08 [1.00-1.16], 1.11 [1.00-1.24], and 1.20 [1.07-1.36]; respectively) (Table 2). The associations of the risks of CHD with ABO blood groups were not substantially altered by excluding diabetes patients diagnosed at baseline. In addition, restriction of the analysis to whites only (97.1% in NHS and 95.7% in HPFS) did not alter these associations; compared with the O blood group, the A, B, and AB groups had increasing risk of CHD (combined hazard ratios [95% CI] for CHD, 1.08 [1.00-1.16], 1.10 [1.00-1.21], and 1.20 [1.07-1.35]).
Figure 1. Cumulative incidence curves for CHD by ABO blood group in NHS and HPFS.

Number of participants at risk is shown for selected times.
Table 2.
Age-adjusted and multivariable-adjusted hazard ratios and 95% confidence intervals for CHD by ABO blood type
| Cohort | O | A | B | AB |
|---|---|---|---|---|
| NHS | ||||
| No. of cases/No. of person-years | 841/673089 | 723/564896 | 296/208358 | 195/120801 |
| Age-adjusted HR (95% CI) | 1.0 | 1.04(0.94-1.15) | 1.14(1.00-1.30) | 1.20(1.02-1.40) |
| Multivariate model 1 HR (95% CI)* | 1.0 | 1.06(0.96-1.17) | 1.15(1.00-1.31) | 1.20(1.03-1.41) |
| Multivariate model 2 HR (95% CI)† | 1.0 | 1.08(0.97-1.21) | 1.15(0.99-1.33) | 1.24(1.05-1.48) |
| HPFS | ||||
| No. of cases/No. of person-years | 833/223128 | 737/192687 | 246/63531 | 199/37966 |
| Age-adjusted HR (95% CI) | 1.0 | 1.07(0.96-1.18) | 1.10(0.95-1.27) | 1.26(1.07-1.48) |
| Multivariate model 1 HR (95% CI)* | 1.0 | 1.08(0.97-1.19) | 1.08(0.93-1.25) | 1.18(1.00-1.39) |
| Multivariate model 2 HR (95% CI)† | 1.0 | 1.08(0.97-1.19) | 1.08(0.93-1.25) | 1.17(1.00-1.38) |
| Combined | ||||
| Age-adjusted HR (95% CI) | 1.0 | 1.05(0.98-1.13) | 1.11(1.01-1.23) | 1.23(1.10-1.37) |
| Multivariate model 1 HR (95% CI) | 1.0 | 1.07(0.99-1.15) | 1.11(1.01-1.23) | 1.19(1.06-1.33) |
| Multivariate model 2 HR (95% CI) | 1.0 | 1.08(1.00-1.16) | 1.11(1.00-1.24) | 1.20(1.07-1.36) |
CHD, coronary heart disease; CI, confidence interval; HPFS, Health Professionals Follow-up Study; HR, hazard ratios; NHS, Nurses’ Health Study.
adjusted for age (continuous), smoking (never, past, current with cigarette use of 1-14/day, 15-24/day, 25+/day, missing), BMI (< 23.0, 23.0-25.0, 25.0-29.0, ≥29.0), alcohol intake (0g/day, up to 5g/day, 5-15g/day, >15g/day), parental history of myocardial infarction before age 60 (yes/no), physical activity (MET h/wk in quintiles), aspirin use (<1/wk, 1-2/wk, 3-6/wk, 7-14/wk, 15+/wk), history of hypertension and high blood cholesterol and type 2 diabetes (yes or no), race/ethnicity (white or non-white), and menopausal status and postmenopausal hormone use (pre-menopausal, never, past, current hormone use) in women;
adjusted for covariates in model 1 plus dietary factors including multiple vitamin or vitamin E supplement (yes or no), total energy intake, polyunsaturated, saturated and trans fats, long-chain omega-3 fatty acids, dietary fiber, and folate intake (all in quintiles).
We also examined the risk of CHD by comparing the non-O blood type (A, B and AB) with the O blood type. Compared to participants reporting blood group O, those with non-O blood type had an age-adjusted hazard ratio of 1.09 (95% CI, 1.03-1.17). Adjustment for other potential risk factors for CHD did not materially alter the associations (hazard ratio, 1.10; 95% CI, 1.03-1.18). The population attributable risk (PAR) of the non-O blood group (A, B, and AB) for CHD was 6.27%. In contrast, we did not find association between Rh type and CHD risk in either cohort or in the combined analyses; compared with participants who were Rh-positive, those who were Rh-negative experienced a multivariate-adjusted hazard ratio of 0.98 (95% CI, 0.90-1.06; P = 0.58) in the combined samples (Table 3).
Table 3.
Age-adjusted and multivariable-adjusted hazard ratios and 95% confidence intervals for CHD by ABO blood type and Rh factor type
| Cohort | Rh factor
|
P value | ABO blood group
|
P value | ||
|---|---|---|---|---|---|---|
| Positive | Negative | O | Non-O | |||
| NHS | ||||||
| No. of cases/No. of person-years | 1453/1163643 | 465/331107 | 841/673089 | 1214/894055 | ||
| Age-adjusted HR (95% CI) | 1.0 | 1.05(0.94-1.16) | 0.40 | 1.0 | 1.08(0.99-1.18) | 0.07 |
| Multivariate model 1 HR (95% CI)* | 1.0 | 1.03(0.93-1.14) | 0.59 | 1.0 | 1.10(1.01-1.20) | 0.037 |
| Multivariate model 2 HR (95% CI)† | 1.0 | 1.05(0.93-1.18) | 0.43 | 1.0 | 1.12(1.02-1.24) | 0.02 |
| HPFS | ||||||
| No. of cases/No. of person-years | 1238/350224 | 333/94291 | 833/223128 | 1182/294184 | ||
| Age-adjusted HR (95% CI) | 1.0 | 0.88(0.78-1.00) | 0.049 | 1.0 | 1.10(1.01-1.21) | 0.03 |
| Multivariate model 1 HR (95% CI)* | 1.0 | 0.91(0.80-1.03) | 0.13 | 1.0 | 1.09(1.00-1.20) | 0.057 |
| Multivariate model 2 HR (95% CI)† | 1.0 | 0.90(0.79-1.02) | 0.095 | 1.0 | 1.09(0.99-1.20) | 0.06 |
| Combined | ||||||
| Age-adjusted HR (95% CI) | 1.0 | 0.97(0.90-1.06) | 0.53 | 1.0 | 1.09(1.03-1.17) | 0.005 |
| Multivariate model 1 HR (95% CI) | 1.0 | 0.98(0.90-1.06) | 0.57 | 1.0 | 1.10(1.03-1.17) | 0.0045 |
| Multivariate model 2 HR (95% CI) | 1.0 | 0.98(0.90-1.06) | 0.58 | 1.0 | 1.10(1.03-1.18) | 0.004 |
CHD, coronary heart disease; CI, confidence interval; HPFS, Health Professionals Follow-up Study; HR, hazard ratios; NHS, Nurses’ Health Study.
Adjustment for covariates as described in the footnotes to Table 2.
In stratified analyses, the association between ABO blood group and risk of CHD was not modified by age, physical activity, alcohol consumption, smoking status, or diabetes history in men or women. In women, menopausal status did not modify the association between ABO blood group and CHD risk. We found a significant interaction between the BMI and ABO blood type in relation to CHD risk in women (P for interaction = 0.026). Compared with the O blood group, the non-O blood type (A, B and AB) had a stronger relationship to CHD risk in overweight and obese women than those with BMI < 25 kg/m2. However, this interaction was not confirmed in men (P for interaction = 0.75) (data not shown).
Meta-analysis
Characteristics of the seven prospective cohort studies included in the meta-analysis are shown in Appendix Table 1. The study populations included both men and women, predominantly white populations. Based on data from all prospective studies combined, which included 114,648 participants and 5,741cases of CHD, the pooled RR was 1.06 (95% CI, 0.96 – 1.17; P = 0.266) for non-O blood group compared with O blood group. There was significant heterogeneity among the studies (I2 58%, 95% CI, 4% – 82%; P value for homogeneity test = 0.026). In the meta-regression analysis, the mean age, gender, publication year, follow-up period, and sample size did not modify the associations (P > 0.05). Cumulative meta-analysis indicated that only the study by Suadicani P et al. was significantly inversely associated with CHD risk21. After excluding this study, the heterogeneity test was not significant (I2 0%, 95% CI, 0% – 75%; P value for homogeneity test = 0.68) and the pooled RR was 1.11 (95% CI, 1.05 – 1.18; P = 0.001; Figure 2). We then conducted a sensitivity analysis by omitting one study at a time and calculating the pooled estimate for the remaining studies. The pooled RRs did not change, ranging from 1.09 (95% CI, 1.03 – 1.17) to 1.12 (95% CI, 1.03 – 1.21), indicating that the overall results were not excessively influenced by any one study of the remaining six cohorts. Visual inspection of the funnel plot (Supplementary Figure 1 and 2) and the Begg (P = 0.71) and Egger (P = 0.74) tests did not suggest a publication bias.
Figure 2. Forest plot showing the RR of CHD for non-O blood group for individual cohort studies and all studies combined.
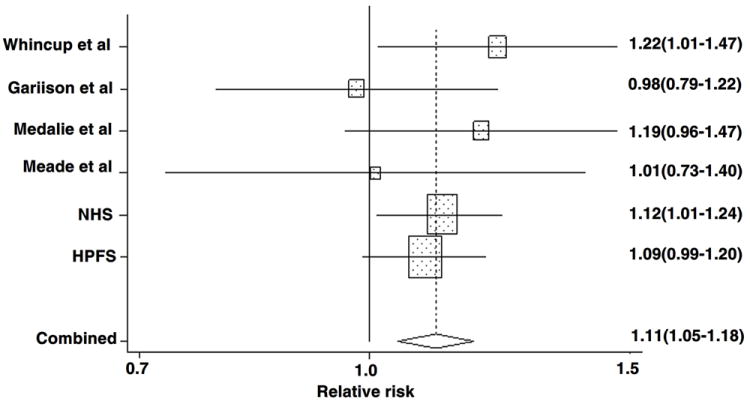
Bars and the diamond indicate 95% CIs. The size of the squares corresponds to the weight of the study in the meta-analysis.
Discussion
In the two large prospective cohorts of the NHS and HPFS, we observed a significantly elevated risk of incident CHD for participants with blood group A or B or AB, compared with those with blood group O. The highest risk was observed for blood group AB, followed by blood groups B and A. The association between ABO blood group and CHD risk was not significantly modified by other known risk factors for CHD, including age, gender, alcohol consumption, smoking, physical activity, or diabetes history. In total, 6.27% of CHD cases were attributable to a non-O blood group (A, B, or AB blood types). A meta-analysis of six prospective studies indicated that non-O blood group was associated with an 11% increased risk of CHD compared with O blood group.
Associations between ABO blood groups and CHD have been investigated for several decades. However, the results have been conflicting, especially for the prospective cohort studies. Recently a meta-analysis reported that individuals with non-O blood group had a statistically significantly higher risk of MI than those with O blood group, however, restricting the analysis to the prospective cohorts did not find significant associations 14. This might be due to the small sample size of these studies.
The mechanisms underlying the associations between ABO blood group and CHD risk remain unclear. However, several lines of evidence support its potential cardiovascular effects. Several studies have reported that plasma levels of factor FVIII-vWf complex in non-O individuals were approximately 25% higher than in group O individuals.2 The vWf has an important role in hemostasis and thrombosis by mediating platelet adhesion to the vascular wall, especially under high shear stress conditions. Along with fibrinogen, vWF also participates in platelet aggregation32, 33 and play a role in the development of atherosclerosis. ABO blood group has been associated with plasma lipid levels; in particular, the A blood group has been noted to have higher levels of serum total cholesterol 5, 6 and low-density lipoprotein cholesterol.5
Recent genetic studies lend further support to the relation between ABO blood type and cardiovascular risk. The ABO gene is located on chromosome 9q34 with three variant alleles (A, B, and O), which encodes glycosyltransferases with different substrate specificities and determines blood type.34 We recently found that the ABO locus was associated with the plasma soluble E-selectin levels in the NHS,11 consistent with findings from another GWA study. 12 ABO locus was also associated with plasma soluble intercellular adhesion molecule 1 (sICAM-1) 9, 10 and soluble P-selectin concentrations. 10 In addition, ABO locus was related to tumor necrosis factor-alpha (TNF-α), 13 which can mediate endothelial cell activation by increasing the expression of adhesion molecules including ICAM-1, vascular adhesion molecule 1 (VCAM-1), and E-selectin.35, 36 All of these inflammatory markers have been associated with increased CHD risk. 37-39
Our findings are less likely to be false positive because of consistent replications in two independent cohorts, and because the meta-analysis confirmed these associations. Also, the prospective analyses minimized selection bias. Nevertheless, there are several potential limitations that need to be considered. First, participants included in this study are a mixture with different ethnicities. It is known that the prevalence of blood types varies across different ethnic groups. However, 97.1% participants in NHS and 95.7% in HPFS were white. When we restricted the analysis to whites, the associations were not appreciably altered. However, it still remains to be determined whether our findings apply to other ethnicities. Also, population stratification might be as a potential confounding in our analysis. However, population stratification has negligible influence on genetic analysis in our study samples, including analysis on ABO blood type11. In addition, the cryptic relatedness might bias the associations. Nevertheless, our previous genome-wide analyses have indicated that cryptic relatedness was very rare in our study samples and less likely affected our current analysis11. Second, although genetic studies have found associations between the ABO locus and risk factors of CHD, it is possible that the ABO locus might be only a marker for other genes due to linkage disequilibrium and might not be directly involved in regulating these risk factors and associated with CHD risk. Also, lack of information about genotypic variation at the ABO gene locus in the whole study samples limited us to distinguish the exact genotype of ABO blood group. Third, because the blood group in our study was self-reported, measurement errors are inevitable. However, because our participants are health care professionals, they tend to report their blood type more accurately than the general population. Our validation study indicated that more than 90% of the participants reported their blood group correctly. In addition, in prospective studies, non-differential measurement errors are likely to attenuate the associations toward null. Finally, although we adjusted for the lifestyle and dietary factors in our analyses, residual confounding due to unmeasured factors might still remain. However, the consistency of findings in NHS and HPFS and the relative homogeneity of the two cohorts with similar educational level and socioeconomic status reduces the likelihood that residual confounding can fully explain the findings in the present study.
In summary, our results from two large prospective cohorts and a meta-analysis of prospective studies suggest that ABO blood group is associated with CHD risk independent of other risk factors. Further studies are needed to confirm these findings and to investigate the potential mechanisms underlying the links between ABO blood type and CHD risk.
Supplementary Material
Acknowledgments
Sources of Funding
This study was supported in part by grants of National Institutes of Health R01 HL71981 and HL034594, P01 HL34594 and CA87969, American Heart Association Scientist Development Award and the Boston Obesity Nutrition Research Center (DK46200 to LQ).
Footnotes
Disclosures
None.
References
- 1.Eastlund T. The histo-blood group ABO system and tissue transplantation. Transfusion. 1998;38:975–988. doi: 10.1046/j.1537-2995.1998.381098440863.x. [DOI] [PubMed] [Google Scholar]
- 2.Gill JC, Endres-Brooks J, Bauer PJ, Marks WJ, Jr, Montgomery RR. The effect of ABO blood group on the diagnosis of von Willebrand disease. Blood. 1987;69:1691–1695. [PubMed] [Google Scholar]
- 3.Folsom AR, Wu KK, Rosamond WD, Sharrett AR, Chambless LE. Prospective study of hemostatic factors and incidence of coronary heart disease: the Atherosclerosis Risk in Communities (ARIC) Study. Circulation. 1997;96:1102–1108. doi: 10.1161/01.cir.96.4.1102. [DOI] [PubMed] [Google Scholar]
- 4.Whincup PH, Danesh J, Walker M, Lennon L, Thomson A, Appleby P, Rumley A, Lowe GD. von Willebrand factor and coronary heart disease: prospective study and meta-analysis. Eur Heart J. 2002;23:1764–1770. doi: 10.1053/euhj.2001.3237. [DOI] [PubMed] [Google Scholar]
- 5.George VT, Elston RC, Amos CI, Ward LJ, Berenson GS. Association between polymorphic blood markers and risk factors for cardiovascular disease in a large pedigree. Genet Epidemiol. 1987;4:267–275. doi: 10.1002/gepi.1370040405. [DOI] [PubMed] [Google Scholar]
- 6.Wong FL, Kodama K, Sasaki H, Yamada M, Hamilton HB. Longitudinal study of the association between ABO phenotype and total serum cholesterol level in a Japanese cohort. Genet Epidemiol. 1992;9:405–418. doi: 10.1002/gepi.1370090604. [DOI] [PubMed] [Google Scholar]
- 7.Teslovich TM, Musunuru K, Smith AV, Edmondson AC, Stylianou IM, Koseki M, Pirruccello JP, Ripatti S, Chasman DI, Willer CJ, Johansen CT, Fouchier SW, Isaacs A, Peloso GM, Barbalic M, Ricketts SL, Bis JC, Aulchenko YS, Thorleifsson G, Feitosa MF, Chambers J, Orho-Melander M, Melander O, Johnson T, Li X, Guo X, Li M, Shin Cho Y, Jin Go M, Jin Kim Y, Lee JY, Park T, Kim K, Sim X, Twee-Hee Ong R, Croteau-Chonka DC, Lange LA, Smith JD, Song K, Hua Zhao J, Yuan X, Luan J, Lamina C, Ziegler A, Zhang W, Zee RY, Wright AF, Witteman JC, Wilson JF, Willemsen G, Wichmann HE, Whitfield JB, Waterworth DM, Wareham NJ, Waeber G, Vollenweider P, Voight BF, Vitart V, Uitterlinden AG, Uda M, Tuomilehto J, Thompson JR, Tanaka T, Surakka I, Stringham HM, Spector TD, Soranzo N, Smit JH, Sinisalo J, Silander K, Sijbrands EJ, Scuteri A, Scott J, Schlessinger D, Sanna S, Salomaa V, Saharinen J, Sabatti C, Ruokonen A, Rudan I, Rose LM, Roberts R, Rieder M, Psaty BM, Pramstaller PP, Pichler I, Perola M, Penninx BW, Pedersen NL, Pattaro C, Parker AN, Pare G, Oostra BA, O’Donnell CJ, Nieminen MS, Nickerson DA, Montgomery GW, Meitinger T, McPherson R, McCarthy MI, McArdle W, Masson D, Martin NG, Marroni F, Mangino M, Magnusson PK, Lucas G, Luben R, Loos RJ, Lokki ML, Lettre G, Langenberg C, Launer LJ, Lakatta EG, Laaksonen R, Kyvik KO, Kronenberg F, Konig IR, Khaw KT, Kaprio J, Kaplan LM, Johansson A, Jarvelin MR, Cecile JWJA, Ingelsson E, Igl W, Kees Hovingh G, Hottenga JJ, Hofman A, Hicks AA, Hengstenberg C, Heid IM, Hayward C, Havulinna AS, Hastie ND, Harris TB, Haritunians T, Hall AS, Gyllensten U, Guiducci C, Groop LC, Gonzalez E, Gieger C, Freimer NB, Ferrucci L, Erdmann J, Elliott P, Ejebe KG, Doring A, Dominiczak AF, Demissie S, Deloukas P, de Geus EJ, de Faire U, Crawford G, Collins FS, Chen YD, Caulfield MJ, Campbell H, Burtt NP, Bonnycastle LL, Boomsma DI, Boekholdt SM, Bergman RN, Barroso I, Bandinelli S, Ballantyne CM, Assimes TL, Quertermous T, Altshuler D, Seielstad M, Wong TY, Tai ES, Feranil AB, Kuzawa CW, Adair LS, Taylor HA, Jr, Borecki IB, Gabriel SB, Wilson JG, Holm H, Thorsteinsdottir U, Gudnason V, Krauss RM, Mohlke KL, Ordovas JM, Munroe PB, Kooner JS, Tall AR, Hegele RA, Kastelein JJ, Schadt EE, Rotter JI, Boerwinkle E, Strachan DP, Mooser V, Stefansson K, Reilly MP, Samani NJ, Schunkert H, Cupples LA, Sandhu MS, Ridker PM, Rader DJ, van Duijn CM, Peltonen L, Abecasis GR, Boehnke M, Kathiresan S. Biological, clinical and population relevance of 95 loci for blood lipids. Nature. 2010;466:707–713. doi: 10.1038/nature09270. [DOI] [PMC free article] [PubMed] [Google Scholar]
- 8.Chasman DI, Pare G, Mora S, Hopewell JC, Peloso G, Clarke R, Cupples LA, Hamsten A, Kathiresan S, Malarstig A, Ordovas JM, Ripatti S, Parker AN, Miletich JP, Ridker PM. Forty-three loci associated with plasma lipoprotein size, concentration, and cholesterol content in genome-wide analysis. PLoS Genet. 2009;5:e1000730. doi: 10.1371/journal.pgen.1000730. [DOI] [PMC free article] [PubMed] [Google Scholar]
- 9.Pare G, Chasman DI, Kellogg M, Zee RY, Rifai N, Badola S, Miletich JP, Ridker PM. Novel association of ABO histo-blood group antigen with soluble ICAM-1: results of a genome-wide association study of 6,578 women. PLoS Genet. 2008;4:e1000118. doi: 10.1371/journal.pgen.1000118. [DOI] [PMC free article] [PubMed] [Google Scholar]
- 10.Barbalic M, Dupuis J, Dehghan A, Bis JC, Hoogeveen RC, Schnabel RB, Nambi V, Bretler M, Smith NL, Peters A, Lu C, Tracy RP, Aleksic N, Heeriga J, Keaney JF, Jr, Rice K, Lip GY, Vasan RS, Glazer NL, Larson MG, Uitterlinden AG, Yamamoto J, Durda P, Haritunians T, Psaty BM, Boerwinkle E, Hofman A, Koenig W, Jenny NS, Witteman JC, Ballantyne C, Benjamin EJ. Large-scale genomic studies reveal central role of ABO in sP-selectin and sICAM-1 levels. Hum Mol Genet. 19:1863–1872. doi: 10.1093/hmg/ddq061. [DOI] [PMC free article] [PubMed] [Google Scholar]
- 11.Qi L, Cornelis MC, Kraft P, Jensen M, van Dam RM, Sun Q, Girman CJ, Laurie CC, Mirel DB, Hunter DJ, Rimm E, Hu FB. Genetic variants in ABO blood group region, plasma soluble E-selectin levels and risk of type 2 diabetes. Hum Mol Genet. 2010;19:1856–1862. doi: 10.1093/hmg/ddq057. [DOI] [PMC free article] [PubMed] [Google Scholar]
- 12.Paterson AD, Lopes-Virella MF, Waggott D, Boright AP, Hosseini SM, Carter RE, Shen E, Mirea L, Bharaj B, Sun L, Bull SB. Genome-wide association identifies the ABO blood group as a major locus associated with serum levels of soluble E-selectin. Arterioscler Thromb Vasc Biol. 2009;29:1958–1967. doi: 10.1161/ATVBAHA.109.192971. [DOI] [PMC free article] [PubMed] [Google Scholar]
- 13.Melzer D, Perry JR, Hernandez D, Corsi AM, Stevens K, Rafferty I, Lauretani F, Murray A, Gibbs JR, Paolisso G, Rafiq S, Simon-Sanchez J, Lango H, Scholz S, Weedon MN, Arepalli S, Rice N, Washecka N, Hurst A, Britton A, Henley W, van de Leemput J, Li R, Newman AB, Tranah G, Harris T, Panicker V, Dayan C, Bennett A, McCarthy MI, Ruokonen A, Jarvelin MR, Guralnik J, Bandinelli S, Frayling TM, Singleton A, Ferrucci L. A genome-wide association study identifies protein quantitative trait loci (pQTLs) PLoS Genet. 2008;4:e1000072. doi: 10.1371/journal.pgen.1000072. [DOI] [PMC free article] [PubMed] [Google Scholar]
- 14.Wu O, Bayoumi N, Vickers MA, Clark P. ABO(H) blood groups and vascular disease: a systematic review and meta-analysis. J Thromb Haemost. 2008;6:62–69. doi: 10.1111/j.1538-7836.2007.02818.x. [DOI] [PubMed] [Google Scholar]
- 15.Tanis B, Algra A, van der Graaf Y, Helmerhorst F, Rosendaal F. Procoagulant factors and the risk of myocardial infarction in young women. Eur J Haematol. 2006;77:67–73. doi: 10.1111/j.1600-0609.2006.00656.x. [DOI] [PubMed] [Google Scholar]
- 16.Platt D, Muhlberg W, Kiehl L, Schmitt-Ruth R. ABO blood group system, age, sex, risk factors and cardiac infarction. Arch Gerontol Geriatr. 1985;4:241–249. doi: 10.1016/0167-4943(85)90006-8. [DOI] [PubMed] [Google Scholar]
- 17.Nefzger MD, Hrubec Z, Chalmers TC. Venous thromboembolism and blood-group. Lancet. 1969;1:887. doi: 10.1016/s0140-6736(69)91925-4. [DOI] [PubMed] [Google Scholar]
- 18.Medalie JH, Levene C, Papier C, Goldbourt U, Dreyfuss F, Oron D, Neufeld H, Riss E. Blood groups, myocardial infarction and angina pectoris among 10,000 adult males. N Engl J Med. 1971;285:1348–1353. doi: 10.1056/NEJM197112092852404. [DOI] [PubMed] [Google Scholar]
- 19.Garrison RJ, Havlik RJ, Harris RB, Feinleib M, Kannel WB, Padgett SJ. ABO blood group and cardiovacular disease: the Framingham study. Atherosclerosis. 1976;25:311–318. doi: 10.1016/0021-9150(76)90036-8. [DOI] [PubMed] [Google Scholar]
- 20.Whincup PH, Cook DG, Phillips AN, Shaper AG. ABO blood group and ischaemic heart disease in British men. Bmj. 1990;300:1679–1682. doi: 10.1136/bmj.300.6741.1679. [DOI] [PMC free article] [PubMed] [Google Scholar]
- 21.Suadicani P, Hein HO, Gyntelberg F. Socioeconomic status, ABO phenotypes and risk of ischaemic heart disease: an 8-year follow-up in the Copenhagen Male Study. J Cardiovasc Risk. 2000;7:277–283. doi: 10.1177/204748730000700406. [DOI] [PubMed] [Google Scholar]
- 22.Meade TW, Cooper JA, Stirling Y, Howarth DJ, Ruddock V, Miller GJ. Factor VIII, ABO blood group and the incidence of ischaemic heart disease. Br J Haematol. 1994;88:601–607. doi: 10.1111/j.1365-2141.1994.tb05079.x. [DOI] [PubMed] [Google Scholar]
- 23.Wolpin BM, Chan AT, Hartge P, Chanock SJ, Kraft P, Hunter DJ, Giovannucci EL, Fuchs CS. ABO blood group and the risk of pancreatic cancer. J Natl Cancer Inst. 2009;101:424–431. doi: 10.1093/jnci/djp020. [DOI] [PMC free article] [PubMed] [Google Scholar]
- 24.Wolpin BM, Kraft P, Gross M, Helzlsouer K, Bueno-de-Mesquita HB, Steplowski E, Stolzenberg-Solomon RZ, Arslan AA, Jacobs EJ, Lacroix A, Petersen G, Zheng W, Albanes D, Allen NE, Amundadottir L, Anderson G, Boutron-Ruault MC, Buring JE, Canzian F, Chanock SJ, Clipp S, Gaziano JM, Giovannucci EL, Hallmans G, Hankinson SE, Hoover RN, Hunter DJ, Hutchinson A, Jacobs K, Kooperberg C, Lynch SM, Mendelsohn JB, Michaud DS, Overvad K, Patel AV, Rajkovic A, Sanchez MJ, Shu XO, Slimani N, Thomas G, Tobias GS, Trichopoulos D, Vineis P, Virtamo J, Wactawski-Wende J, Yu K, Zeleniuch-Jacquotte A, Hartge P, Fuchs CS. Pancreatic cancer risk and ABO blood group alleles: results from the pancreatic cancer cohort consortium. Cancer Res. 70:1015–1023. doi: 10.1158/0008-5472.CAN-09-2993. [DOI] [PMC free article] [PubMed] [Google Scholar]
- 25.Hu FB, Stampfer MJ, Rimm E, Ascherio A, Rosner BA, Spiegelman D, Willett WC. Dietary fat and coronary heart disease: a comparison of approaches for adjusting for total energy intake and modeling repeated dietary measurements. Am J Epidemiol. 1999;149:531–540. doi: 10.1093/oxfordjournals.aje.a009849. [DOI] [PubMed] [Google Scholar]
- 26.Rose GA, Blackburn H, Gillum R, Prineas R. Cardiovascular Survey Methods. Geneva, Switzerland: World Health Organization; 1982. [Google Scholar]
- 27.Kaplan EL, Meier P. Nonparametric estimation from incomplete observations. J Am Stat Assoc. 1958;53:457–481. [Google Scholar]
- 28.DerSimonian R, Laird N. Meta-analysis in clinical trials. Control Clin Trials. 1986;7:177–188. doi: 10.1016/0197-2456(86)90046-2. [DOI] [PubMed] [Google Scholar]
- 29.Higgins JP, Thompson SG. Quantifying heterogeneity in a meta-analysis. Stat Med. 2002;21:1539–1558. doi: 10.1002/sim.1186. [DOI] [PubMed] [Google Scholar]
- 30.Begg CB, Mazumdar M. Operating characteristics of a rank correlation test for publication bias. Biometrics. 1994;50:1088–1101. [PubMed] [Google Scholar]
- 31.Egger M, Davey Smith G, Schneider M, Minder C. Bias in meta-analysis detected by a simple, graphical test. Bmj. 1997;315:629–634. doi: 10.1136/bmj.315.7109.629. [DOI] [PMC free article] [PubMed] [Google Scholar]
- 32.Blann AD. Plasma von Willebrand factor, thrombosis, and the endothelium: the first 30 years. Thromb Haemost. 2006;95:49–55. [PubMed] [Google Scholar]
- 33.Ruggeri ZM. The role of von Willebrand factor in thrombus formation. Thromb Res. 2007;120(Suppl 1):S5–9. doi: 10.1016/j.thromres.2007.03.011. [DOI] [PMC free article] [PubMed] [Google Scholar]
- 34.Reid ME, Mohandas N. Red blood cell blood group antigens: structure and function. Semin Hematol. 2004;41:93–117. doi: 10.1053/j.seminhematol.2004.01.001. [DOI] [PubMed] [Google Scholar]
- 35.Andreakos ET, Foxwell BM, Brennan FM, Maini RN, Feldmann M. Cytokines and anti-cytokine biologicals in autoimmunity: present and future. Cytokine Growth Factor Rev. 2002;13:299–313. doi: 10.1016/s1359-6101(02)00018-7. [DOI] [PubMed] [Google Scholar]
- 36.Pober JS, Cotran RS. Cytokines and endothelial cell biology. Physiol Rev. 1990;70:427–451. doi: 10.1152/physrev.1990.70.2.427. [DOI] [PubMed] [Google Scholar]
- 37.Hwang SJ, Ballantyne CM, Sharrett AR, Smith LC, Davis CE, Gotto AM, Jr, Boerwinkle E. Circulating adhesion molecules VCAM-1, ICAM-1, and E-selectin in carotid atherosclerosis and incident coronary heart disease cases: the Atherosclerosis Risk In Communities (ARIC) study. Circulation. 1997;96:4219–4225. doi: 10.1161/01.cir.96.12.4219. [DOI] [PubMed] [Google Scholar]
- 38.Barbaux SC, Blankenberg S, Rupprecht HJ, Francomme C, Bickel C, Hafner G, Nicaud V, Meyer J, Cambien F, Tiret L. Association between P-selectin gene polymorphisms and soluble P-selectin levels and their relation to coronary artery disease. Arterioscler Thromb Vasc Biol. 2001;21:1668–1673. doi: 10.1161/hq1001.097022. [DOI] [PubMed] [Google Scholar]
- 39.Ridker PM, Hennekens CH, Roitman-Johnson B, Stampfer MJ, Allen J. Plasma concentration of soluble intercellular adhesion molecule 1 and risks of future myocardial infarction in apparently healthy men. Lancet. 1998;351:88–92. doi: 10.1016/S0140-6736(97)09032-6. [DOI] [PubMed] [Google Scholar]
Associated Data
This section collects any data citations, data availability statements, or supplementary materials included in this article.