

Abstract
The design and synthesis of a novel series of Rev-erbα agonists is described. The development and optimization of the tetrahydroisoquinoline series was carried out from an earlier acyclic series of Rev-erbα agonists. Through the optimization of the scaffold 1, several potent compounds with good in vivo profiles were discovered.
The nuclear hormone receptor superfamily (NR) has proven to be a rich source of targets for development of drugs that target a myriad of human diseases1–3. Of the forty-eight members of the NR that exist in humans, roughly half have identified endogenous ligands which modulate the receptors via binding to the ligand binding domain. The other half remain orphan receptors with unidentified or no known natural ligands. The nuclear hormone receptors Rev-erbα and Rev-erbβ were recently deorphanised when the porphyrin heme was identified as the physiological ligand for these receptors4–7. Heme binding is required for these receptors to recruit corepressors such as NCoR so that they may actively repress transcription of their target genes. The observation that Rev-erbs are ligand regulated suggests that development of synthetic ligands may be possible. Both Reverbs have particularly high expression in the liver, adipose tissue, skeletal muscle and brain8–10. The Rev-erbs repress the transcription of key genes involved in a number of physiological processes including circadium rhythm and lipid and glucose metabolism11, 12. Dysregulation of the circadian rhythm is associated with several disorders of the nervous system including bipolar disorder, depression, anxiety, and sleep disorders whereas metabolic effects have roles in diabetes and obesity.
Recently, a novel ligand of Rev-erbα (Figure 1, GSK4112/SR-6452/1) was identified in a fluorescence resonance energy transfer (FRET) assay that significantly and specifically enhances the Reverbα-NCoR interaction with an EC50 value of 400 nM13, 14. The compound was reported to show no activity on related nuclear hormone receptors (LRH1, SF1, FXR, or RORα) using the same FRET assay and no activity on LXRα or LXRβ in reporter-gene assays. This is the first synthetic Rev-erbα ligand described in the literature to date. In our internal cell-based assay, this compound dose-dependently increased the interaction of Rev-erbα with a CoRNR box peptide derived from the transcriptional corepressor NCoR with an EC50=2.3 μM15.
Figure 1.

Rev-erbα lead identified in FRET assay.
Unfortunately, this compound displayed poor rodent pharmacokinetics limiting its use as an in vivo probe. We set out to optimize both the in vitro and in vivo profile of Reverb agonists so as to provide novel tools to interrogate the function of these receptors in vivo. This will hopefully help to validate Rev-erb as a potential drug target for treatment of disorders of the CNS and periphery.
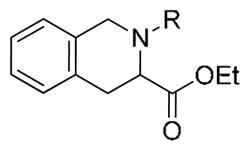
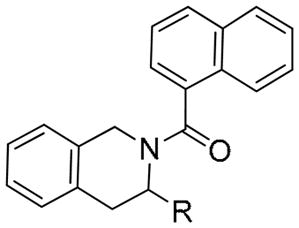
In an effort to restrict free rotation in 1 and possibly improve activity, we investigated restricting two arms of the molecule into a ring as described in Figure 2. Constraining the glycine side chain to the phenyl ring would afford tetrahydroisoquinoline (TIQ) scaffold A. Given the simplicity and commercial availability of the TIQ starting material, chemical structure activity relationships (SAR) began. A few simplifications were made based on SAR that was learned in the acyclic series (1) (to be reported elsewhere). The chlorine atom at the para-position of the benzyl group was not needed for potency, and we began with the ethyl ester rather than t-butyl, full well knowing that we would eventually have to modify or remove this functional group if we had hopes of investigating the compounds in vivo efficacy. Lastly, we looked to replace the nitrothiophene group, which could potentially lead to toxicity issues in vivo.
Figure 2.

Cyclization Approach to Tetrahydroisoquinoline Analogues.
Starting with commercially available TIQ-ethyl ester 2, the amine was functionalized with a variety of groups in a single step (Scheme 1). Reductive aminations gave tertiary amines and acylation with the appropriate electrophile afforded amides, ureas, carbamates and sulfonamides. This led to rapid chemical SAR.
Scheme 1.

Synthesis of Tetrahydroisoquinoline Analogs
Reagents and Conditions: (a) RCOCl, TEA, CH2Cl2; (b) RSO2Cl, pyr, CH2Cl2; (c) RNCO, toluene; (d) ClCO2R, DIEA, CH2Cl2; (e) RCHO, NaBH(OAc)3, ClCH2CH2Cl.
Compounds were screened in a cell based luciferase assay in a two-step format. Cells were co-transfected with an expression plasmid harboring full-length Rev-erbα and a luciferase reporter driven by the Bmal1 promoter. Compounds were first screened at two concentrations (1 μM and 10 μM) to determine the effect on repression of Bmal1 transcription. Rev-erb is a transcriptional repressor. Rev-erb agonists lead to recruitment of co-repressors, which leads to repression of transcription. Maximum inhibition at 10 μM is reported. A value of 1.0 effectively means no repression. Compounds that appeared efficacious were then fully titrated in an eleven-point dose response format to generate EC50 values. In our in-house assay, 1 showed only modest potency and efficacy (Table 1).
Table 1.
Tertiary amine TIQ Rev-erbα agonists

| |||
|---|---|---|---|
| Compound | R | a Max Inh | EC50 (μM) |
| 1 | 0.82 | 2.3 | |
| 3a |

|
0.78 | b NT |
| 3b |

|
1.0 | NT |
| 3c |

|
0.90 | NT |
| 3d |
|
1.0 | NT |
| 3e |

|
1.0 | NT |
| 3f |

|
0.95 | NT |
results are average of 2 or more experiments. Value = fold change relative to DMSO control at 10 μM compound. The lower the number, the more efficacious the agonist in terms of repressing transcription;
NT = not tested.
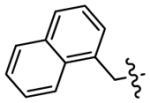
The initial round of analogs investigated were tertiary amines synthesized by reductive amination of the TIQ ester 2 with a variety of aryl and heteroaryl carboxaldehydes (Table 1). The compound closest in structure to acyclic lead 1 was 3a, and exhibited similarly poor relative efficacy with regards to repression of transcription. The other analogs made (3b–3f) displayed equally poor efficacy at a single concentration and therefore, concentration response curves (CRC’s) were not generated.
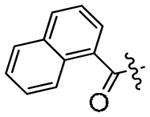
Acylation of the TIQ nitrogen atom was investigated next with a series of aryl and heteroaryl carboxylic acid chlorides (Table 2). Amide groups bearing smaller groups (mono-aryl, and small heterocycles) showed no improvement in activity (3k–n), whereas several biaryl-type derivatives showed modest improvements in efficacy at 10 μM (3g–h, 3o–p). Unfortunately, improved efficacy did not necessarily translate into an improved EC50, as those analogs titrated showed similar potency to acyclic lead 1. The 1-naphthyl analog (3o) and the tetrahydronaphthyl analog 3p exhibited the best in vitro activity amongst the amides synthesized.
Table 2.
Tertiary TIQ amides as Rev-erbα agonists
| |||
|---|---|---|---|
| Compound | R | a Max Inh | EC50 (μM) |
| 3g |

|
0.64 | b NT |
| 3h |

|
0.73 | NT |
| 3i |

|
0.51 | >3.0 |
| 3j |

|
0.81 | NT |
| 3k |

|
0.97 | NT |
| 3l |

|
0.78 | NT |
| 3m |

|
0.97 | NT |
| 3n |

|
1.0 | NT |
| 3o |
|
0.41 | 2.5 |
| 3p |

|
0.53 | 2.1 |
results are average of 2 or more experiments. Value = fold change relative to DMSO control at 10 μM compound. The lower the number, the more efficacious the agonist in terms of repressing transcription;
NT = not tested.
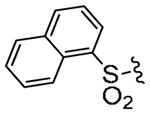
The corresponding sulfonamides, carbamates, and ureas were also investigated (Table 3). In this case, both mono-aryl and bi-aryl sulfonamides exhibited good potency and efficacy (3q–s). Interestingly, all of the carbamates and ureas synthesized were essentially inactive (3t–x). Nonetheless, this was the first time in the cyclic series that compounds with improved potency and efficacy relative to 1 had been identified.
Table 3.
Sulfonamide, carbamate and urea TIQ Rev-erbα agonists

| |||
|---|---|---|---|
| Compound | R | a Max Inh | EC50 (μM) |
| 3q |

|
0.75 | b NT |
| 3r |
|
0.50 | 1.7 |
| 3s |

|
0.51 | 1.1 |
| 3t |

|
1.0 | NT |
| 3u |

|
1.3 | NT |
| 3v |

|
1.0 | NT |
| 3w |

|
1.5 | NT |
| 3x |

|
1.0 | NT |
results are average of 2 or more experiments. Value = fold change relative to DMSO control at 10 μM compound. The lower the number, the more efficacious the agonist in terms of repressing transcription;
NT = not tested.
Having somewhat optimized the nitrogen substituent, we turned our attention to replacing the ester group (Table 4). Chemistry was carried out under standard conditions as described in Scheme 2. The ester was hydrolyzed to the acid and converted to various amides (5a–c). The ester could also be reduced to the primary alcohol (6a). This could then be further derivatized to a variety of ethers either by O-alkylation or through Mitsunobu reactions with phenols (6b–r). In turn, the primary alcohol could be converted to the primary amine via Mitsunobu reaction, and then further functionalized (7a–d). While this chemistry was conducted in racemic fashion, both enantiomers of the parent TIQ ethyl ester are commercially available. This may lead to further improvements in potency.
Table 4.
Naphthylamide TIQ Rev-erbα agonists
| |||
|---|---|---|---|
| Compound | R | a Max Inh | EC50 (μM) |
| 3n | ⌇–CO2ET | 0.41 | 2.5 |
| 4 | ⌇–CO2H | 0.67 | b NT |
| 5a | ⌇–CONH2 | 0.61 | NT |
| 5b | ⌇–CONHPh | 0.59 | NT |
| 5c | ⌇–CONHCH2Ph | 0.55 | >3.0 |
| 6a | ⌇–CH2OH | 0.71 | NT |
| 6b | ⌇–CH2OCOCH3 | 0.65 | NT |
| 6c | ⌇–CH2OPh | 0.37 | 0.84 |
| 6d | ⌇–CH2OCH2Ph | 0.41 | 0.65 |
| 6e | ⌇–CH2O-1-Naphthyl | 0.41 | 1.2 |
| 7a | ⌇–CH2NH2 | 0.74 | NT |
| 7b | ⌇–CH2NHSO2Ph | 0.40 | NT |
| 7c | ⌇–CH2NHCO2CH2Ph | 0.53 | NT |
| 7d | ⌇–CH2NHCH2Ph | 0.43 | >3.0 |
results are average of 2 or more experiments. Value = fold change relative to DMSO control at 10 μM compound. The lower the number, the more efficacious the agonist in terms of repressing transcription;
NT = not tested.
Scheme 2.
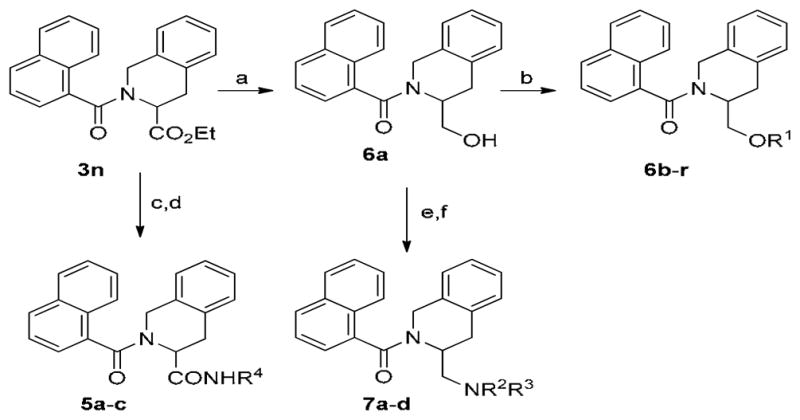
Modifications to C-3 Ester
Reagents and Conditions: (a) LiBH4, MeOH; (b) R1Br, NaH or R1OH, PPh3, DIAD or AcCl, pyr; (c) LiOH, THF; (d) R4NH2, HATU, DIEA; (e) 1. (PhO)2P(O)(N3), PPh3, THF; 2 Pd/C, H2; (f) R2OCOCl or R3SO2Cl, Et3N or R2CHO, NaBH(OAc)3.
As anticipated, the ester was not required for potency, as the corresponding acid (4), and amide derivatives were equally efficacious (5a–c). Derivatives of the primary alcohol were also quite potent and efficacious. Ether analogs 6c and 6d were the first agonists synthesized in this cyclic series with EC50’s < 1 μM. Primary amine analogs (7b–7d) showed improvement in efficacy at 10 μM, however EC50’s were right shifted.
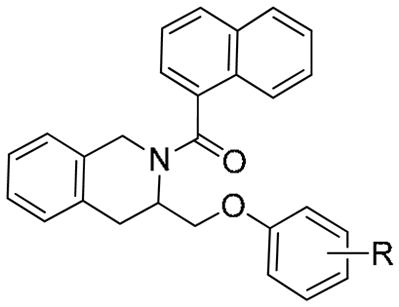
Efforts to further improve in vitro activity were explored by synthesizing substituted analogs of 6c using substituted phenols (Table 5). Substitution at the 4-position with fluorine (6f, 6r) or a phenyl ring (6g) had little effect on potency, however, 4-substitution with a polar residue showed a dramatic increase in activity (as much as 7-fold, 6h). Slight improvement in potency was observed as the alkyl group increased in size from methyl (6h) to ethyl (6i), to n-propyl (6j) which was the most potent compound synthesized with an EC50 = 0.077 μM. Larger groups (t-Bu) were also tolerated (6k). Ortho-methoxy substitution (6n) led to a loss in potency, however meta-substituted analogs (6o–6q) retained good activity.
Table 5.
Substituted Phenyl Ethers as TIQ Reverbα agonists
| |||
|---|---|---|---|
| Compound | R | a Max Inh | EC50 (μM) |
| 6c | H | 0.37 | 0.84 |
| 6f | 4-F | 0.43 | 0.80 |
| 6g | 4-Ph | 0.40 | 0.65 |
| 6h | 4-OMe | 0.38 | 0.12 |
| 6i | 4-OEt | 0.35 | 0.097 |
| 6j | 4-O-n-Pr | 0.45 | 0.077 |
| 6k | 4-O-t-Bu | 0.50 | 0.14 |
| 6l | 4-OCF3 | 0.40 | 0.60 |
| 6m | 4-1,2,4-triazole | 0.35 | 0.12 |
| 6n | 2-OMe | 0.40 | 2.0 |
| 6o | 3-OMe | 0.45 | 0.62 |
| 6p | 3-N(CH3)2 | 0.30 | 0.78 |
| 6q | 3,4-di-OMe | 0.55 | 0.33 |
| 6r | 2,4-diF | 0.45 | 0.71 |
results are average of 2 or more experiments. Value = fold change relative to DMSO control at 10 μM compound. The lower the number, the more efficacious the agonist in terms of repressing transcription.
These analogs show improved potency and efficacy relative to the lead (1), and are devoid of a nitro group. Having improved the potency and efficacy through modification of the TIQ side chain, and given the iterative nature of medicinal chemistry, future rounds of SAR will go back and reinvestigate the TIQ nitrogen group as well as substitution of the TIQ aryl ring. The p-toluenesulfonyl analog 3s was twice as potent as the corresponding naphthoyl amide (3o), so perhaps there is more potency to be gained by mixing and matching optimal substituents at both positions. These efforts are on-going.
Several compounds from this series were profiled in vivo (Table 6)16. The initial lead 1 is a poor tool for in vivo use given its poor in vivo pharmacokinetic (PK) profile. Its PK profile is characterized by very high plasma clearance, high volume of distribution, and poor oral bioavailability in rats. However, it has a fairly low polar surface area, leading to good brain penetration in mice despite poor plasma exposure. TIQ analogs 6d and 7d have a much lower clearance rate, volume of distribution, and longer half-life, although they too, have poor oral absorption. They do, however, have decent brain penetration. The t-butoxy analog 6k has the best plasma and brain exposure of the compounds investigated. Following a single 10mg/kg dose, there is 20-fold drug concentration in brain at t=2h relative to its EC50. Further refinements in structure will look at improving in vivo exposure including plasma and brain penetration.
Table 6.
In vivo data of Selected Rev-erbα agonists.
| Cpd | 1 t1/2 (h) | Clp (mL/min/kg) | Vd (L/kg) | %F | 2[plasma] μM | [brain] μM | 3%b.p. |
|---|---|---|---|---|---|---|---|
| 1 | 0.4 | 353 | 9.9 | 0 | 0.25 | 0.35 | 140 |
| 6d | 1.9 | 39 | 3.8 | 0 | 1.2 | 0.3 | 25 |
| 7d | 1.7 | 43 | 3.8 | 0 | NT | NT | NT |
| 6j | NT | NT | NT | NT | 0.61 | 0.40 | 67 |
| 6k | NT | NT | NT | NT | 0.45 | 1.5 | 333 |
rat pharmacokinetics, 1mg/kg i.v., 2 mg/kg p.o.;
compound dosed 10 mg/kg IP in mice, plasma and brain levels at t= 2h;
b.p. = brain penetration.
In summary, a novel series of TIQ Rev-erbα agonists has been developed based on the lead 1. Optimization of this scaffold by modification of the nitrogen substitution as well as the C-3 position side chain led to a series of potent and efficacious Rev-erbα agonists. Several compounds from this class have improved pharmacokinetics and brain penetration relative to the lead structure 1. Evaluation of compounds of this type in vivo in models of circadian rhythm is ongoing and will be reported in due course.
Footnotes
Publisher's Disclaimer: This is a PDF file of an unedited manuscript that has been accepted for publication. As a service to our customers we are providing this early version of the manuscript. The manuscript will undergo copyediting, typesetting, and review of the resulting proof before it is published in its final citable form. Please note that during the production process errors may be discovered which could affect the content, and all legal disclaimers that apply to the journal pertain.
References
- 1.Schulman IG. Adv Drug Deliv Rev. 2010;62(13):1307–15. doi: 10.1016/j.addr.2010.07.002. [DOI] [PMC free article] [PubMed] [Google Scholar]
- 2.Levi M, Wang X, Choudhury D. Contrib Nephrol. 2011;170:209–16. doi: 10.1159/000325668. [DOI] [PubMed] [Google Scholar]
- 3.Burris TP, Busby SA, Griffin PR. Chem Biol. 2012;19(1):51–9. doi: 10.1016/j.chembiol.2011.12.011. [DOI] [PMC free article] [PubMed] [Google Scholar]
- 4.Raghuram S, Stayrook KR, Huang P, Rogers PM, Nosie AK, McClure DB, Burris LL, Khorasanizadeh S, Burris TP, Rastinejad F. Nat Struct Mol Biol. 2007;14(12):1207–13. doi: 10.1038/nsmb1344. [DOI] [PMC free article] [PubMed] [Google Scholar]
- 5.Yin L, Wu N, Curtin JC, Qatanani M, Szwergold NR, Reid RA, Waitt GM, Parks DJ, Pearce KH, Wisely GB, Lazar MA. Science. 2007;318(5857):1786–9. doi: 10.1126/science.1150179. [DOI] [PubMed] [Google Scholar]
- 6.Burris TP. Mol Endocrinol. 2008;22(7):1509–20. doi: 10.1210/me.2007-0519. [DOI] [PMC free article] [PubMed] [Google Scholar]
- 7.Kumar N, Solt LA, Wang Y, Rogers PM, Bhattacharyya G, Kamenecka TM, Stayrook KR, Crumbley C, Floyd ZE, Gimble JM, Griffin PR, Burris TP. Endocrinology. 2010;151(7):3015–25. doi: 10.1210/en.2009-0800. [DOI] [PMC free article] [PubMed] [Google Scholar]
- 8.Dumas B, Harding HP, Choi HS, Lehmann KA, Chung M, Lazar MA, Moore DD. Mol Endocrinol. 1994;8(8):996–1005. doi: 10.1210/mend.8.8.7997240. [DOI] [PubMed] [Google Scholar]
- 9.Forman BM, Chen J, Blumberg B, Kliewer SA, Henshaw R, Ong ES, Evans RM. Mol Endocrinol. 1994;8(9):1253–61. doi: 10.1210/mend.8.9.7838158. [DOI] [PubMed] [Google Scholar]
- 10.Bonnelye E, Vanacker JM, Desbiens X, Begue A, Stehelin D, Laudet V. Cell Growth Differ. 1994;5(12):1357–65. [PubMed] [Google Scholar]
- 11.Feng D, Liu T, Sun Z, Bugge A, Mullican SE, Alenghat T, Liu XS, Lazar MA. Science. 2011;331(6022):1315–9. doi: 10.1126/science.1198125. [DOI] [PMC free article] [PubMed] [Google Scholar]
- 12.Solt LA, Kojetin DJ, Burris TP. Future Med Chem. 2011;3(5):623–38. doi: 10.4155/fmc.11.9. [DOI] [PMC free article] [PubMed] [Google Scholar]
- 13.Meng QJ, McMaster A, Beesley S, Lu WQ, Gibbs J, Parks D, Collins J, Farrow S, Donn R, Ray D, Loudon A. J Cell Sci. 2008;121(Pt 21):3629–35. doi: 10.1242/jcs.035048. [DOI] [PMC free article] [PubMed] [Google Scholar]
- 14.Grant D, Yin L, Collins JL, Parks DJ, Orband-Miller LA, Wisely GB, Joshi S, Lazar MA, Willson TM, Zuercher WJ. ACS Chem Biol. 2010;5(10):925–32. doi: 10.1021/cb100141y. [DOI] [PubMed] [Google Scholar]
- 15.Unpublished in-house data.
- 16.Rat Pharmacokinetics and Mouse Brain Penetration: Pharmacokinetics of test compounds was assessed in Sprague-Dawley rats (n = 3). Compounds were dosed intravenously at 1 mg/kg and orally by gavage at 2 mg/kg. Blood was taken at eight time points (5, 15, 30 min, 1, 2, 4, 6, 8 h) and collected into EDTA containing tubes and plasma was generated using standard centrifugation techniques. Plasma proteins were precipitated with acetonitrile and drug concentrations were determined by LC-MS/MS. Data was fit by WinNonLin using a noncompartmental model and basic pharmacokinetic parameters including peak plasma concentration (Cmax), oral bioavailability, exposure (AUC), half-life (t1/2), clearance (CL), and volume of distribution (Vd) were calculated. CNS exposure was evaluated in C57Bl6 mice (n = 3). Compounds were dosed at 10 mg/kg intraperitoneally and after 2 h blood and brain were collected. Plasma was generated and the samples were frozen at −80°C. The plasma and brain were mixed with acetonitrile (1:5 v:v or 1:5 w:v, respectively). The brain sample was sonicated with a probe tip sonicator to break up the tissue, and samples were analyzed for drug levels by LCMS/MS. Plasma drug levels were determined against standards made in plasma and brain levels against standards made in blank brain matrix. All procedures were approved by the Scripps Florida IACUC.