Abstract
We describe a method that enabled us to observe large numbers of individual bacterial cells during a long period of cell growth and proliferation. We designed a flow chamber in which the cells attached to a transparent solid surface. The flow chamber was mounted on a microscope equipped with a digital camera. The shear force of the flow removed the daughter cells, making it possible to monitor the consecutive divisions of a single cell. In this way, kinetic parameters and their distributions, as well as some physiological characteristics of the bacteria, could be analyzed based on more than 1,000 single-cell observations. The method which we developed enabled us to study the history effect on the distribution of the lag times of single cells.
The dynamics of bacterial populations is now frequently studied by observing and describing the behavior of single cells. At a recent conference on predictive microbiology (Quimper, France, 16 to 19 June 2003), several papers and a keynote lecture were dedicated to the connection between single-cell observations and bacterial population dynamics (13). The interest in this area is due to the recognition that probability-based methods (such as quantitative microbial risk assessment) have to take into account the distributions of kinetic parameters in a cell population and that these distributions cannot be derived from observations made at the cell population level.
For a bacterial growth curve describing the variation of a cell population with time, Baranyi and Pin (2) showed the mathematical equivalence between the transition from the lag phase to the exponential phase (curvature) and the distribution of the first division times of individual cells. However, as Baranyi (1) pointed out, mapping from the distribution to the curvature is theoretically invertible; in practice, for numerical reasons, it is impossible to identify the distribution of individual lag times from the curves for log cell concentration versus time (called population growth curves below). Hence, this distribution provides more fundamental information than the population growth curves.
It is therefore desirable to observe single cells to study the lag time or, more generally, the early stages of growth. McKellar and Lu (10) emphasized that modeling the bacterial lag (whose characterization is imperative in food microbiology) is inherently difficult; new measurements of the distribution of the physiological state of single cells in the population is necessary to improve predictive models. So far, however, workers have described very few reliable methods for observing the division times of sufficiently large numbers of individual cells so that statistically robust distributions can be identified from the observations.
Analysis of bacterial growth at the single-cell level can be traced back to the study of Kelly and Rahn (6), who suggested a method for detecting the growth rate of individual cells by using a piece of agar placed under a microscope. These authors observed a slight decrease in the individual division times with the number of generations. Powell (11) suggested a flow chamber approach in which a cellophane membrane separates the cells from a flowing medium. This method enabled him to change the environment and to monitor the change in growth.
Newer techniques for single-cell studies include turbidimetry (9), in which a serially diluted culture is inoculated into a multiwell plate with approximately one cell per well and the turbidity is measured with an automated plate reader. The detection level is ca. 106 to 107 cells/well (depending on cell size, etc.), which means that the original bacterium has undergone some 20 divisions. Another common technique is flow cytometry (12), in which a sample from a culture is measured to determine DNA content and size. This technique, which can be considered a technique which provides a snapshot of a culture, allows a large number of cells to be analyzed, but a single cell is not observed for a longer period. To solve the latter problem, Wakamoto et al. (14) used lithographic techniques to create micrometer-size wells and optical tweezers to transfer a single bacterium from one well to another. In this way, it was possible to observe consecutive divisions of the same cell, although a very limited number of cells could be analyzed in each experiment.
Flow cells are widely used in biofilm and microcolony studies (4), but they are used less frequently in single-cell studies (3, 8, 11). The reason for this is that the flow is insufficient to remove the daughter cells, so the surface rapidly becomes crowded and either it is impossible to measure the individual growth rate or the growth rate is significantly influenced by the surrounding cells. Because our aim was to measure individual cell growth, it was essential that the daughter cells were removed, a method described by Kjelleberg et al. (7).
A common approach in single-cell studies is to put a bacterial suspension onto an agar surface and let the liquid evaporate, thereby attaching the cells. This simple method gives rise to a number of problems; the agar is not rigid enough, and it moves and looses water when it is exposed to heat from the source of illumination, making proper time course studies difficult. Rapidly growing bacteria tend to outgrow their neighbors, making temporal and spatial analysis difficult. These problems can be solved by using a flow chamber in which the cells are attached to a solid surface and exposed to a sufficiently fast flow to feed the bacteria and remove any newborn cells without removing significant numbers of the original bacteria. By using dark-field illumination and a low magnification, a large number of bacteria can be monitored in each experiment.
Our flow cell design made it possible to study some visible physiological characteristics of individual cells, as well as the distribution of cells in the population, since many cells could be observed. The characteristics studied included the size of the cells before and after division, the variation in successive generation times of the same cell, the spatial and temporal distributions of the cell size, and the generation time within the population. By changing the culture conditions, such as temperature, pH, medium components, vitamins, antibiotics, toxins, etc., the effects of these factors on the visible physiological state of the cells could be investigated.
MATERIALS AND METHODS
Inoculum preparation. (i) Escherichia coli.
One colony of E. coli strain MRE C600 was picked from an agar plate and inoculated into a flask containing 100 ml of Luria-Bertani medium (10 g of tryptone per liter, 5 g of yeast extract per liter, 10 g of NaCl per liter; pH 7.2) with 0.2% glucose. The flask was shaken for 18 h at 37°C until the culture reached the stationary phase. This culture was used to inoculate the flow chamber.
(ii) Listeria innocua.
L. innocua strain Li73/99 growing on a stock tryptone soya agar (Oxiod CM131) slope was subcultured in tryptone soya broth (Oxoid CM129) and incubated for 24 h at 30°C. This culture was diluted 1:1,000 in peptone salt dilution fluid (1 g of Bacto Peptone [Difco Laboratories] per liter, 8.5 g of NaCl per liter), and 10 μl was inoculated into 9 ml of TSYGB (30 g of tryptone soya broth per liter, 3 g of yeast extract per liter, 10 g of glucose per liter). The tubes were incubated for 48 h at 22°C (stationary phase).
Flow system.
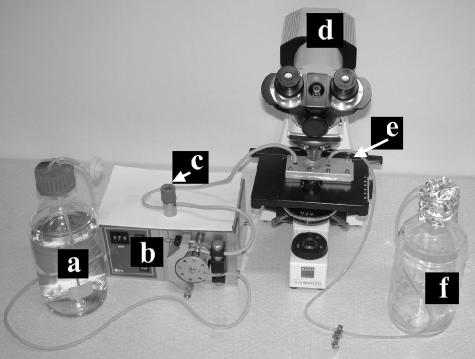
The flow system consisted of a feed flask (Schott, Mainz, Germany), autoclavable tubing, a peristaltic pump (P4; Belach Bioteknik, Stockholm, Sweden), a bubble trap manufactured in house, the flow chamber, and a waste flask. The setup is shown in Fig. 1.
FIG. 1.
Setup of the flow system. a, feed flask; b, peristaltic pump; c, bubble trap; d, microscope equipped with a charge-coupled device camera; e, flow chamber; f, waste flask.
Flow chamber.
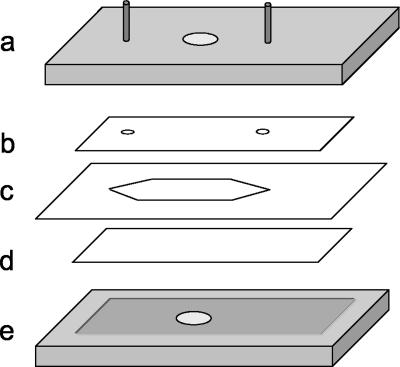
The flow chamber consisted of five main parts, as shown in Fig. 2. The device was tightly screwed together with eight steel screws. The cross section was 10 by 0.1 mm, and using a medium volumetric rate of 0.7 ml/min resulted in an average linear velocity of approximately 1.1 cm/s.
FIG. 2.
Flow chamber. (a) Top block of aluminum with inlet and outlet pipes (diameter, 1.2 mm) with two O rings; (b) polycarbonate slide with two holes (diameter, 1.2 mm); (c) polymer spacer; (d) microscope slide; (e) bottom block of aluminum.
Slide preparation.
The microscope slides used were either glass slides that were made hydrophobic or polystyrene slides.
(i) DDS coating.
An ordinary glass slide (Knittel Gläser, Braunschweig, Germany) was made hydrophobic by dip coating it in 2% dimethyldichlorosilane (DDS) dissolved in 1,1,1-trichloromethane (LKB, Bromma, Sweden). The coated slide was allowed to air dry in a laminar flow hood before it was inserted into a flow chamber.
(ii) Sterile polystyrene slides.
Sterile polystyrene cell culture slides (16004; Nalge Nunc International, Naperville, Ill.) were used as delivered.
Flow chamber and tubing preparation.
The tubing and flow chamber were autoclaved separately and assembled in a laminar flow cabinet. The setup was connected to the peristaltic pump, and the system was flushed (0.7 ml/min) with sterile phosphate-buffered saline (PBS) (0.2 g of KCl per liter, 0.2 g of KH2PO4 per liter, 1.15 g of Na2PO4 per liter, 8 g of NaCl per liter; pH 7.3).
Inoculum.
By using a 1-ml syringe and a 0.8-mm-diameter needle, 100 μl of culture was injected into the bubble trap through a rubber membrane. The culture was pumped into the flow chamber, and the bacteria were allowed to settle by switching off the pump. When there was sufficient adhesion (after 15 min), the pump was restarted, and all unattached bacteria were flushed away.
Effect of growth environment.
The effect of salt on the growth of E. coli was studied in three experiments with media (10 g of tryptone per liter, 5 g of yeast extract per liter) supplemented with 1, 2, and 4% NaCl.
Effect of sublethal heat shock on L. innocua.
The L. innocua culture was centrifuged at 3,100 × g at 22°C for 10 min, the supernatant was discarded, and the pellet was resuspended in 0.5 ml of TSYGB. Tubes containing TSYGB (10 ml) were preheated to 52°C in a water bath. A cell suspension (100 μl) was injected into each tube, and the tube was heated for a predetermined time (1, 2, or 5 min) and then place in ice water to cool rapidly. In order to concentrate the cells, the heated culture was transferred to a centrifuge tube and centrifuged at 3,100 × g at 22°C for 10 min. The supernatant was discarded, and the pellet was resuspended in 0.5 ml of TSYGB. The suspension (100 μl) was used to inoculate the flow chamber through the bubble trap.
Growth.
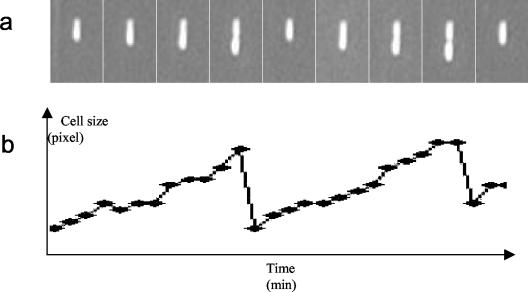
Growth was initiated when the feed flask was changed from PBS (no growth) to growth medium (Luria-Bertani medium containing glucose or TSYGB). The pump speed was set at 0.7 ml/min, which was sufficient to feed the bacteria and remove newborn daughter cells without removing significant numbers of attached mother cells (Fig. 3a). Assuming that there was laminar flow in the flow cell and plug flow in the rest of the system, we calculated that the PBS was washed out within 1 to 2 min.
FIG. 3.
Series of images obtained over time (a) and resultant graph (b). Taken at 5-min intervals, the images are close-up photos (magnification, ×500) of a single E. coli cell dividing during the exponential phase. More than 1,000 such images and graphs were generated in an experiment and used to create the distributions shown in Fig. 4.
Microscopy and image analysis.
The flow chamber was mounted on the stage of a dark-field microscope (Zeiss Standard 25; Zeiss, Oberkochen, Germany) equipped with either a ×4 objective (Leiz, Wetzlar, Germany) or a ×10 objective (Zeiss). A high-resolution (1040 by 1392 pixels) charge-coupled device camera (CoolSnap Pro cf; Roper Scientific, Trenton, N.J.) was mounted on the microscope, and the digital signal was transferred to a PCI interface card. An image analysis program (Image Pro Plus; Media Cybernetics, Silver Spring, Md.) controlled the camera to grab an image every 1 to 5 min depending on the required frequency. The program could semiautomatically improve the image quality by using built-in functions to remove background noise and enhance object edges. Image Pro Plus was able to automatically recognize clusters of brighter pixels as cells and to calculate the area of every cell and designate every cell with x and y coordinates. An in-house Visual Basic program transferred the size (in pixels) and the x and y coordinates to a spreadsheet, where the data were analyzed further. The images were grabbed at a low magnification (×200) by using dark-field illumination. The area of the computer image was 1,657 by 1,238 μm, as measured with an objective micrometer scale (Zeiss). This area was large enough to include as many as 1,500 to 3,000 bacteria. Although the low magnification resulted in very few pixels (20 to 30 pixels) per cell, the resolution was sufficient for our purposes since we were only interested in observing the division times of the cells. Note that, as Lawrence et al. (8) pointed out, it is impractical to try to estimate the size of a cell (in micrometers) based on dark-field images, since the size is inflated three- to sevenfold.
Data analysis.
From the Excel output of Image Pro Plus identification of individual cells was unreliable since the order of the cells could change between images. Therefore, to ensure the correct correspondence, another in-house program was written in which the geometric distance between the cells in consecutive images was utilized. The program, written in Visual Basic for Microsoft Excel, made it possible to relate the fate of any cell in the image to one row of the spreadsheet created. The resulting graphs (Fig. 3b) were evaluated by using another Visual Basic program that helped recognition of the division times.
All the Visual Basic programs described here are available upon request.
RESULTS AND DISCUSSION
General observations.
We had extensive problems with bubbles forming in the tubing and in the flow chamber itself. To overcome these difficulties, we added a bubble trap and decreased the downstream diameter of the tube with a clamp. The latter modification made it possible to maintain the pressure inside the flow chamber, which prevented bubble formation. Routine sterility measurements were taken to avoid contamination for several days. In order to minimize medium consumption, we decreased the thickness of the polymer spacer from 0.25 to 0.1 mm, and this had no effect on the laminar flow. The tightness of the chamber was significantly improved when we changed the polymer spacer from polyethylene film to Teflon. Commercial polystyrene slides proved to be the most reliable material of the materials tested (glass, DDS-coated glass, and polystyrene slides). So far, we have proven that the method works for the gram-positive bacterium L. innocua and the gram-negative bacterium E. coli. Preliminary tests with Bacillus cereus and Saccharomyces cerevisiae have shown that it can also be applied to other species. Polar attachment of the cells would have made the data analysis more complicated, but high-magnification studies showed that all bacteria were in a supine position due to the shear force of the flow.
Distribution of the doubling times of individual cells.
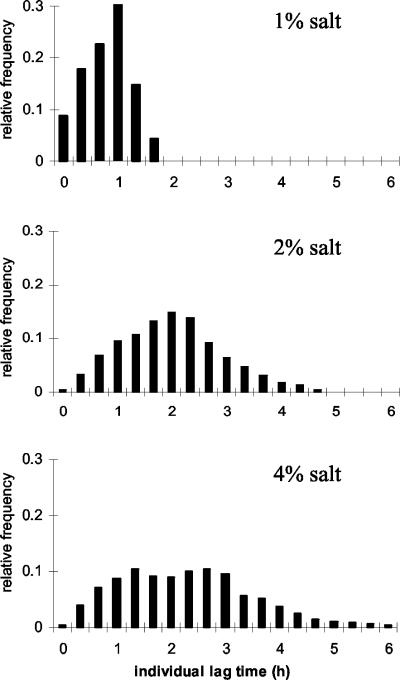
We acquired data for the doubling time of an individual cell, which was defined as the time that it took for the pixel size of a cell to double. Figure 4 shows how the salt concentration of the medium affected the distribution of individual doubling times for E. coli cells. Both the mean and the variance of the doubling time increased with higher salt concentrations.
FIG. 4.
Distributions of first doubling times of E. coli in different salt concentrations (1, 2, and 4% NaCl). Each culture was inoculated from the stationary phase and then grown at the ambient temperature in medium containing 10 g of tryptone per liter, 5 g of yeast extract per liter, 2 g of glucose per liter, and NaCl.
The pixel size is a two-dimensional projection of the cell volume, so it is not linearly proportional to the cell mass. However, this simply means that it is not possible to calculate the specific growth rate of the population from the growth rates of single cells, measured in pixels. The lack of linear proportionality does not affect the distribution of the individual division times, so it can be a suitable (stochastic) variable to study the effect of history and growth conditions on the distribution.
Effect of sublethal heat shock on L. innocua.
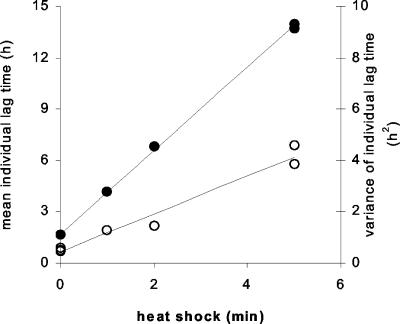
As expected, sublethal heat shocks were shown to cause an increase in the time to the first division of the individual cells (referred to as individual lag time below). However, by using our technique, we were able to show that not only the mean of the individual lag times but also the variance increased with the duration of the heat shock (Fig. 5). Furthermore, the data suggest that the relationship between the duration of the heat shock and both the mean individual lag time and its variance is close to linear.
FIG. 5.
Effect of sublethal heat shock on L. innocua. Both the mean (•) and the variance (○) of the individual lag times increased with the duration of the heat shock.
Conclusions.
The method described here can provide quantitative data suitable for statistical analysis of bacterial growth. The use of low magnification increases the area in each field of view, thereby providing a large number of observations in the same experiment. The flow of the medium not only feeds the cells but also removes newborn daughter cells. This allows the study of slowly growing cells which would otherwise be outgrown by cells that are growing faster. It is also possible to study the generation times of single cells. Métris et al. (10a) described the first model for the growth and division of single cells that takes into account the distribution of generation times, and with our method, we were able to support that model.
Measurement of the distribution times of single cells has recently become a crucial question in the field of predictive microbiology (13). However, so far, only simulation studies have been performed (10) or observations of a maximum 100 to 200 cells have been reported (5). Our method makes it possible to observe the distribution times of more than 1,000 cells and can decrease the error of parameter estimation of mathematical models significantly. This could contribute to more accurate understanding, modeling, and predicting of the bacterial responses to environmental changes.
Acknowledgments
This paper was prepared with funding from the EU Programme Quality of Life and Management of Living Resources (project QLK1-CT-2001-01145) (BACANOVA).
We thank Susie George for checking the manuscript and Lars Pettersson for manufacturing the flow chamber.
REFERENCES
- 1.Baranyi, J. 2002. Stochastic modelling of bacterial lag phase. Int. J. Food Microbiol. 73:203-206. [DOI] [PubMed] [Google Scholar]
- 2.Baranyi, J., and C. Pin. 2001. A parallel study on modelling bacterial growth and survival curves. J. Theor. Biol. 210:327-336. [DOI] [PubMed] [Google Scholar]
- 3.Berg, H. C., and S. M. Block. 1984. A miniature flow cell designed for rapid exchange of media under high-power microscope objectives. J. Gen. Microbiol. 130:2915-2920. [DOI] [PubMed] [Google Scholar]
- 4.Caldwell, D. E., and J. R. Lawrence. 1986. Growth kinetics of Pseudomonas fluorescens microcolonies within the hydrodynamic boundary layers of surface microenvironments. Microb. Ecol. 12:299-312. [DOI] [PubMed] [Google Scholar]
- 5.Francois, K., F. Devlieghere, A. R. Standaert, A. H. Geeraerd, J. F. M. Van Impe, and J. Debevere. 2003. Modelling the individual cell lag phase: effect of temperature and pH on the individual cell lag distribution of Listeria monocytogenes, p. 200-202. In J. F. M. Van Impe, A. H. Geeraerd, I. Leguérinel, and P. Mafart (ed.), Predictive modelling in foods—conference proceedings. KUL/BioTec, Leuven, Belgium.
- 6.Kelly, G. D., and D. Rahn. 1932. The growth rate of individual bacterial cells. J. Bacteriol. 23:147-153. [DOI] [PMC free article] [PubMed]
- 7.Kjelleberg, S., B. A. Humphrey, and K. C. Marshall. 1982. Effect of interfaces on small, starved marine bacteria. Appl. Environ. Microbiol. 43:1166-1172. [DOI] [PMC free article] [PubMed] [Google Scholar]
- 8.Lawrence, J. R., D. R. Korber, and D. E. Caldwell. 1989. Computer-enhanced darkfield microscopy for the quantitative analysis of bacterial growth and behaviour on surfaces. J. Microbiol. Methods 10:123-128. [Google Scholar]
- 9.McKellar, R. C., and K. Knight. 2000. A combined discrete-continuous model describing the lag phase of Listeria monocytogenes. Int. J. Food Microbiol. 54:171-180. [DOI] [PubMed] [Google Scholar]
- 10.McKellar, R. C., and X. Lu. 2003. Development of a global stochastic model describing the relationship between the distribution of individual cell physiological states and population physiological state, p. 20-22. In J. F. M. Van Impe, A. H. Geeraerd, I. Leguérinel, and P. Mafart (ed.), Predictive modelling in foods—conference proceedings. KUL/BioTec, Leuven, Belgium.
- 10a.Métris, A., Y. LeMarc, A. Elfwing, A. Ballagi, and J. Baranyi. Modelling the variability of lag times and the first generation times of single cells of E. coli. Int. J. Food Microbiol., in press. [DOI] [PubMed]
- 11.Powell, E. O. 1956. An improved culture chamber for the study of living bacteria. J. R. Microbiol. Soc. 75:235-243. [DOI] [PubMed] [Google Scholar]
- 12.Steen, H. B., and E. Boye. 1980. Escherichia coli growth studied by dual-parameter flow cytophotometry. J. Bacteriol. 145:1091-1094. [DOI] [PMC free article] [PubMed] [Google Scholar]
- 13.Van Impe, J. F. M., A. H. Geeraerd, I. Leguérinel, and P. Mafart (ed.). 2003. Predictive modelling in foods—conference proceedings. KUL/BioTec, Leuven, Belgium.
- 14.Wakamoto, Y., I. Inoue, H. Morguchi, and K. Yasuda. 2001. Analysis of single-cell differences by use of an on-chip microculture system and optical trapping. Fresen. J. Anal. Chem. 371:276-281. [DOI] [PubMed] [Google Scholar]


