

Abstract
Much is known about the mechanisms by which attention is focused to facilitate perception, but little is known about what happens to attention after perception of the attended object is complete. One possibility is that the focus of attention passively fades. A second possibility is that attention is actively terminated after the completion of perception so that the brain can be prepared for the next target. The present study investigated this issue with event-related potentials in humans, focusing on the N2pc component (a neural measure of attentional deployment) and the Pd component (a neural measure of attentional suppression). We found that active suppression occurred both to prevent the allocation of attention to known distractors and to terminate attention after the perception of an attended object was complete. In addition, the neural measure of active suppression was correlated with a behavioral measure of trial-to-trial variations in the allocation of attention. Active suppression therefore appears to be a general-purpose mechanism that both prevents and terminates the allocation of attention.
Introduction
In the natural visual environment, multiple objects typically compete for access to processing resources (Desimone and Duncan, 1995). Many models of attention propose that the brain maintains a priority map in which visual stimuli in the world are represented by activity that is proportional to their attentional priority, and attention is deployed toward the peak of the map (Treisman and Sato, 1990; Wolfe, 1994; Itti and Koch, 2000; Bisley and Goldberg, 2003, 2010; Serences and Yantis, 2007). The deployment of attention results in higher fidelity coding by sensory neurons that encode features of attended information (Luck et al., 1997a; Kastner and Ungerleider, 2000; Reynolds and Desimone, 2003; Serences and Yantis, 2006).
Substantial evidence now indicates that an active suppression mechanism is used to minimize the priority of items that are salient but not task relevant (Sawaki and Luck, 2010). We have proposed that these distractors automatically generate an “attend-to-me” priority signal, but that the actual deployment of attention toward them can be avoided because the active suppression mechanism quashes the increased attentional priority at the location of the distractor. We call this the signal suppression hypothesis of controlled attention capture (Sawaki and Luck, 2010, 2011). This attentional suppression is an active process because it is modulated by task instructions (Hickey et al., 2009; Sawaki and Luck, 2010). In the present study, we test the hypothesis that this active suppression mechanism also plays an important role after attention is no longer needed at a selected location. That is, the same suppression mechanism that is used to prevent the orienting of attention to distractors may also be used to terminate attention after it has been focused on a relevant object.
The present study used ERPs to test this hypothesis, focusing on the N2pc and Pd components. The N2pc component is a well characterized index of the covert deployment of visual attention (Luck and Hillyard, 1994a,b; Luck, 2012), and it appears to be generated in intermediate and high levels of the ventral visual processing pathway, including area V4 and the lateral occipital complex (Hopf et al., 2000, 2004). In contrast, the Pd component appears to reflect suppression of potentially distracting nontarget items (Hickey et al., 2009; Sawaki and Luck, 2010, 2011). This active suppression has been demonstrated for distractors that are salient both on the basis of bottom-up information and on the basis of a match with information being held in visual working memory (Sawaki and Luck, 2010, 2011; Kiss et al., 2012). If the allocation of attention is terminated by an active suppression mechanism, then the N2pc component (reflecting the initial focusing of attention onto an object) should be followed by a Pd component (reflecting active suppression). The alternative possibility is that the attentional priority at a selected location passively fades to zero after perception is complete. In this case, the N2pc would simply return to zero, with no subsequent Pd.
Materials and Methods
We conducted three visual search experiments to elucidate the mechanisms by which the allocation of attention is terminated. Experiment 1 examined the N2pc-to-Pd (enhancement-to-suppression) sequence for targets. Experiment 2 examined these processes when attention was cued to a location before the onset of the stimuli, demonstrating that the onset of the suppression process is linked to the completion of perception (i.e., time locked to the target, not to the cue). Experiment 3 confirmed that these event-related potential (ERP) signals are related to behavioral measures of the allocation of attention.
Participants
The participants were neurologically normal volunteers between 18 and 30 years old who were paid for their participation. All participants had normal or corrected-to-normal vision. Informed consent was obtained at the beginning of the experiment. A unique set of volunteers participated in each experiment, with 12 in Experiment 1 (4 males and 8 females) and Experiment 2 (4 males and 8 females), and 16 in Experiment 3 (8 males and 8 females).
Stimuli and procedure
Experiment 1.
The goal of Experiment 1 was to provide a clear demonstration that the shift of attention to a lateral target, indexed by N2pc, is followed by suppression, indexed by Pd. This general pattern can be seen in the waveforms in many previous studies that focused on the N2pc component (Luck and Hillyard, 1994b; Brisson and Jolicoeur, 2007; Lien et al., 2008; Carlisle and Woodman, 2011), but the Pd was not formally analyzed in these studies. The task in Experiment 1 involved attending to a lateralized filled circle of a specific color and reporting the position of a notch on this circle (Fig. 1A, example stimuli). A central filled circle was also present in each array but was task irrelevant.
Figure 1.
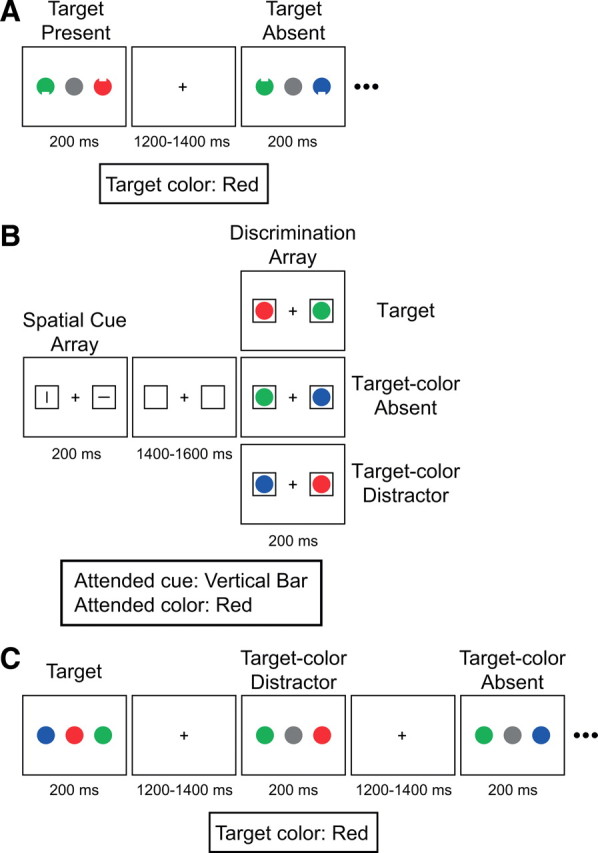
Example stimulus displays from the three experiments. A, Experiment 1. The target was a circle of a specific color (red in this example) that could appear at either of the two lateral locations, and participants were asked to report whether the target had a notch on its top or bottom. B, Experiment 2. Participants were asked to direct attention to the location indicated by the vertical (or horizontal) cue bar and make a button-press response to indicate whether the circle with the target color was present or absent at this location. In this example, the target color was red and the participant was instructed to attend to the location indicated by the vertical bar. C, Experiment 3. The target was a central circle with the target color (red in this example). The target-color distractor was a circle with target color at a lateral location. Participants were asked to report whether the central circle was the target color or not, ignoring the lateral circles.
The stimuli were presented on a video monitor with a black background at a distance of 70 cm. Each stimulus array consisted of three filled circles (1.6° in diameter), one at the center of the monitor and the others centered 2.5° to the left and right of center. The color of the central circle was gray on 70% of trials, red (u′ = 0.46, v′ = 0.50) on 10% of trials, green (u′ = 0.14, v′ = 0.55) on 10% of trials, and blue (u′ = 0.19, v′ = 0.24) on 10% of trials. All colors were matched for luminance (18 cd/m2). The color of each lateral circle was red, green, or blue with equal probability. The color of each circle was selected randomly with the designated probability on each trial, with the constraint that the two lateral circles were never the same color (although the central circle could be the same color as one of the lateral circles). Each lateral circle had a notch (0.3° tall × 0.6° wide) on the top or the bottom, and the location of the notch on each lateral circle varied randomly across trials. The stimulus array was presented for 200 ms, followed by a variable-duration blank interstimulus interval of 1200–1400 ms (rectangular distribution). During the interstimulus interval, the display consisted of a gray fixation cross (0.3° × 0.3°, 18 cd/m2) at the center of the display.
Each participant performed 60 practice trials, followed by 18 blocks of 60 trials during which ERPs were recorded. At the beginning of each block, one of the colors (red, green, or blue) was designated the target color. The red-target, green-target, and blue-target blocks occurred in random order. Participants were instructed to respond when they detected a circle with the target color at either of the lateral locations, pressing one of two buttons with the right hand on a game pad to indicate the location of the notch on this circle (index finger for top notch and middle finger for bottom notch). They were instructed to make no response when the target color was absent from the two lateral locations. Speed and accuracy were equally stressed. The target color could appear at the central location, but participants were instructed to ignore the central location and respond only to the target color at the lateral locations (the center item was present solely to match the stimuli with those used in Experiment 3).
Sixty-seven percent of trials contained a lateral target. To eliminate sensory confounds, only trials in which the central location had a gray circle were included for analyses of the target-present trials (504 trials, 47%). Participants were required to maintain central fixation throughout the trial, verified with electro-oculogram (EOG) recordings (see details below).
We predicted that an N2pc component would be elicited by the lateral target stimuli, reflecting the allocation of attention to the target, and that this would be followed by a Pd component, reflecting an active suppression process that terminates the allocation of attention to the lateral target. The alternative possibility was that the N2pc component would simply fade away, reflecting a passive decay of attention after the completion of target processing.
Experiment 2.
This experiment was designed to determine whether active suppression is used to terminate attention under conditions in which attention was already directed by means of an explicit spatial precue. A precue produces a shift of attention before target onset (Posner, 1980; Mangun and Hillyard, 1990), and we sought to determine whether active suppression occurs following presentation of a stimulus at the cued location, after attention is no longer needed at the cued location.
The stimuli and procedure in this experiment were identical to those used in Experiment 1, except as follows (Fig. 1B). The display contained two continuously visible gray outlined squares as placeholders (1.9° × 1.9°, 18 cd/m2, centered 3.0° to the left and right of fixation). Each trial consisted of a sequence of a spatial cue array and a discrimination array. Following a blank interstimulus interval (1400–1600 ms, rectangular distribution), the cue array was presented for 200 ms. Each cue array consisted of a vertical gray bar (0.6° tall × 0.03° wide, 18 cd/m2) and a horizontal gray bar (0.03° tall × 0.6° wide, 18 cd/m2), each centered inside one of the two placeholders. The location of each bar varied randomly across trials, but the array always contained one horizontal bar and one vertical bar. Half of the participants were instructed to direct attention to the location indicated by the vertical bar in the cue array, and the other half were instructed to direct attention to the location indicated by the horizontal bar, while maintaining fixation on the fixation point. This type of cuing procedure has the advantage of controlling for sensory differences between leftward and rightward cues.
After a delay (1400–1600 ms, rectangular distribution), a discrimination array was presented for 200 ms. Each discrimination array consisted of two filled circles (1.6° in diameter), each centered inside one of the two placeholders. The color of each circle was red, green, or blue, with equal probability, varying randomly across trials, with the constraint that no color repeated within a given discrimination array.
At the beginning of each block, one of the colors (red, green, or blue) was designated the target color. The red-target, green-target, and blue-target blocks occurred in random order. Participants were instructed to indicate whether a target-color circle was present (index finger response) or absent (middle finger response) at the cued location, regardless of what color was present at the uncued location. That is, the designated color was considered a target only if it appeared at the cued location.
This design led to three types of trials, each with equal probability (360 trials each): target trials (target color present at the cued location and not at the uncued location), target-color absent trials (target color absent from both locations), and target-color distractor trials (target color present at the uncued location but not at the cued location). Each participant performed 36 practice trials, followed by 30 blocks of 36 trials during which ERPs were recorded.
ERP responses for the discrimination array were examined. In the discrimination array, attention should already be focused on the target location when the discrimination array appears, so no additional N2pc activity should be observed following discrimination array onset; however, an enhanced P1 would be expected for stimuli in the cued location if attention was focused on that location before the onset of the discrimination array. Furthermore, if active suppression is used to terminate attention after the brain decides whether the target is present or absent, a Pd component should be observed following the discrimination array.
Experiment 3.
The goal of Experiment 3 was to demonstrate the functional significance of the Pd component as a measure of suppression by showing that Pd amplitude is correlated with a behavioral measure of suppression. To accomplish this, we used a task in which participants looked for a particular target color at fixation and tried to ignore lateral distractors that might match this color. Although the stimuli in this experiment were nearly identical to those in Experiment 1, the lateral target-colored items were distractors in Experiment 3. By placing the target at fixation, we could more easily isolate the Pd and N2pc activity elicited by the lateralized distractor stimuli and determine the relationship between these components and trial-by-trial variations in behaviorally measured attentional allocation.
In the attentional capture literature, it has been reported that task-irrelevant items can capture attention if they share target features (Folk et al., 1992, 1994; Bacon and Egeth, 1994; Folk and Remington, 1998; Leber and Egeth, 2006), leading to an N2pc (Eimer and Kiss, 2008; Kiss et al., 2008; Leblanc et al., 2008; Lien et al., 2008; Eimer et al., 2009). However, previous research shows that the capture of attention by salient distractors varies from trial to trial (Geng and Diquattro, 2010; Leber, 2010; Mazaheri et al., 2011), reflecting variability in top-down prefrontal control signals (Leber, 2010). We took advantage of these fluctuations to test the hypothesis that the Pd component is observed for trials on which attentional capture has been prevented, as measured behaviorally. Thus, we predicted that the distractor matching the target color in the present experiment would effectively capture attention on a subset of trials, leading to longer reaction times (RTs) and a large N2pc. On other trials, however, we predicted that the target-color distractor would be rapidly suppressed, leading to shorter RTs, little or no N2pc, and a large Pd. Therefore, an N2pc would be present on target-color distractor trials with long RTs (reflecting the capture of attention by the target-color distractor), whereas a strong Pd would be observed on target-color distractor trials with short RTs (reflecting the suppression of the target-color distractor).
The stimuli and procedure were identical to those used in Experiment 1, except as follows (Fig. 1C). The filled circles did not have a notch. Participants were instructed to respond on each trial to indicate whether the central circle was the target color (10%; index finger response) or not (90%; middle finger response). Thus, a target-absent response was required even when the target color was absent at the central location but present in one of the lateral locations (which we call a target-color distractor). The target color could be red, green, or blue (in different trial blocks), and it was never gray.
As in Experiment 1, each lateral color was equally likely to be red, green or blue, with the constraint that the two lateral colors could not be identical. Consequently, 67% of the trials contained a target-color distractor. The color of the central circle was gray on 70% of trials, red on 10% of trials, green on 10% of trials, and blue on 10% of trials. The appearance of the target color at a lateral location was independent of the appearance of this color at the central location (i.e., both central and lateral locations contained the target on 6.7% of trials, reflecting the 10% likelihood of the target color in the center and the 67% likelihood of this color at a lateral location). To eliminate sensory confounds, only trials in which the central location had a gray circle were included for the analyses of the target-color distractor trials (504 trials, 47%).
Recording and analysis
The electroencephalogram (EEG) was recorded using active Ag/AgCl electrodes (BioSemi ActiveTwo) from the left and right mastoids and 32 scalp sites (Fp1, Fp2, F7, F3, Fz, F4, F8, T7, C3, Cz, C4, T8, P9, P7, P5, P3, P1, Pz, P2, P4, P6, P8, P10, PO7, PO3, POz, PO4, PO8, O1, Oz, O2, and Iz, according to the modified 10–20 System) (American Electroencephalographic Society, 1994). To detect eye movements and blinks, the EOG was recorded from electrodes placed at the outer canthi of each eye, and above and below the right eye. All signals were recorded in single-ended mode. The EEG and EOG were lowpass filtered with a fifth-order sinc filter (half-power cutoff at 208 Hz) and digitized at 1024 Hz.
All data analyses were conducted using ERPLAB Toolbox (http://erpinfo.org/erplab/) and EEGLAB Toolbox (Delorme and Makeig, 2004; http://sccn.ucsd.edu/eeglab/), which are freely available, open source, MATLAB-based packages for EEG/ERP data analysis. The EEG signals were referenced off-line to the average of the left and right mastoids, and the four EOG signals were referenced into bipolar vertical and horizontal EOG derivations. These signals were bandpass filtered off-line using a noncausal Butterworth infinite impulse response filter with half-power cutoffs at 0.1 and 30 Hz and a roll-off of 12 dB/octave and then downsampled to 256 Hz. Averaged ERP waveforms were computed with a 500 ms epoch, beginning 100 ms before stimulus onset. The waveforms were collapsed across stimulus colors and locations to eliminate sensory confounds related to these factors.
Trials were automatically excluded if they contained an incorrect response, if the RT was shorter than 100 ms or longer than 1100 ms, if the EEG exceeded ±100 μV in any channel, if the vertical EOG exceeded ±80 μV, or if the horizontal EOG exceeded ±50 μV. To assess residual eye movements, we computed averaged horizontal EOG waveforms for left- and right-stimulus trials. In experiments with lateralized stimuli, we always replace any participants for whom the residual EOG activity is >3.2 μV (Woodman and Luck, 2003), which means that the residual eye movements in the remaining participants averaged less than ±0.1° with a propagated voltage of <0.1 μV at the posterior scalp sites (Lins et al., 1993). We also replace participants for whom >25% of trials are rejected because of EEG/EOG artifacts. Three participants were replaced for these reasons in Experiments 1 and 2, and two participants were replaced in Experiment 3. Among the final set of participants, artifacts led to the rejection of an average of 5.0% of trials (range 1.0–18.4%) in Experiment 1, 8.4% of trials (range 1.9–21.1%) in Experiment 2, and 8.7% of trials (range 2.0–19.3%) in Experiment 3.
The N2pc and Pd components were measured from difference waves, in which the waveform from the hemisphere ipsilateral to the stimulus of interest was subtracted from the waveform from the hemisphere contralateral to the stimulus (the contralateral waveform for the target was the average of the left-hemisphere electrode when the target was in the right visual field and the right-hemisphere electrode when the target was in the left visual field; the ipsilateral waveform for the target was the average of the left-hemisphere electrode when the target was in the left visual field and the right-hemisphere electrode when the target was in the right visual field). Because the overall energy of the stimuli was bilateral, this subtraction eliminates most ERP components, with N2pc and Pd remaining in the difference wave (Luck, 2012, their detailed justification of the use of the contralateral-minus-ipsilateral difference to measure N2pc and Pd magnitude). Both N2pc and Pd were measured at the PO7 and PO8 electrode sites, where they were largest in all three experiments.
A key challenge in measuring Pd amplitude is choosing the time window for measurement. Although dozens of previous studies have shown that the N2pc component is typically present between 150 and 300 ms poststimulus (Luck, 2012), the Pd component appears to vary over a broad range (∼100–400 ms) depending on the stimuli and task (Hickey et al., 2009, onsetting ∼200 ms; Sawaki and Luck, 2010, ∼120 ms; Sawaki and Luck, 2011, ∼220 ms). Given noise in the waveforms, some positive voltage would be expected between 100 and 400 ms even in the absence of a consistent Pd. If we were to choose a narrow Pd measurement window on the basis of the presence of a positive deflection in the observed waveforms, this deflection could easily be noise, and we would be biased to find a statistically significant effect even if there was no real effect. On the other hand, if we were to use a broad measurement window including the entire possible range of Pd latencies (e.g., 100–400 ms), we would be mixing noise with the Pd effect, which would reduce statistical power, and the Pd might be canceled by the opposite-polarity N2pc component if some N2pc activity were also present in this time range.
We therefore developed a novel approach, in which we measured the positive area of the difference wave over a relatively long interval (100–400 ms) as an estimate of Pd amplitude (Fig. 2). This made it possible to determine whether a statistically significant Pd (positive area) was present somewhere within this measurement window. However, because this area measure included only positive values, it was necessarily biased to have a nonzero value. To account for this bias, we used a nonparametric permutation approach that estimated the distribution of values that would be expected from noise alone (using the noise in the actual data). This approach is based on repeatedly permuting the original dataset to provide an estimate of the probability that the observed response is due to random variation in the data rather than a consistent physiological response (Ernst, 2004). This is becoming an increasingly popular approach in ERP and neuroimaging research (Maris and Oostenveld, 2007; Groppe et al., 2011; Maris, 2012).
Figure 2.
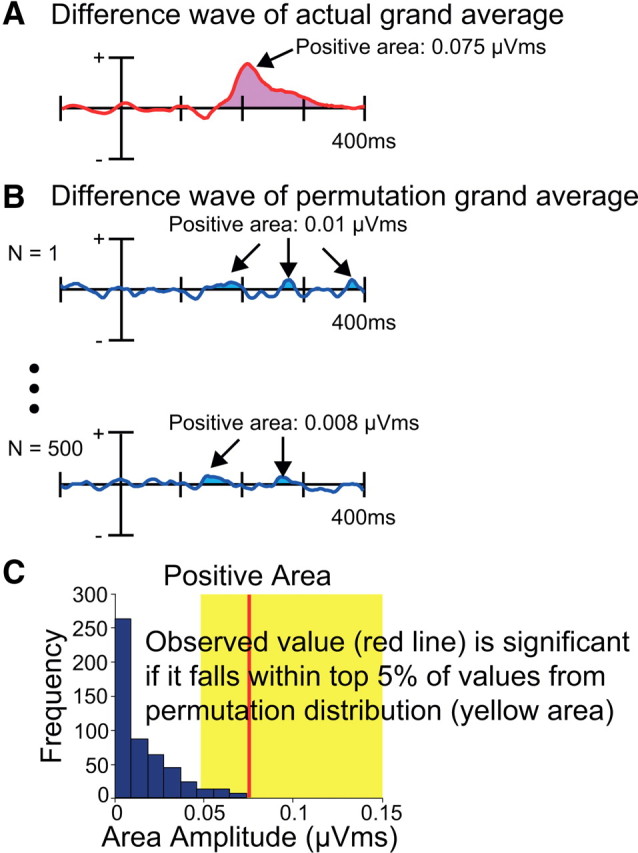
Illustration of permutation test. A, The positive area from the actual grand average. B, The positive area from the permutation grand average for each iteration, which should contain only noise. C, Estimated null distribution from 500 permutations of the data. If the positive area from the observed grand average (red line) falls within the top 5% of values from the null distribution (indicated by the yellow area), the observed positive area is considered to be significant.
For Experiment 1, the null hypothesis is that the observed positive area in the contralateral-minus-ipsilateral difference wave (Fig. 2A) is equivalent to the area that would be measured if the observed positive area solely reflected noise in the data. This is equivalent to the area that would be observed if the same brain activity (except random noise) was produced when the target was presented on the left side or on the right side. To determine the distribution of positive area values that would be expected if the null hypothesis were true, we simply randomly recoded the side of the target for each trial, re-averaged the data, and measured the positive area for the resulting difference waves between 100 and 400 ms (measuring from the grand average; Fig. 2B). We did this 500 times, with different randomizations of the coding, and obtained an area value for each iteration. The distribution of values over these 500 iterations is an empirically determined estimate of the null distribution. If the actual positive value is >95% of the values obtained with these randomized waveforms, then we can reject the null hypothesis (Fig. 2C). The same approach was used in Experiments 2 and 3, but randomly recoding the side of the target-color distractor rather than the side of the target, depending on the nature of the hypothesis being tested.
Results
Experiment 1: active suppression follows attentional enhancement at a target location
Overview
Experiment 1 used the N2pc and Pd components to investigate whether, after perception is complete, attention is actively terminated or passively fades away. As in many prior experiments, we anticipated that attention would initially be deployed toward the location of target, leading to an N2pc (Luck and Hillyard, 1994a,b; Eimer, 1996; Woodman and Luck, 1999, 2003; Hickey et al., 2006; Eimer and Kiss, 2008; Kiss et al., 2008; Leblanc et al., 2008; Lien et al., 2008; Woodman et al., 2009). If the allocation of attention is terminated by an active suppression mechanism, then the N2pc component in response to the target should be followed by a Pd component. In contrast, if attention passively fades away, then the N2pc should simply return to zero without being followed by a Pd.
Behavior
The behavioral results indicated that participants were able to discriminate the target rapidly and accurately. The mean RT for targets was 487 ms, and the mean target discrimination accuracy was 95.8%. The mean false positive rate on target-absent trials was 1.2%.
ERPs
Figure 3A shows the ERP waveforms from electrodes over the visual cortex contralateral and ipsilateral to the target (PO7 and PO8). Following the presentation of an array containing a target, the N2pc component was present as a negative deflection in the ERP waveform at contralateral relative to ipsilateral scalp sites, beginning at ∼150 ms poststimulus. The N2pc was followed by a positivity at contralateral relative to ipsilateral electrode sites (the Pd component), beginning at ∼280 ms poststimulus. Topographic maps of the N2pc and Pd components are plotted in Figure 3B. These scalp distributions are qualitatively similar to those observed in prior N2pc and Pd studies (Luck and Hillyard, 1994a,b; Hopf et al., 2000; Hickey et al., 2009; Sawaki and Luck, 2010), which is consistent with the notion that N2pc and Pd reflect related, but opposite, mechanisms.
Figure 3.

Electrophysiological results from Experiment 1. A, Grand average waveforms for targets at contralateral versus ipsilateral electrode sites (averaged over PO7 and PO8). B, Topographic maps for the target during the N2pc period (left; 180–230 ms) and the Pd period (right; 290–340 ms). Rather than plotting contralateral minus ipsilateral, which forces the values to be zero or undefined on the midline, these maps show the voltage for right-target trials minus left-target trials. C, Permutation tests of the negative and positive areas from 100 to 400 ms. The blue bars indicate the estimated null distribution from 500 permutations. The red lines represent the observed values of the negative and positive areas (N2pc and Pd) from the grand average waveforms. The yellow areas indicate the top 5% of the permutation distribution. Because the red lines fall within the yellow regions, the observed values are significantly greater than would be expected by chance.
To assess the statistical significance of these effects, we first measured the mean voltage from 180 to 230 ms (N2pc) and from 290 to 340 ms (Pd) relative to the mean voltage during the 100 ms prestimulus baseline period. All measurements were taken from contralateral-minus-ipsilateral difference waves. One-sample t tests revealed that both N2pc and Pd were significantly different from zero (N2pc: t(11) = −5.5, p < 0.001; Pd: t(11) = 2.5, p < 0.03).
Because we could not anticipate the precise boundary between the N2pc and Pd effects, these measurement intervals were selected on the basis of the effects observed in the waveforms, which inevitably biases the results. We therefore performed the permutation approach described above, in which the area of the negative region (N2pc) and the area of the positive region (Pd) over a broad window of 100–400 ms were compared against the distribution of areas that would be expected on the basis of chance. As illustrated in Figure 3C, the observed negative and positive areas (indicated by red lines) were both statistically significant (in the top 5% of values that would be expected from chance: indicated by yellow areas). Thus, the probability that the observed responses were due to random variation was very low, and we can be confident that these effects were real physiological responses.
These ERP results indicated that the deployment of attention to a target (indexed by N2pc) is subsequently suppressed (indexed by Pd) rather than simply fading away. Thus, the suppression mechanism indexed by Pd, which is used to prevent the initial deployment of attention toward salient distractors (Sawaki and Luck, 2010, 2011; Kiss et al., 2012), is also used to terminate the allocation of attention to a relevant object after attention is no longer needed.
One might suppose that the N2pc is inevitably followed immediately by a positive-going overshoot, perhaps reflecting ion equilibration, much as an action potential is followed by an opposite-polarity after-potential. However, there is already ample evidence that N2pc is not followed by a positive deflection in some situations, such as when the task requires attention to be maintained after the initial deployment of attention (Woodman et al., 2009). The next two experiments further demonstrate that Pd reflects an active mechanism that is directly related to the termination of attention even when it is delayed from the initial shift of attention, and also accounts for variability in behavior due to attentional capture or successful distractor suppression.
Experiment 2: linking active suppression with the completion of perception
Overview
Experiment 2 was designed to determine whether Pd is a passive process that always immediately follows a shift of attention or is instead an active process that occurs when attention is no longer needed at a given location. To distinguish between these possibilities, we used a spatial cuing paradigm in which attention was directed toward the cued location in advance of the onset of the discrimination array (as verified by an enhancement of the sensory response to the discrimination array at the cued location).
In this experiment, a to-be-attended location (left or right) was precued on each trial; the target was an object with a defined color at the cued location in the discrimination array (Fig. 1B). If this color appeared at the uncued location, it was to be treated as a nontarget; that is, the cue defined the target location rather than predicting the target location. We predicted that a target color presented at the cued location in the discrimination array would not elicit an N2pc, because attention was already focused on that location. Instead, we predicted that the target would elicit a Pd, reflecting the termination of attention after target detection processing was complete. In addition, we predicted that the Pd would be elicited even more rapidly when the target color was not present at the cued location, because perceptual processing would be completed even more rapidly on such trials. Note that, because the target location was precued with 100% validity in this experiment, it is extremely unlikely that a positivity contralateral to the target would be caused by an N2pc reflecting a shift of attention to the opposite location.
Behavior
Mean RT was 525 ms when the target color was present at the cued location (target trials), 497 ms when neither location contained the target color (target-color absent trials), and 548 ms when the target color was present at the uncued location (target-color distractor trials). Mean accuracy for these three trial types was 95.7, 98.3, and 96.7%, respectively. A one-way ANOVA on RT yielded a main effect of trial type (F(2,22) = 10.8, p < 0.001), and follow-up t tests indicated that RT was significantly longer for target-color distractor trials than for target-color absent trials (p < 0.001), indicating that the target-color distractor captured attention. The same ANOVA for accuracy also yielded a main affect of trial type (F(2,22) = 6.2, p < 0.02), and follow-up t tests indicated that the hit rate for target trials was significantly lower than that for target-color absent trials (p < 0.05). None of the other pairwise differences in RT or accuracy reached significance.
Effects of cuing on sensory-evoked P1 amplitude
Figure 4A shows the initial portion of the ERP waveforms elicited by the discrimination array, making it easy to see the P1 wave (note that the cue-elicited ERPs are described later). Note that the waveforms in Figure 4 have been baseline corrected using the period immediately before the discrimination array, eliminating any residual voltage offsets from the cue array (because of slow voltage drifts, it would be unrealistic to use the period before cue onset as the baseline period for these waveforms). Also, note that Figure 4 illustrates the ERPs at contralateral versus ipsilateral sites relative to the cued location, because our primary interest is in understanding how attention to the cued location is terminated; contralateral and ipsilateral are therefore reversed with respect to the location of the target-color distractor.
Figure 4.

Electrophysiological results from the discrimination array in Experiment 2. A, Grand average waveforms at contralateral versus ipsilateral electrode sites relative to the cued side (averaged over PO7 and PO8), shown with a short time scale to emphasize the early P1 component. B, The same data as in A, shown on a longer time scale to show the N2pc and Pd components. C, Grand average difference waveforms obtained by subtracting the ipsilateral waveforms from the contralateral waveforms (average of PO7 and PO8).
This is important to determine whether subjects actually shifted attention before the onset of the discrimination array, enhancing sensory processing for the information presented at the cued location. Previous studies have shown that the P1 wave is enhanced over contralateral visual cortex for stimuli at an attended location, regardless of whether the stimuli are targets or nontargets (Mangun and Hillyard, 1988; Heinze et al., 1990; Luck et al., 1990; Mangun, 1995), indicating enhanced sensory processing at the attended location (Luck et al., 1994; Hillyard et al., 1998). Consistent with these studies, we found that P1 amplitude was greater at contralateral sites than at ipsilateral sites, equivalently for all three trial types, demonstrating that attention had been shifted to the cued location before the onset of the discrimination array. P1 amplitude was quantified as the mean voltage between 90 and 120 ms, and the P1 attention effect was quantified as the difference between contralateral and ipsilateral electrode sites (relative to the cued location, measured at the same PO7 and PO8 electrode sites used for the N2pc and Pd analyses). A two-way ANOVA with factors of trial type (target, target-color absent, target-color distractor) and electrode laterality (contralateral, ipsilateral) yielded a significant main effect of laterality (F(1,11) = 25.2, p < 0.001). This demonstrates that the P1 sensory response was significantly greater contralateral to the cued side. There was neither a main effect of trial type nor an interaction with laterality, consistent with the observation that the magnitude of the P1 attention effect was equivalent for the three trial types. Follow-up t tests confirmed that the P1 lateralization effect was significant for all three trial types (target: p < 0.001; target-color absent: p < 0.01; target-color distractor: p < 0.025). These results confirmed that spatial attention was directed toward the cued location in advance of the onset of the discrimination array.
N2pc and Pd effects
The same data are shown in Figure 4B with a longer time scale to permit visualization of the N2pc and Pd components (note that the ERPs are from contralateral versus ipsilateral sites relative to the cued location). When no target-color item was present in the discrimination array (i.e., target-color absent trials), a positivity contralateral to the cued side (Pd) was visible beginning ∼150 ms after stimulus onset. When the target color was present at the cued location (i.e., target trials), a Pd was again observed, but it was later, broader, and lower in peak amplitude than the Pd for trials without a target-color item (Fig. 4C). This is consistent with the proposal that the Pd reflects the termination of attention, which can be done more rapidly (and perhaps with less latency variability) when the target color is absent than when the target is present, as indicated by the fact that RTs were shortest in the target-color absent trials. For both target and target-color absent trials, the presence of a Pd demonstrates that attention is actively reset even when initially allocated by a preceding cue array.
When a target-color item was present at the uncued location, a large contralateral-ipsilateral difference was observed from ∼150 to 250 ms. This difference can be viewed as either a more positive voltage contralateral to the cued location (Pd) or a more negative voltage contralateral to the location of the target-color distractor (N2pc). Indeed, this voltage may reflect both the termination of attention at the cued location and the capture of attention by the target-color distractor at the uncued location. Unfortunately, it is impossible to distinguish among these possibilities on the basis of the present data. Following this effect, a more negative voltage was observed contralateral to the cued location (i.e., a positive voltage contralateral to the location of the target-color distractor), and this may have been a Pd component reflecting the active suppression of attention at the location of the target-color distractor. This could indicate that the target-color distractor generated an attentional priority signal because it matched the attended color and had to be actively suppressed. This pattern of stimulus-driven attentional capture followed by active suppression would be consistent with the long RTs observed for these trials, which were the slowest of all conditions. However, given the difficulty of disentangling termination of attention at the cued location and attentional capture by the target-color distractor at the uncued location on these trials, it is impossible to draw strong conclusions from these trials, and our main conclusions are based on the results from the target trials and the target-color absent trials.
N2pc and Pd statistical analyses
The description of the waveforms provided in the preceding paragraphs was supported by two sets of statistical analyses. The first analyses used the conventional approach, in which mean amplitude was measured in the specific time windows in which the effects were observed. One-sample t tests versus zero indicated that the initial contralateral positivity (relative to the cued location) was present for target trials (time window: 240–290 ms, t(11) = −3.7, p < 0.004), for target-color absent trials (time window: 180–230 ms, t(11) = 5.6, p < 0.001), and for target-color distractor trials (time window: 170–220 ms, t(11) = 6.2, p < 0.001). In addition, the opposite-polarity effect (i.e., the contralateral negativity relative to the cued location) that followed this initial positivity relative to the cued location for target-color distractor trials was also significantly different from zero (time window: 280–330 ms, t(11) = 3.9, p < 0.002).
To avoid any biases associated with choosing time windows, the second set of analyses used permutation tests on the area of the negative and positive regions in the contralateral-minus-ipsilateral difference waves (relative to the cued location) over a broad window of 100–400 ms. As illustrated in Figures 5, the positive area was significant for all three trial types, consistent with the active termination of attention. The negative area that followed the positive area was significant only for the target-color distractor trials. Thus, the effects obtained with the conventional analyses were confirmed by the permutation analyses.
Figure 5.
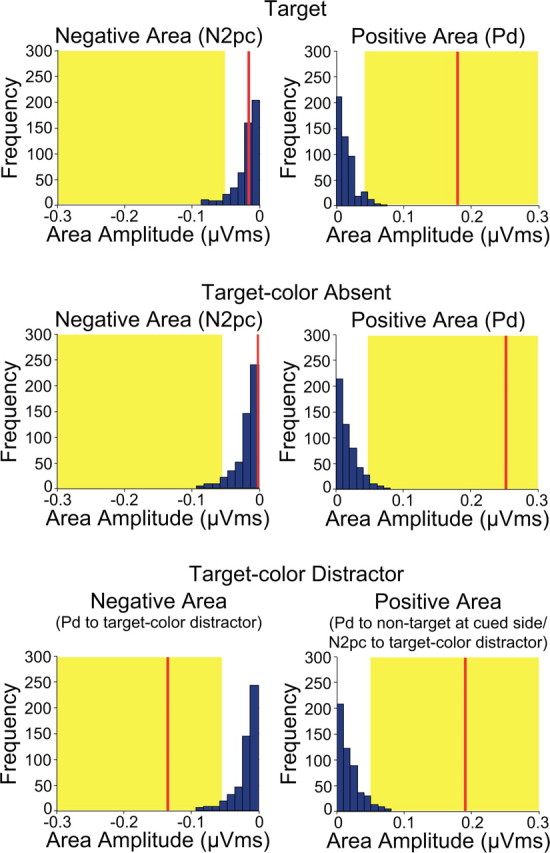
Permutation tests of negative and positive areas from the contralateral-minus-ipsilateral difference waves (relative to the cued side) for the discrimination array in Experiment 2. The blue bars indicate the estimated null distribution from 500 permutations. The red lines represent the observed values of the negative and positive areas (N2pc and Pd). The yellow areas indicate the top 5% of the permutation distribution.
Figure 4C shows contralateral-minus-ipsilateral difference waves, relative to the cued location, making it easier to see the time course of the contralateral positivity reflecting the termination of attention at the cued location. Although this positivity was observed for all three trial types, it was delayed on target trials. This is exactly what would be expected if the cue-elicited shift of attention could be terminated more rapidly when a nontarget color was detected at the cued location than when the target color was detected at this location. A jackknife-based procedure (Miller et al., 1998) was used to assess the statistical significance of this effect. Pd onset was defined as the latency at which the Pd (measured from the contralateral-minus-ipsilateral difference wave) reached 50% of the peak amplitude of the waveform (Kiesel et al., 2008). Measured in this way, Pd onset latency was delayed by ∼60 ms on target trials compared with the other trial types (mean onset latency: 231 ms for target trials, 176 ms for target-color absent trials, 170 ms for target-color distractor trials). The latency values were entered into in a one-way ANOVA, with the F-value corrected according to the formula provided by Ulrich and Miller (2001). This analysis indicated that the latency differences among the three trial types were significant (corrected F(2,22) = 13.7, p < 0.001), and post hoc comparisons indicated that Pd onset was significantly earlier for target-color absent trials and target-color distractor trials than for target trials (p < 0.02 and p < 0.01, respectively).
To summarize, the main finding of this experiment was that, when attention was already focused before the onset of the discrimination array (as verified by the P1 amplitude modulation), a Pd was triggered shortly after the onset of this array. This Pd began ∼150 after the onset of the discrimination array when the target color was not present at the cued location, indicating that attention was rapidly terminated as soon as the visual system could determine that there was no need to maintain attention on the cued location. The Pd was delayed by ∼60 ms when the target color was present at the cued location, presumably reflecting the continued processing of information at the cued location when the relevant color was perceived at this location. These results demonstrate that the Pd is not an automatic and immediate consequence of a shift of attention, but instead reflects a controlled process that is triggered when attention is no longer needed.
Cue-elicited ERPs
We examined the cue-elicited ERPs to verify that attention shifted in the cued direction before the onset of the discrimination array, as in previous research (Woodman et al., 2009). Figure 6 shows the cue-elicited ERP waveforms from electrodes over the visual cortex contralateral and ipsilateral to the to-be-attended side. Immediately following the presentation of the cue array, an N2pc was observed as a negative deflection, as verified by both a conventional analysis on mean amplitude (time window: 240–290 ms, t(11) = −2.7, p < 0.025; Figure 6A) and a permutation analysis on the negative area (time window: 100–400 ms; Figure 6B). Thus, attention was deployed toward the location of the relevant side of the cue array shortly after cue onset. This negative difference was not followed by a significant positive deflection in the usual Pd time window, as indicated by both a conventional analysis (time window: 340–390 ms, t(11) = 0.22) and a permutation analysis (time window: 100–400 ms; Figure 6B).
Figure 6.
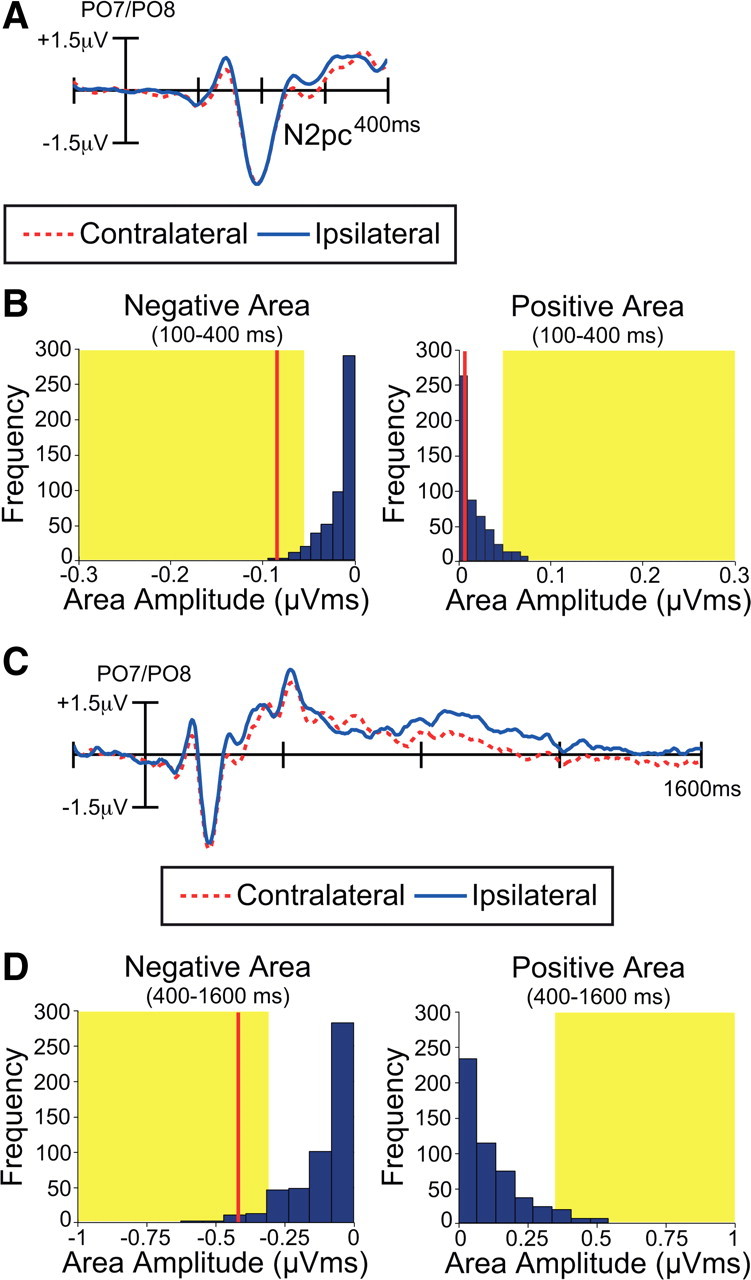
Electrophysiological results from the cue array in Experiment 2. A, Grand average cue-elicited waveforms at contralateral versus ipsilateral electrode sites (averaged over PO7 and PO8). B, Permutation tests of the negative and positive areas from 100 to 400 ms. The blue bars indicate the estimated null distribution from 500 permutations. The red lines represent the observed values of the negative and positive areas (N2pc and Pd) from the grand average waveforms. The yellow areas indicate the top 5% of the permutation distribution. C, The same data as in A, shown on a longer time scale and without a highpass filter to show the late sustained component. D, Permutation tests of the negative and positive areas from 400 to 1600 ms.
The same data are shown in Figure 6C with a longer time scale to permit visualization of the late, sustained lateralization effects between 400 and 1600 ms. To examine these slower later effects, the data were re-averaged with a longer prestimulus baseline (200 ms) and without a highpass filter. The voltage between 400 and 700 ms was not consistently positive or negative, and the largest positive deflection in this range did not approach significance in either a conventional analysis on mean amplitude (time window: 500–700 ms, t(11) = 0.87) or in a permutation analysis on positive area (time window: 400–1600 ms; Figure 6D). However, a consistent sustained contralateral negativity extended from 700 ms until the onset of the discrimination array (1600 ms after cue onset), and this effect was significant in a conventional analysis of mean amplitude (time window: 700–1600 ms, t(11) = −2.5, p < 0.035) and in a permutation analysis of negative area (time window: 400–1600 ms; Figure 6D). Thus, subjects reliably shifted attention to the cued location when the cue first appeared, and they reliably focused attention onto this location immediately before the onset of the discrimination array. However, there was no consistent pattern from ∼300 to 700 ms, presumably because there was no need to maintain attention on a particular location during the entire cue-target delay interval.
Experiment 3: Pd and N2pc responses correlate with behavioral performance
Overview
The preceding experiments demonstrated that the same suppression mechanism that is used to prevent the orienting of attention to distractors (indexed by Pd) is also used to terminate attention after the completion of perception. The final experiment was designed to provide more direct evidence that Pd actually reflects an active suppression by determining whether it is related to behavioral performance. Although prior research has shown that Pd appears under conditions that would be expected to involve suppression (Hickey et al., 2009; Sawaki and Luck, 2010, 2011; Kiss et al., 2012), Pd has never been directly linked to behavioral measures of suppression. Experiment 3 provided this link.
Experiment 3 used the same stimuli as Experiment 1, but the target was a circle containing a particular color at the central location, and one of the two lateral circles was sometimes a target-color distractor (Fig. 1C). When the central target was absent, the degree of attentional capture by the lateralized target should be reflected in the time to make a “target absent” decision. That is, if attention is captured by a distractor on a given trial, the amount of time required to determine that the target is absent should be longer on that trial. Previous research demonstrates that attentional capture fluctuates from trial to trial (Geng and Diquattro, 2010; Leber, 2010; Mazaheri et al., 2011). Therefore, a robust N2pc should be observed for the target-color distractor on trials with relatively long RTs. In contrast, if the participant is able to suppress attending to the target-color distractor on a given trial, the amount of time required to determine that the target is absent should be decreased on that trial. Therefore, the target-color distractor should elicit a Pd—or a brief N2pc followed by a Pd—on trials with relatively short RTs. In Experiment 2, it was difficult to interpret the target-color distractor condition because it appeared opposite to the cued location, but here the target was centrally located, precluding the presence of a task-related lateralized attention component. Thus, any lateralized ERPs in response to the target-colored item could be attributed to the stimulus itself, and not interactions with the item in the opposite location.
Behavior
Mean RT was significantly longer for target-present responses (438 ms) than for target-absent responses (333 ms), (t(15) = 13.1, p < 0.001). Mean hit rate was significantly lower for target-present trials (78.9%) than for target-absent trials (99.0%), (t(15) = −6.7, p < 0.001). These performance differences presumably reflect differences in the probability of target-present trials (10%) and target-absent trials (90%). The presence of a target-color distractor at a lateral location led to the capture of attention: mean RT for target-absent trials was significantly longer when a target-color distractor was present (331 ms) than when neither lateral circle contained the target color (322 ms), (t(12) = 5.3, p < 0.001). There was no significant difference in mean hit rate between these trial types (99.3 and 99.4%, respectively). The average effect of the target-color distractor on RT was small (9 ms), but this could reflect a mixture of trials on which attention was captured and trials on which attention was not captured.
N2pc and Pd on short-RT and long-RT trials
To examine relationships between behavioral performance and ERP responses, target-color distractor trials were sorted, for each participant, into the fastest 45% of trials (trials for which attention was least captured by the target-color distractor) and the slowest 45% of trials (trials for which attention was most captured by the target-color distractor). The middle 10% of trials were excluded (similar effects were found if we used a 50%/50% split). Mean RT was 272 ms on the short-RT trials and 393 ms on the long-RT trials. Averaged ERPs were then computed from the short-RT and long-RT trials. It should be noted that there are many sources of RT variability other than attentional capture, so some trials with capture presumably fell into the short-RT averages and some trials without capture presumably fell into the long-RT averages. Consequently, the differences between the long-RT and short-RT waveforms likely underestimate the true differences between trials with and without capture.
Figure 7A shows the ERP waveforms from lateral occipital scalp sites (PO7 and PO8) for the short-RT trials and the long-RT trials. On trials with short RTs, the contralateral-ipsilateral difference was dominated by a Pd component, beginning at ∼210 ms poststimulus. In contrast, the contralateral-ipsilateral difference for trials with long RTs was dominated by an N2pc component, beginning at ∼150 ms poststimulus, followed by a small Pd from ∼250 to 325 ms.
Figure 7.
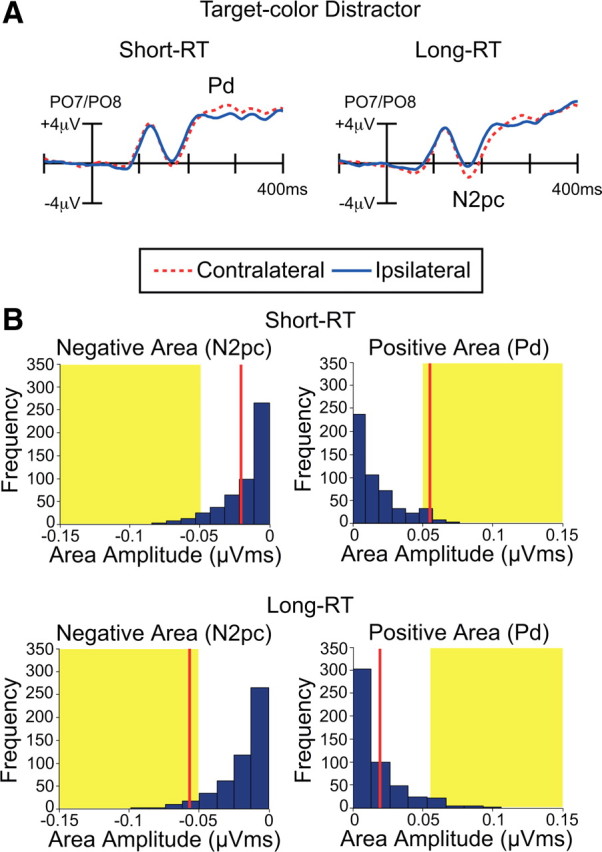
Electrophysiological results from Experiment 3. A, Grand average waveforms for the target-color distractor at contralateral versus ipsilateral electrode sites (averaged over PO7 and PO8). The ERPs were averaged separately for trials with fast RTs (left; presumably reflecting suppression of the salient distractor) and trials with slow RTs (right; presumably reflecting capture of attention by the salient distractor). B, Permutation tests of negative and positive areas for the target-color distractor in the short-RT trials (top) and the long-RT trials (bottom). The blue bars indicate the estimated null distribution from 500 permutations. The red lines represent the observed values of the negative and positive areas (N2pc and Pd). The yellow areas indicate the top 5% of the permutation distribution.
We first performed statistical analyses using the conventional approach in which mean amplitudes were measured over specific latency windows. On short-RT trials, the N2pc component was not significant (time window: 185–235 ms, t(15) = −1.9), but the Pd component was significant (time window: 250–300 ms, t(15) = 3.2, p < 0.01). On long-RT trials, both the N2pc and Pd components were significant (N2pc time window: 185–235, t(15) = −6.3, p < 0.001; Pd time-window: 185–235, t(15) = 2.2, p < 0.05).
We also used the permutation approach with positive and negative area measures (100–400 ms, as in Experiments 1 and 2). As illustrated in Figure 7B, the Pd (positive area) was statistically significant for short-RT trials but did not reach significance for the long-RT trials (falling at approximately the 30th percentile of the null distribution). Conversely, the N2pc (negative area) was significant for the long-RT trials but not for the short-RT trials (falling at approximately the 30th percentile of the null distribution). Thus, N2pc was significant on long-RT trials but not on short-RT trials, consistent with our assumption that attention was captured with greater strength or likelihood on trials with long RTs than on trials with short RTs. Moreover, Pd was significant on short-RT trials but not on long-RT trials, consistent with the hypothesis that the Pd component is associated with the prevention of distraction by salient distractors. This association between the ERP effects and behavioral performance provides converging evidence that the Pd component reflects a neural process of active suppression of attention, which works in opposition to the attentional deployment reflected by the N2pc component.
It is also important to note that the N2pc on long-RT trials was followed by a small Pd beginning at ∼250 ms. If this is not merely noise, it suggests that the capture of attention by a distractor is followed by a suppressive process that terminates the allocation of attention. The fact that this effect was significant in the conventional analyses but not in the permutation test may reflect trial-by-trial or participant-by-participant variability in the amount of time required to terminate the shift of attention (which is quite plausible given evidence that the duration of attentional capture varies substantially among healthy young adults; Fukuda and Vogel, 2009, 2011). In fact, the upper end of the distribution of RTs contained a long tail (Fig. 8), consistent with the possibility that large timing differences across trials partially obscured the Pd. In addition, a weak and nonsignificant N2pc deflection preceded the Pd on short-RT trials. This may reflect a mixture of some trials with capture (N2pc) and others with suppression (Pd) during the early part of the measurement window, which would largely cancel each other. Nevertheless, the present results clearly indicate that the relative amplitudes of the N2pc and Pd components are strongly related to attention capture as measured in behavioral RT.
Figure 8.

Frequency distribution of RT for the target-color distractor trials, aggregated across all participants in Experiment 3. The red lines represent the boundaries of the short-RT trials (left) and the long-RT trials (right).
Direct comparison of short-RT and long-RT trials
To provide direct statistical evidence that the sizes of the N2pc and Pd components varied across short-RT and long-RT trials, the areas of the negative and positive regions between 100 and 400 ms were measured from each individual participant and entered into a two-way ANOVA with factors of RT category (short-RT trials vs long-RT trials) and polarity (Pd vs N2pc). This ANOVA yielded a significant interaction (F(1,15) = 15.0, p < 0.002), indicating that N2pc and Pd varied in different ways across short-RT and long-RT trials. This interaction was decomposed with planned comparisons, which revealed that the mean positive area (Pd) was significantly larger on short-RT trials than on long-RT trials (p < 0.035), whereas the mean negative area (N2pc) was significantly larger on long-RT trials than on short-RT trials (p < 0.001). Note that a permutation analysis was not needed here because this analysis compared relative area values across conditions and there was no reason to expect differential measurement biases across these conditions.
Discussion
The present results provide evidence that attention toward an object containing task-relevant features is actively terminated after the completion of perception, accompanied by the same neural index of suppression (Pd) that is observed when a salient distractor must be suppressed. This neural index of active suppression is also observed under conditions in which attention is deployed in response to an explicit spatial precue. Furthermore, the neural index of active suppression is correlated with trial-to-trial variations in a behavioral measure of attentional suppression and capture.
It has been proposed that covert attention is allocated to the location that currently has the highest attentional priority, which is represented as a peak in a priority map that combines top-down and bottom-up inputs (Itti and Koch, 2000; Bisley and Goldberg, 2003; Fecteau and Munoz, 2006; Serences and Yantis, 2006; Mirpour et al., 2009). When observers are searching for specific target items, the presence of target features at a given location will create a peak at that location in the priority map, which will then lead to the allocation of attention to that location and a concomitant improvement in the perception of the object at that location. This covert deployment of visual attention is reflected by the N2pc component (Luck, 2012) and analogous changes in monkey single-unit activity and measures of blood flow (Chelazzi et al., 1993, 1998, 2001; Hopf et al., 2006). Although much is known about how attention is allocated to a high-priority location, little is known about the mechanisms that disengage attention from the peak of the priority map after the completion of perception. Our findings suggests that, after attention has facilitated perception at a location, the same active suppression mechanism used for preventing the allocation of attention to distractors plays a role in terminating attention and deprioritizes at the location.
Previous studies have shown that shifts of attention to a location may be followed by inhibition of return (IOR) to that location (Klein 1988, 2000; Posner and Cohen, 1984). IOR is defined as a slowing of RTs for targets appearing at a previously attended location, and it is typically observed beginning ∼300 ms after a transient shift of attention. Whereas IOR is typically observed only after exogenously driven shifts of attention (Müller and Findlay, 1988), the present study investigated the termination of endogenous shifts of attention. Additional research is needed to determine whether the Pd effects reflect the same neural mechanism that underlies IOR.
In Experiment 1, the N2pc in response to the target was followed by a Pd. There are two caveats that arise when N2pc and Pd might be present in the same ERP waveforms. First, these components have similar scalp distributions but are opposite in polarity, so they cancel when they occur at the same time. This means that the contralateral-minus-ipsilateral difference wave reflects the balance of enhancement and suppression at each moment in time rather than the absolute amount of enhancement or suppression. For example, the finding that the difference between contralateral and ipsilateral exhibits a transition from negative to positive at 280 ms (Fig. 3A) does not mean that the Pd component began at 280 ms. Instead, it means that the balance changed in favor of Pd at that moment. A second caveat is that shifting attention toward the nontarget object in the other hemifield would produce the same pattern of voltage as a suppression of the target object (i.e., a negative voltage contralateral to the nontarget object, which is the same thing as a positive voltage contralateral to the target object). However, given that there was always a single target on every trial in Experiment 1, there is no reason why participants would systematically shift their attention to the nontarget location after attending the target. More direct evidence that this potential reflects suppression rather than a shift of attention to the opposite side was provided in Experiments 2 and 3.
It is difficult to be absolutely certain that the Pd effect observed following the N2pc in Experiment 1 reflects the same Pd effect observed for items at cued location in Experiment 2 and target-color distractors in Experiment 3 (and for other types of salient distractors in previous studies; Hickey et al., 2009; Kiss et al., 2012; Sawaki and Luck, 2010, 2011). However, given that only a small fraction of neural processes will lead to a recordable scalp ERP effect, the identical polarity and similar scalp distributions of these effects make it quite likely that they reflect the same underlying neural processes (Kappenman and Luck, 2012).
The neural source of the Pd component cannot be determined from the present data owing to the challenges involved in localizing ERPs solely on the basis of scalp distribution (Luck, 2005, Chapter 7). However, substantial evidence from previous studies indicates that the N2pc component is generated in area V4 and the lateral occipital complex (Hopf et al., 2004, 2006), and it closely parallels single-unit attention effects observed in homologous areas of the macaque brain (Luck et al., 1997b). Given the similarity of the N2pc and Pd scalp distributions, their opposite polarities, and their complementary roles in spatial attention, it is plausible that N2pc and Pd reflect opposing processes within the same neural sources. That is, substantial evidence indicates that N2pc represents a process that enhances the neural representations of attended objects within ventral stream visual areas, and Pd may reflect suppression of processing within these same areas.
Selective attention also involves parietal and frontal areas (Kastner and Ungerleider, 2000; Corbetta and Shulman, 2002; Yantis and Serences, 2003; Corbetta et al., 2008; Noudoost et al., 2010; DiQuattro and Geng, 2011), but attention effects in these areas may not be sufficiently lateralized to contribute to the scalp-recorded N2pc and Pd voltages (although there is some evidence of a small parietal contribution to the magnetic homolog of N2pc; Hopf et al., 2000). The priority map appears to be located, at least in part, in the intraparietal sulcus in humans and in the lateral intraparietal cortex (LIP) in monkeys (Bisley and Goldberg, 2003; Serences and Yantis, 2006; Bisley, 2011). Previous single-unit recording studies in the macaque brain have found evidence of a reduction in neural activity in LIP correlating with attentional suppression at a target location that had been previously fixated during visual search (Mirpour et al., 2009; Falkner et al., 2010), suggesting that attentional suppression involves modulations of priority levels. If future research confirms that the Pd component is generated in the ventral stream rather than in parietal cortex, this will suggest that suppression also modulates stimulus representations within the object recognition pathway.
Footnotes
This study was made possible by Grant R01MH076226 to S.J.L. from the National Institute of Mental Health and by a postdoctoral fellowship to R.S. from the Japan Society for the Promotion of Science. We gratefully acknowledge the assistance of Johanna Kreither in data collection.
References
- American Electroencephalographic Society. Guideline thirteen: guidelines for standard electrode position nomenclature. J Clin Neurophysiol. 1994;11:111–113. [PubMed] [Google Scholar]
- Bacon WF, Egeth HE. Overriding stimulus-driven attentional capture. Percept Psychophys. 1994;55:485–496. doi: 10.3758/bf03205306. [DOI] [PubMed] [Google Scholar]
- Bisley JW. The neural basis of visual attention. J Physiol. 2011;589:49–57. doi: 10.1113/jphysiol.2010.192666. [DOI] [PMC free article] [PubMed] [Google Scholar]
- Bisley JW, Goldberg ME. Neuronal activity in the lateral intraparietal area and spatial attention. Science. 2003;299:81–86. doi: 10.1126/science.1077395. [DOI] [PubMed] [Google Scholar]
- Bisley JW, Goldberg ME. Attention, intention, and priority in the parietal lobe. Annu Rev Neurosci. 2010;33:1–21. doi: 10.1146/annurev-neuro-060909-152823. [DOI] [PMC free article] [PubMed] [Google Scholar]
- Brisson B, Jolicoeur P. Electrophysiological evidence of central interference in the control of visuospatial attention. Psychon Bull Rev. 2007;14:126–132. doi: 10.3758/bf03194039. [DOI] [PubMed] [Google Scholar]
- Carlisle NB, Woodman GF. When memory is not enough: electrophysiological evidence for goal-dependent use of working memory representations in guiding visual attention. J Cogn Neurosci. 2011;23:2650–2664. doi: 10.1162/jocn.2011.21602. [DOI] [PMC free article] [PubMed] [Google Scholar]
- Chelazzi L, Miller EK, Duncan J, Desimone R. A neural basis for visual search in inferior temporal cortex. Nature. 1993;363:345–347. doi: 10.1038/363345a0. [DOI] [PubMed] [Google Scholar]
- Chelazzi L, Duncan J, Miller EK, Desimone R. Responses of neurons in inferior temporal cortex during memory-guided visual search. J Neurophysiol. 1998;80:2918–2940. doi: 10.1152/jn.1998.80.6.2918. [DOI] [PubMed] [Google Scholar]
- Chelazzi L, Miller EK, Duncan J, Desimone R. Responses of neurons in macaque area V4 during memory-guided visual search. Cereb Cortex. 2001;11:761–772. doi: 10.1093/cercor/11.8.761. [DOI] [PubMed] [Google Scholar]
- Corbetta M, Shulman GL. Control of goal-directed and stimulus-driven attention in the brain. Nat. Rev. Neurosci. 2002;3:201–215. doi: 10.1038/nrn755. [DOI] [PubMed] [Google Scholar]
- Corbetta M, Patel G, Shulman GL. The reorienting system of the human brain: from environment to theory of mind. Neuron. 2008;58:306–324. doi: 10.1016/j.neuron.2008.04.017. [DOI] [PMC free article] [PubMed] [Google Scholar]
- Delorme A, Makeig S. EEGLAB: an open source toolbox for analysis of single-trial EEG dynamics including independent component analysis. J Neurosci Methods. 2004;134:9–21. doi: 10.1016/j.jneumeth.2003.10.009. [DOI] [PubMed] [Google Scholar]
- Desimone R, Duncan J. Neural mechanisms of selective visual attention. Annu Rev Neurosci. 1995;18:193–222. doi: 10.1146/annurev.ne.18.030195.001205. [DOI] [PubMed] [Google Scholar]
- DiQuattro NE, Geng JJ. Contextual knowledge configures attentional control networks. J Neurosci. 2011;31:18026–18035. doi: 10.1523/JNEUROSCI.4040-11.2011. [DOI] [PMC free article] [PubMed] [Google Scholar]
- Eimer M. The N2pc component as an indicator of attentional selectivity. Electroencephalogr Clin Neurophysiol. 1996;99:225–234. doi: 10.1016/0013-4694(96)95711-9. [DOI] [PubMed] [Google Scholar]
- Eimer M, Kiss M. Involuntary attentional capture is determined by task set: evidence from event-related brain potentials. J Cogn Neurosci. 2008;20:1423–1433. doi: 10.1162/jocn.2008.20099. [DOI] [PMC free article] [PubMed] [Google Scholar]
- Eimer M, Kiss M, Press C, Sauter D. The roles of feature-specific task set and bottom-up salience in attentional capture: an ERP study. J Exp Psychol Hum Percept Perform. 2009;35:1316–1328. doi: 10.1037/a0015872. [DOI] [PMC free article] [PubMed] [Google Scholar]
- Ernst MD. Permutation methods: a basis for exact inference. Stat Sci. 2004;19:676–685. [Google Scholar]
- Falkner AL, Krishna BS, Goldberg ME. Surround suppression sharpens the priority map in the lateral intraparietal area. J Neurosci. 2010;30:12787–12797. doi: 10.1523/JNEUROSCI.2327-10.2010. [DOI] [PMC free article] [PubMed] [Google Scholar]
- Fecteau JH, Munoz DP. Salience, relevance, and firing: a priority map for target selection. Trends Cogn. Sci. 2006;10:382–390. doi: 10.1016/j.tics.2006.06.011. [DOI] [PubMed] [Google Scholar]
- Folk CL, Remington R. Selectivity in distraction by irrelevant featural singletons: evidence for two forms of attentional capture. J Exp Psychol Hum Percept Perform. 1998;24:847–858. doi: 10.1037//0096-1523.24.3.847. [DOI] [PubMed] [Google Scholar]
- Folk CL, Remington RW, Johnston JC. Involuntary covert orienting is contingent on attentional control settings. J Exp Psychol Hum Percept Perform. 1992;18:1030–1044. [PubMed] [Google Scholar]
- Folk CL, Remington RW, Wright JH. The structure of attentional control: contingent attentional capture by apparent motion, abrupt onset, and color. J Exp Psychol Hum Percept Perform. 1994;20:317–329. doi: 10.1037//0096-1523.20.2.317. [DOI] [PubMed] [Google Scholar]
- Fukuda K, Vogel EK. Human variation in overriding attentional capture. J Neurosci. 2009;29:8726–8733. doi: 10.1523/JNEUROSCI.2145-09.2009. [DOI] [PMC free article] [PubMed] [Google Scholar]
- Fukuda K, Vogel EK. Individual differences in recovery time from attentional capture. Psychol Sci. 2011;22:361–368. doi: 10.1177/0956797611398493. [DOI] [PMC free article] [PubMed] [Google Scholar]
- Geng JJ, Diquattro NE. Attentional capture by a perceptually salient non-target facilitates target processing through inhibition and rapid rejection. J Vis. 2010;10:5. doi: 10.1167/10.6.5. [DOI] [PubMed] [Google Scholar]
- Groppe DM, Urbach TP, Kutas M. Mass univariate analysis of event-related brain potentials/fields I: a critical tutorial review. Psychophysiology. 2011;48:1711–1725. doi: 10.1111/j.1469-8986.2011.01273.x. [DOI] [PMC free article] [PubMed] [Google Scholar]
- Heinze HJ, Luck SJ, Mangun GR, Hillyard SA. Visual event-related potentials index focused attention within bilateral stimulus arrays. I. Evidence for early selection. Electroencephalogr Clin Neurophysiol. 1990;75:511–527. doi: 10.1016/0013-4694(90)90138-a. [DOI] [PubMed] [Google Scholar]
- Hickey C, McDonald JJ, Theeuwes J. Electrophysiological evidence of the capture of visual attention. J Cogn Neurosci. 2006;18:604–613. doi: 10.1162/jocn.2006.18.4.604. [DOI] [PubMed] [Google Scholar]
- Hickey C, Di Lollo V, McDonald JJ. Electrophysiological indices of target and distractor processing in visual search. J Cogn Neurosci. 2009;21:760–775. doi: 10.1162/jocn.2009.21039. [DOI] [PubMed] [Google Scholar]
- Hillyard SA, Vogel EK, Luck SJ. Sensory gain control (amplification) as a mechanism of selective attention: electrophysiological and neuroimaging evidence. Philos Trans R Soc Lond B Biol Sci. 1998;353:1257–1270. doi: 10.1098/rstb.1998.0281. [DOI] [PMC free article] [PubMed] [Google Scholar]
- Hopf JM, Luck SJ, Girelli M, Hagner T, Mangun GR, Scheich H, Heinze HJ. Neural sources of focused attention in visual search. Cereb Cortex. 2000;10:1233–1241. doi: 10.1093/cercor/10.12.1233. [DOI] [PubMed] [Google Scholar]
- Hopf JM, Boelmans K, Schoenfeld MA, Luck SJ, Heinze HJ. Attention to features precedes attention to locations in visual search: evidence from electromagnetic brain responses in humans. J Neurosci. 2004;24:1822–1832. doi: 10.1523/JNEUROSCI.3564-03.2004. [DOI] [PMC free article] [PubMed] [Google Scholar]
- Hopf JM, Luck SJ, Boelmans K, Schoenfeld MA, Boehler CN, Rieger J, Heinze HJ. The neural site of attention matches the spatial scale of perception. J Neurosci. 2006;26:3532–3540. doi: 10.1523/JNEUROSCI.4510-05.2006. [DOI] [PMC free article] [PubMed] [Google Scholar]
- Itti L, Koch C. A saliency-based search mechanism for overt and covert shifts of visual attention. Vision Res. 2000;40:1489–1506. doi: 10.1016/s0042-6989(99)00163-7. [DOI] [PubMed] [Google Scholar]
- Kappenman ES, Luck SJ. ERP components: the ups and downs of brainwave recordings. In: Luck SJ, Kappenman ES, editors. Oxford handbook of event-related potential components. New York: Oxford UP; 2012. [Google Scholar]
- Kastner S, Ungerleider LG. Mechanisms of visual attention in the human cortex. Annu Rev Neurosci. 2000;23:315–341. doi: 10.1146/annurev.neuro.23.1.315. [DOI] [PubMed] [Google Scholar]
- Kiesel A, Miller J, Jolicoeur P, Brisson B. Measurement of ERP latency differences: a comparison of single-participant and jackknife-based scoring methods. Psychophysiology. 2008;45:250–274. doi: 10.1111/j.1469-8986.2007.00618.x. [DOI] [PubMed] [Google Scholar]
- Kiss M, Jolicoeur P, Dell'acqua R, Eimer M. Attentional capture by visual singletons is mediated by top-down task set: new evidence from the N2pc component. Psychophysiology. 2008;45:1013–1024. doi: 10.1111/j.1469-8986.2008.00700.x. [DOI] [PMC free article] [PubMed] [Google Scholar]
- Kiss M, Grubert A, Petersen A, Eimer M. Attentional capture by salient distractors during visual search is determined by temporal task demands. J Cogn Neurosci. 2012;24:749–759. doi: 10.1162/jocn_a_00127. [DOI] [PubMed] [Google Scholar]
- Klein R. Inhibitory tagging system facilitates visual search. Nature. 1988;334:430–431. doi: 10.1038/334430a0. [DOI] [PubMed] [Google Scholar]
- Klein RM. Inhibition of return. Trends Cogn Sci. 2000;4:138–147. doi: 10.1016/s1364-6613(00)01452-2. [DOI] [PubMed] [Google Scholar]
- Leber AB. Neural predictors of within-subject fluctuations in attentional control. J Neurosci. 2010;30:11458–11465. doi: 10.1523/JNEUROSCI.0809-10.2010. [DOI] [PMC free article] [PubMed] [Google Scholar]
- Leber AB, Egeth HE. It's under control: top-down search strategies can override attentional capture. Psychon Bull Rev. 2006;13:132–138. doi: 10.3758/bf03193824. [DOI] [PubMed] [Google Scholar]
- Leblanc E, Prime DJ, Jolicoeur P. Tracking the location of visuospatial attention in a contingent capture paradigm. J Cogn Neurosci. 2008;20:657–671. doi: 10.1162/jocn.2008.20051. [DOI] [PubMed] [Google Scholar]
- Lien MC, Ruthruff E, Goodin Z, Remington RW. Contingent attentional capture by top-down control settings: converging evidence from event-related potentials. J Exp Psychol Hum Percept Perform. 2008;34:509–530. doi: 10.1037/0096-1523.34.3.509. [DOI] [PubMed] [Google Scholar]
- Lins OG, Picton TW, Berg P, Scherg M. Ocular artifacts in EEG and event-related potentials. I: Scalp topography. Brain Topogr. 1993;6:51–63. doi: 10.1007/BF01234127. [DOI] [PubMed] [Google Scholar]
- Luck SJ. An introduction to the event-related potential technique. Cambridge, MA: MIT; 2005. [Google Scholar]
- Luck SJ. Electrophysiological correlates of the focusing of attention within complex visual scenes: N2pc and related ERP components. In: Luck SJ, Kappenman ES, editors. Oxford handbook of event-related potential components. New York: Oxford UP; 2012. [Google Scholar]
- Luck SJ, Hillyard SA. Electrophysiological correlates of feature analysis during visual search. Psychophysiology. 1994a;31:291–308. doi: 10.1111/j.1469-8986.1994.tb02218.x. [DOI] [PubMed] [Google Scholar]
- Luck SJ, Hillyard SA. Spatial filtering during visual search: evidence from human electrophysiology. J Exp Psychol Hum Percept Perform. 1994b;20:1000–1014. doi: 10.1037//0096-1523.20.5.1000. [DOI] [PubMed] [Google Scholar]
- Luck SJ, Heinze HJ, Mangun GR, Hillyard SA. Visual event-related potentials index focused attention within bilateral stimulus arrays. II. Functional dissociation of P1 and N1 components. Electroencephalogr Clin Neurophysiol. 1990;75:528–542. doi: 10.1016/0013-4694(90)90139-b. [DOI] [PubMed] [Google Scholar]
- Luck SJ, Hillyard SA, Mouloua M, Woldorff MG, Clark VP, Hawkins HL. Effects of spatial cuing on luminance detectability: psychophysical and electrophysiological evidence for early selection. J Exp Psychol Hum Percept Perform. 1994;20:887–904. doi: 10.1037//0096-1523.20.4.887. [DOI] [PubMed] [Google Scholar]
- Luck SJ, Chelazzi L, Hillyard SA, Desimone R. Neural mechanisms of spatial selective attention in areas V1, V2, and V4 of macaque visual cortex. J Neurophysiol. 1997a;77:24–42. doi: 10.1152/jn.1997.77.1.24. [DOI] [PubMed] [Google Scholar]
- Luck SJ, Girelli M, McDermott MT, Ford MA. Bridging the gap between monkey neurophysiology and human perception: an ambiguity resolution theory of visual selective attention. Cogn Psychol. 1997b;33:64–87. doi: 10.1006/cogp.1997.0660. [DOI] [PubMed] [Google Scholar]
- Mangun GR. Neural mechanisms of visual selective attention. Psychophysiology. 1995;32:4–18. doi: 10.1111/j.1469-8986.1995.tb03400.x. [DOI] [PubMed] [Google Scholar]
- Mangun GR, Hillyard SA. Spatial gradients of visual attention: behavioral and electrophysiological evidence. Electroencephalogr Clin Neurophysiol. 1988;70:417–428. doi: 10.1016/0013-4694(88)90019-3. [DOI] [PubMed] [Google Scholar]
- Mangun GR, Hillyard SA. Allocation of visual attention to spatial locations: tradeoff functions for event-related brain potentials and detection performance. Percept Psychophys. 1990;47:532–550. doi: 10.3758/bf03203106. [DOI] [PubMed] [Google Scholar]
- Maris E. Statistical testing in electrophysiological studies. Psychophysiology. 2012;49:549–565. doi: 10.1111/j.1469-8986.2011.01320.x. [DOI] [PubMed] [Google Scholar]
- Maris E, Oostenveld R. Nonparametric statistical testing of EEG- and MEG-data. J Neurosci Methods. 2007;164:177–190. doi: 10.1016/j.jneumeth.2007.03.024. [DOI] [PubMed] [Google Scholar]
- Mazaheri A, DiQuattro NE, Bengson J, Geng JJ. Pre-stimulus activity predicts the winner of top-down vs. bottom-up attentional selection. PLoS One. 2011;6:e16243. doi: 10.1371/journal.pone.0016243. [DOI] [PMC free article] [PubMed] [Google Scholar]
- Miller J, Patterson T, Ulrich R. Jackknife-based method for measuring LRP onset latency differences. Psychophysiology. 1998;35:99–115. [PubMed] [Google Scholar]
- Mirpour K, Arcizet F, Ong WS, Bisley JW. Been there, seen that: a neural mechanism for performing efficient visual search. J Neurophysiol. 2009;102:3481–3491. doi: 10.1152/jn.00688.2009. [DOI] [PMC free article] [PubMed] [Google Scholar]
- Müller HJ, Findlay JM. The effect of visual attention on peripheral discrimination thresholds in single and multiple element displays. Acta Psychol (Amst) 1988;69:129–155. doi: 10.1016/0001-6918(88)90003-0. [DOI] [PubMed] [Google Scholar]
- Noudoost B, Chang MH, Steinmetz NA, Moore T. Top-down control of visual attention. Curr Opin Neurobiol. 2010;20:183–190. doi: 10.1016/j.conb.2010.02.003. [DOI] [PMC free article] [PubMed] [Google Scholar]
- Posner MI. Orienting of attention. Q J Exp Psychol. 1980;32:3–25. doi: 10.1080/00335558008248231. [DOI] [PubMed] [Google Scholar]
- Posner MI, Cohen Y. Components of visual orienting. In: Bouma H., Bouwhuis D, editors. Attention and performance. Vol. X. Hillsdale, NJ: Erlbaum; 1984. pp. 531–556. [Google Scholar]
- Reynolds JH, Desimone R. Interacting roles of attention and visual salience in V4. Neuron. 2003;37:853–863. doi: 10.1016/s0896-6273(03)00097-7. [DOI] [PubMed] [Google Scholar]
- Sawaki R, Luck SJ. Capture versus suppression of attention by salient singletons: electrophysiological evidence for an automatic attend-to-me signal. Atten Percept Psychophys. 2010;72:1455–1470. doi: 10.3758/APP.72.6.1455. [DOI] [PMC free article] [PubMed] [Google Scholar]
- Sawaki R, Luck SJ. Active suppression of distractors that match the contents of visual working memory. Vis Cogn. 2011;19:956–972. doi: 10.1080/13506285.2011.603709. [DOI] [PMC free article] [PubMed] [Google Scholar]
- Serences JT, Yantis S. Selective visual attention and perceptual coherence. Trends Cogn Sci. 2006;10:38–45. doi: 10.1016/j.tics.2005.11.008. [DOI] [PubMed] [Google Scholar]
- Serences JT, Yantis S. Spatially selective representations of voluntary and stimulus-driven attentional priority in human occipital, parietal, and frontal cortex. Cereb Cortex. 2007;17:284–293. doi: 10.1093/cercor/bhj146. [DOI] [PubMed] [Google Scholar]
- Treisman A, Sato S. Conjunction search revisited. J Exp Psychol Hum Percept Perform. 1990;16:459–478. doi: 10.1037//0096-1523.16.3.459. [DOI] [PubMed] [Google Scholar]
- Ulrich R, Miller J. Using the jackknife-based scoring method for measuring LRP onset effects in factorial designs. Psychophysiology. 2001;38:816–827. [PubMed] [Google Scholar]
- Wolfe JM. Guided search 2.0: a revised model of visual search. Psychon Bull Rev. 1994;1:202–238. doi: 10.3758/BF03200774. [DOI] [PubMed] [Google Scholar]
- Woodman GF, Luck SJ. Electrophysiological measurement of rapid shifts of attention during visual search. Nature. 1999;400:867–869. doi: 10.1038/23698. [DOI] [PubMed] [Google Scholar]
- Woodman GF, Luck SJ. Serial deployment of attention during visual search. J Exp Psychol Hum Percept Perform. 2003;29:121–138. doi: 10.1037//0096-1523.29.1.121. [DOI] [PubMed] [Google Scholar]
- Woodman GF, Arita JT, Luck SJ. A cuing study of the N2pc component: an index of attentional deployment to objects rather than spatial locations. Brain Res. 2009;1297:101–111. doi: 10.1016/j.brainres.2009.08.011. [DOI] [PMC free article] [PubMed] [Google Scholar]
- Yantis S, Serences JT. Cortical mechanisms of space-based and object-based attentional control. Curr Opin Neurobiol. 2003;13:187–193. doi: 10.1016/s0959-4388(03)00033-3. [DOI] [PubMed] [Google Scholar]