

Abstract
The general theory of sedimentation equilibrium (SE), applicable to mixtures of interacting sedimentable solutes at arbitrary concentration, is summarized. Practical techniques for the acquisition of SE data suitable for analysis are described. Experimental measurements and analyses of SE in concentrated protein solutions are reviewed. The method of non-ideal tracer sedimentation equilibrium (NITSE) is described. Experimental studies using NITSE to detect and quantitatively characterize intermolecular interactions in mixtures of dilute tracer species and concentrated proteins or polymers are reviewed.
Keywords: Macromolecular crowding, Globular proteins, Polymers, Self-association, Hetero-association, Colligative properties
1. Introduction
The detection and quantitative characterization of interactions between macromolecules in solution is a common objective in many areas of polymer chemistry, biochemistry, pharmaceutical chemistry, and molecular biology. Although sedimentation equilibrium (or sedimentation–diffusion equilibrium) is but one of many techniques employed toward this goal [1,2], it enjoys the reputation of being a “gold standard” because of its rigorous thermodynamic underpinnings. Because early studies of intermolecular interaction in solution were carried out on solutions dilute in macromolecules, analyses of sedimentation equilibrium in interacting systems were initially developed for thermodynamically ideal solutions, i.e., solutions in which nonspecific interactions between macromolecules, in contrast to the specific associations about which information is being sought, are negligible [3]. Subsequent treatments included approximate [4–6] or rigorous [7] corrections to allow for first-order deviations from thermodynamic ideality through incorporation of “second virial coefficient effects”. Wills and Winzor [8] and Behlke and Ristau [9] have presented analyses including approximate higher order corrections, applicable to somewhat higher concentration solutions. Chatelier and Minton [10,11] presented approximate corrections for nonideality in solutions of one or two associating solute components applicable over a broad range of concentration.
In recent years it has been increasingly appreciated that physiological media contain a total concentration of macromolecules as high as several hundred milligrams per milliliter, and that the kinetics and equilibria of biochemical reactions in such media may be substantially affected by nonspecific interactions between reactants, products, and nominally “inert” molecules in the immediate environment of the reaction [12]. In addition, the self-association and/or aggregation of recombinant proteins in solution at concentrations exceeding 200 mg/ml have become of substantial interest to the manufacturers of biopharmaceuticals [13]. The thermodynamic properties of macromolecular solutes in such concentrated or “crowded” solutions cannot be validly described using approximations that apply only to ideal or near-ideal solutions. The thermodynamic theory of sedimentation equilibrium in interacting systems has therefore been generalized to treat a system containing an arbitrary number of interacting solutes at arbitrary concentration [14,15]. A summary of the generalized treatment is presented below. Although the theory is rigorous, it contains a potentially large number of variables quantifying the magnitude of thermodynamic interactions between solute species, the values of which cannot be independently measured. In order to evaluate the respective contributions of nonspecific and specific interactions to the total observed behavior, extra-thermodynamic assumptions and approximations are required.
Following the description of theory and analysis, published accounts of experimental measurement of sedimentation equilibrium in solutions containing high concentrations of one or more species of macromolecule are reviewed, and key observations highlighted.
2. General theory of sedimentation equilibrium
The following conventions and notation will be utilized throughout. A component is defined as a solute of a particular elemental composition, such as an individual protein, nucleic acid, etc., and will be denoted by an unsubscripted name such as A or B. For simplicity in notation we limit the number of components treated here explicitly to two, but all arguments and derivations are straightforwardly extensible to an arbitrary number of components. A species is defined to be an individual sedimenting entity which may consist of a monomeric or oligomeric state of one or more components, and will be denoted by a subscripted name indicating the stoichiometry of the complex, i.e., AiBj. According to this scheme, monomeric A and monomeric B would be denoted by A1B0 and A0B1, respectively. A property of a generic species, independent of composition, will be denoted by a variable with a single subscript, whereas a property of a specific species will be denoted by a variable with double subscript indicating its composition. For example, the molar concentration of any individual species will be denoted by ci, whereas the molar concentration of AiBj will be denoted by cij.
The thermodynamic basis of sedimentation equilibrium has been understood for the better part of a century [16,17]. The condition of sedimentation equilibrium at constant temperature may be concisely expressed as:
| (1) |
where r1 and r2 denote two different radial positions (distances from the center of rotation), ω denotes the angular velocity of the rotor, R the molar gas constant, T the absolute temperature, ai the thermodynamic activity of the ith sedimenting species, and the buoyant molar mass of the ith sedimenting species, defined as
| (2) |
where Mi is the actual molar mass, and (dρ/dwi)μ denotes the specific density increment of the ith sedimenting species, measured under conditions such that the chemical potential of all other species remains constant [18]. Differentiation of Eq. (1) with respect to r yields:
| (3) |
Since ai = γiwi, where γi and wi denote the thermodynamic activity coefficient and w/v concentration of the ith species respectively, Eq. (3) may be rewritten
| (4) |
where the right-most term is summed over all sedimenting species. The partial derivative of the activity coefficient of the ith species with respect to the w/v or molar concentration of the jth species indicates that the concentrations of all species except the jth species are to be held constant when evaluating the derivative. The quantity ∂ ln γi/∂cj defines the magnitude of the thermodynamic interaction between species i and j, and we shall subsequently refer to this derivative as the thermodynamic interaction factor. A negative value indicates a net attractive interaction between the species, such that sedimentation of one species facilitates sedimentation of the other. Conversely, a positive value indicates a net repulsive interaction between the species, such that the sedimentation of one species inhibits sedimentation of the other. Defining the apparent buoyant molar mass of the ith species as
| (5) |
| (6) |
If there are n sedimentable species, then Eq. (6) represents a set of n linear equations relating the actual buoyant masses of each species to the apparent buoyant masses. The solution to these equations is given by [15]
| (7) |
where M⃗*and denote column vectors of and respectively, and A denotes a square matrix of dimension n × n with elements given by
| (8) |
where δij denotes the Kronecker delta function (=1 when i = j, 0 otherwise).
The primary data obtained from a sedimentation equilibrium experiment are tables of the values of one or more solution properties, or signals, as functions of r, the distance from the center of rotation. It is possible in principle (and practice) to measure multiple properties of the same solution, such as the absorbance at different wavelengths and the refractive index, as functions of the radial position. Prior to conduct of the sedimentation equilibrium experiment, the experimenter should establish that for each signal to be measured, two conditions are satisfied:
-
The baseline-corrected value of each signal (denoted by index k) is proportional to the w/v concentration of each component:
(9) The constant of proportionality is an independently measurable property of component j (for example, the extinction coefficient or refractive increment of component j at a particular wavelength of light).
- The total baseline-corrected signal measured in a solution mixture of components is a linear combination of the signals of each macromolecular component
(10)
For example, if it is desired to utilize ultraviolet or visible absorbance as a signal in a mixture of a protein and a nucleic acid, one should confirm that hyper- or hypo-chromicity is negligible over the range of compositions to be studied. If the two conditions stated above are met, it follows that at each radial position
| (11) |
where the index i now indicates a summation over species rather than components. The proportionality constants relating species concentration to the associated signal are given by
| (12) |
where fj,i denotes the mass fraction of component j in species i. For example, the mass fraction of component A in the species AnBm is nMA/(nMA + mMB).
We define an experimentally measurable quantity called the signal average apparent buoyant mass [19]:
| (13) |
which, in accordance with Eqs. (5 and 11), is equal to
| (14) |
Given the concentration and buoyant mass of each solute species present at a particular radial position r, and given numerical values for each of the ∂ ln γi/∂cj at the particular composition of the solution at r, one may solve Eq. (7) to obtain the corresponding values of the apparent buoyant mass of each species. Given independently measurable values of the , Eq. (12) is used to calculate the values of , and Eq. (14) then used to calculate the value of the signal-average buoyant molar mass.
3. Evaluation of thermodynamic interaction factors
ln γi represents the increment of free energy of solute–solute interaction associated with addition of an infinitesimal quantity of the ith solute species to a solution at fixed temperature, volume, and fixed solute composition {c}. According to the solution theory of McMillan and Mayer [20], ln γi may be expanded in powers of the concentrations of all solute species:
| (15) |
where the coefficient Bij is a calculable function of the potential of mean force characterizing a two-body interaction between molecules of species i and species j in a bath of solvent, the coefficient Bijk is a calculable function of the potential of mean force characterizing a three-body interaction between molecules of species i, j, and k, and so forth. Calculation of the Bij and Bijk characterizing interaction between complex biomolecules such as proteins from first principles, invoking theories of electrostatic, hydrophobic, and steric interaction, is a major challenge facing theoretical and computational biophysics [21,22]. Although progress has been made in this area, quantitative predictions of the magnitude of even two-body interaction coefficients under specified solution conditions (temperature, pH, ionic strength) are still unreliable at best, and the situation with respect to evaluation of higher-order interaction coefficients is even more poorly defined. Thus these coefficients are for the most part treated as variable parameters whose values are determined by modeling of composition-dependent data (see for example [7]). The major shortcoming of this approach is that in a complex mixture of two or more interacting species at high concentration, the number of coefficients required to specify the activity coefficients of each species as a function of concentration may rapidly become unmanageably large [15].
As an alternative to the expansion of activity coefficients in powers of species concentrations, an approximate treatment called the effective hard particle model has been proposed [23,24]. According to this model, a solution of macromolecules is treated as a fluid mixture of hard convex particles, each macrosolute species corresponding to an equivalent species of hard particle. One then utilizes equations of state obtained from various theories of hard particle fluids to estimate the activity coefficients of each macromolecular solute species and its concentration derivatives as functions of solution composition:
| (16) |
| (17) |
where {c} denotes the molar concentrations of all macromolecular solutes. Specific forms of the functions indicated by fi and fij in Eqs. (16 and 17) are given in [25,26].
The effective hard particle model is most appropriately applied to the description of solutions of globular proteins of sufficient ionic strength such that long-range electrostatic interactions are largely damped out, and nonspecific intermolecular interactions are dominated by short range steric repulsion [23]. Under appropriate conditions, the model has been found to account quantitatively for three colligative properties – sedimentation equilibrium, static light scattering, and osmotic pressure – of individual proteins and binary protein mixtures over a broad concentration range [27]. This quantitative description requires only a small number of variables, namely the specific volumes of the effective hard particle corresponding to each molecular species, in order to characterize the nonspecific repulsive interactions between all species. We emphasize that the effective hard particle model is an approximation based upon certain assumptions, and should be utilized only under conditions such that these assumptions are likely to be justifiable [23].
4. Sedimentation equilibrium in a mixture of reacting solute species
In a solution containing two solute components, A and B, there may exist a variety of homo- and hetero-oligomers in equilibrium with monomeric A and B. We therefore define a set of thermodynamic equilibrium association constants
| (18) |
In a non-ideal solution, the activities may differ significantly from the concentrations, so we define a set of apparent equilibrium constants, which are related to the thermodynamic equilibrium constants as follows:
| (19) |
The conservation of mass equations describing this system are
| (20) |
and
| (21) |
Given the values of cA,tot, cB,tot, the and the γij, Eqs. (20 and 21) may be solved analytically or numerically for the values of c10 and c01, and given these values, the concentrations of all species are calculated using Eq. (19). However, since in the general case, activity coefficients depend upon the concentrations, as indicated in Eqs. (15, 16), an iterative procedure is employed to solve Eqs. (15, 16) and Eqs. (19)–(21) to obtain convergent values of the γij and the cij [15]. Eq. (17) is then used to calculate the interaction factors, and given experimentally measurable values of the Eqs. (7)–(14) used to calculate the experimentally measurable signal- average buoyant mass as a function of wA,tot and wB,tot. Computational schemes have been devised that are sufficiently efficient to enable models incorporating specified association equilibria coupled with an effective hard particle description of non-ideal repulsive interactions between all species to be fit via nonlinear least squares to an experimentally measured dependence of signal-average buoyant mass upon solution composition quite rapidly using an ordinary desktop personal computer [15].
5. Experimental considerations
The objective of the experimental investigator is to detect and characterize equilibrium associations in the presence of nonspecific repulsive interactions. The development presented here suggests that the most direct way to do this is to acquire a body of data that consists of the dependence of one or more independent signal-average buoyant masses as a function of the total concentration of one or more sedimenting macrosolute components, and to model that composition dependence using the formalism and functions presented above. In a solution containing only one sedimentable component, such data is relatively simple to acquire. An experimentally measured gradient of baseline-corrected signal S(r) = αw(r) may be transformed into a gradient of ln S as a function of r2. The local slope of this gradient may then be numerically evaluated, and using Eq. (13) a table of as a function of w may be constructed for subsequent analysis as described above. In general, and particularly when the sample column is long and the gradient of sedimentable solute steep, the value of d ln S/dr2 will vary with position and the evaluation of this quantity subject to some uncertainty. The determination of d ln S/dr2 as a function of w is most reliable when applied to the results of short-column experiments conducted at rotor speeds such that the concentrations of sedimentable solutes at the base of the sample column do not exceed those at the meniscus by more than a factor of about 3 or 4. Under these conditions we find that a plot of ln S against r2 is very close to linear, and that a single sample-average value of d ln S/dr2 yields a value of that is characteristic of the composition of the parent loading solution [28]. Although each short-column sample yields only a single data point, the time required to attain sedimentation equilibrium is significantly shorter than with long column experiments and the amount of sample per cell significantly smaller. The centrifugation of multiple samples in parallel using four or eight-hole rotors and sample cells containing multiple sample compartments can provide an information-rich set of data within a comparatively short time [29].
6. Experimental studies
6.1. Measurement and analysis of SE in highly concentrated protein solutions
The detection and quantitative characterization of protein associations of very concentrated protein solutions presents an experimental and theoretical challenge to the investigator as the contribution of nonspecific repulsive interactions, primarily due to steric repulsion, may mask weakly attractive interactions leading to association and/or aggregation [30]. Published studies of the sedimentation equilibrium of protein solutions at high concentration are listed in Table 1. Below we comment on some findings of special interest to ourselves.
Table 1.
SE analysis of concentrated protein solutions.
| Protein (concentration range) | Conditions (temp, pH, ionic strength, buffer) | Comments (significance, etc.) | References |
|---|---|---|---|
| Normal and sickle hemoglobin (up to 300 g/l) | 20 °C; phosphate buffer pH 7.0, with 0.1 M NaCl, 1 mM EDTA | First SE experiments of normal and sickle Hb at high concentrations (up to 300 g/l). CO sickle Hb exists as a solution of unassociated molecules, as do CO and deoxy normal Hb. However, sickle deoxy-Hb exists in a gel-like state at concentrations above 140 g/l | [31] |
| Normal and sickle hemoglobin (up to 300 g/l) | 20 °C; phosphate buffer pH 7.4 | No self-association was detected in normal deoxy-Hb nor with normal/sickle CO-Hb up to about 350 g/l | [32] |
| Normal and sickle hemoglobin (up to 350 g/l) | From 2 to 37 °C; phosphate buffer pH 7.5 | The concentration dependence of apparent MW showed a lack of significant variation with temperature, establishing that the repulsive interaction was essentially entirely entropic | [45] |
| Hemoglobin, myoglobin (up to 350 g/l) | 20 °C; phosphate saline buffer, pH 7.4 | A novel analysis of SE of highly non-ideal protein solutions, based on the comparison of the experimental properties of the two proteins, was applied to conclude that myoglobin self-associates to form dimers and other higher order oligomers at high protein concentration | [46] |
| Bovine serum albumin (up to 200 g/l) | Phosphate saline buffer, pH 7.4 | Concentration dependence of apparent MW accounted for quantitatively by effective hard sphere model | Millar (unpublished, cited in [25]) |
| Bovine serum albumin, aldolase, ovalbumin (up to 200 g/l) | 20 °C; phosphate buffer pH 7.5, with 0.15 M NaCl | Tracer SE using preparative ultracentrifugation + post-centrifugation optical scanning of centrifuge tubes. Aldolase and ovalbumin appear to self-associate weakly at high protein concentration | [30] |
| Ribonuclease A (up to 200 g/l) | 20 °C; phosphate buffer pH 7.5, with 0.15 M NaCl. | Preparative ultracentrifugation + microfractionation. Analysis of concentration dependence of apparent Mw using theory introduced in this paper indicates weak self-association at higher concentration to dimers and possibly tetramers | [15] |
| Monoclonal IgG (up to 100 g/l) | 25 °C; phosphate buffer pH 6.8, with or without 0.15 M NaCl | Preparative ultracentrifugation + microfractionation of three monoclonal antibodies. One of the three antibodies clearly exhibits enhanced self-association at high protein concentration in low-salt buffer | [34] |
| Polyclonal IgG (up to 125 g/l) | 25 °C; phosphate buffer pH 7.5 with 0.15 M NaCl | IgG self-associates at very high protein concentration to form predominantly trimers. Interpretation is compatible with that derived from analysis of earlier osmotic pressure measurements carried out under comparable experimental conditions | [43] |
The first protein to be studied at high concentration by sedimentation equilibrium was hemoglobin in the early 1970s, due to its ready availability in large quantities and to the physiologic relevance of such studies, as the concentration of hemoglobin in red blood cells exceeds 300 g/l. The results of SE experiments conducted by Williams [31] and Briehl and Ewert [32] on normal and sickle hemoglobin are summarized in Figure 1. The extent of non-ideal behavior is evident in the tenfold decrease of apparent molecular weight of the protein as concentration increases to ca 200 g/l. This figure also illustrates the success of the effective hard sphere model in accounting for the concentration dependence of the apparent molecular weight of hemoglobin up to the highest protein concentrations studied with only a single nonideality parameter, the specific volume of the effective hard sphere [33]. These results indicate that normal hemoglobin does not significantly self-associate at the highest measurable concentrations, and that deoxy sickle hemoglobin does not significantly self-associate at any concentration below its abnormally low solubility limit, above which it forms a gel of rod-like polymers via a first-order phase transition [31].
Fig. 1.

Concentration dependence of apparent molar mass of normal and sickle hemoglobin. Symbols correspond to experimental data obtained by Williams [31] and Briehl and Ewert [32] for CO–HbA (x, panel a), deoxy HbA (circles, panel a), deoxy HbS at 20 °C (circles, panel b), and deoxy HbS at 5 °C (x, panel b). Curves are the best fit of an effective hard sphere model to the data, calculated using parameter values specified in Ross and Minton [33]. Figure reproduced from [33] with permission.
The detection and quantitative characterization of self-association and/or aggregation in highly concentrated formulations of monoclonal antibodies is a major concern of manufacturers of biopharmaceuticals [13]. Using preparative ultracentrifugation + microfractionation, Liu et al. [34] measured the SE gradients of three monoclonal antibodies at concentrations up 200 g/l in buffers of low ionic strength (40 mM histidine) and moderate ionic strength (40 mM histidine + 150 mM NaCl) (Figure 2). In moderate ionic strength buffer (panels A, B), the apparent weight-average molecular weight of the three antibodies decreased monotonically with protein concentration as expected from excluded volume effects in highly non-ideal solutions. However, in low ionic strength buffer (panels C, D), the concentration dependence of apparent weight-average molecular weight of two of the three antibodies exhibited enhanced self-repulsion, and the third showed a clear self-association that upon approximate correction for volume exclusion was compatible with the presence of species four times larger than monomer at protein concentrations above 60 g/l. In this study, simple visual inspection of the results of sedimentation equilibrium measurements at high concentration suffice to reveal the existence of significant species- specific electrostatically driven repulsive and attractive intermolecular interactions in low ionic strength media that are significantly diminished in higher ionic strength media.
Fig. 2.
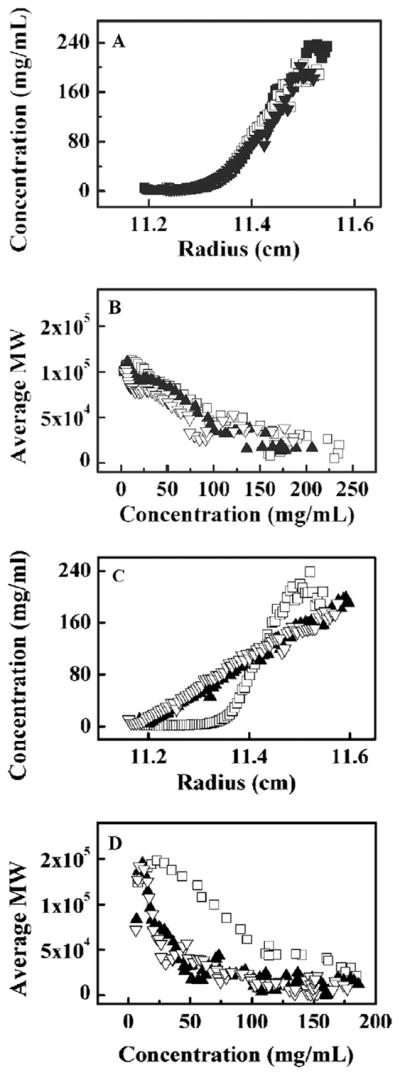
Equilibrium gradients and concentration dependence of apparent molar mass of three monoclonal antibodies in moderate ionic strength buffers (panels A, B), and in low ionic strength buffers (panels C, D). The symbols correspond to the experimental data. The loading concentration of all three antibodies was 100 mg/ml in both sets of experiments. Figures adapted from Ref.[34].
6.2. Measurement and analysis of SE in solutions containing dilute and concentrated macrosolutes
In biological fluids and compartments, most of the proteins of interest are not present at very high concentrations but as dilute components of highly concentrated solutions of other macromolecules (up to several hundreds of g/l), which occupy a considerable fraction of the total volume (up to 40%). Excluded volume effects and other nonspecific interactions between dilute and concentrated species in macromolecular crowded environments may have significant consequences for the energetics and dynamics of functional assembly processes [35]. For this reason, it is important to study the behavior of biologically relevant proteins in crowded solutions, as their reactivity cannot be inferred with confidence from the knowledge of the behavior of that particular protein in a dilute solution. However, the experimental challenges of these studies far exceed those encountered in the study of the equivalent reactions in dilute conditions and the properties of proteins in homogeneous concentrated solution. The experimenter has to deal not only with large deviations of thermodynamic ideality in such crowded solutions, but also with the challenge of monitoring (and measuring independently) dilute tracer species in the presence of much higher concentrations of crowding species.
Non-ideal tracer SE (NITSE) is a powerful technique to detect and characterize interactions between dilute components or between dilute and concentrated components in a solution containing one or more concentrated macrosolutes. A series of sample solutions are prepared in which the concentration of a dilute tracer species is held constant and the concentration of an presumptively inert “crowder” species varied over a broad concentration range. Each sample is centrifuged to sedimentation equilibrium and the gradients of tracer and crowder are measured independently. The tracer must have a uniquely detectable signal, which can be either intrinsic (linked to an enzymatic or immunochemical activity) or extrinsic (via labeling). If the tracer is optically labeled or possesses an intrinsic chromophore that is absent in crowder, the experimenter can use the analytical ultracentrifuge to detect and measure the SE gradient of the tracer in the presence of arbitrary concentrations of unlabeled macromolecules. An alternate approach permits application of NITSE analysis to solutions containing tracers and crowders without labels, or with non-optical labels [36]. Sample solutions are centrifuged to sedimentation equilibrium in a preparative ultracentrifuge, and subsequently fractionated into aliquots corresponding to known radial positions within the rotor of the sample in a preparative ultracentrifuge. The concentration of each component in each fraction (i.e., at each radial position) may be subsequently determined by a method or methods of the experimenter’s choice, and the equilibrium gradient of each component determined thereby [14,36].
6.2.1. Characterization of nonspecific repulsive interactions between tracer and crowder components
Rivas et al. [14] measured the equilibrium gradients of dilute radiolabeled or fluorescein-labeled fibrinogen and unlabeled BSA in solutions containing BSA at concentrations up to 100 g/l in HEPES-buffered saline, pH 7.4. In the absence of Ca2+ the dependence of the apparent buoyant mass of both proteins upon BSA concentration could be accounted for quantitatively by an effective hard particle model in which BSA was represented by a sphere of radius 2.7 nm and fibrinogen by a spherocylinder of radius 3.0 nm and length 47.5 nm. Both of these effective particles are similar in size and shape to those of the corresponding molecules at low resolution. Fodeke and Minton [37] measured the equilibrium gradients of dilute fluorescein-labeled BSA and unlabeled Ficoll 70 in solutions containing Ficoll at concentrations up to 100 g/l, and measured the equilibrium gradients of dilute fluorescein-labeled Ficoll and unlabeled BSA in solutions containing BSA at concentrations up to 100 g/l in phospate-buffered saline, pH 7.4. The observed dependence of the apparent buoyant mass of BSA upon the concentrations of Ficoll and BSA, and the dependence of the buoyant mass of Ficoll upon the concentrations of Ficoll and BSA, could be accounted for quantitatively by an effective hard particle model in which BSA was represented by a sphere of radius 3.4 nm and Ficoll by a spherocylinder of radius 1.4 nm and length 18.4 nm. The results of both of these studies indicate a lack of significant self-association or hetero-association of either component.
6.2.2. Self-association of tracer proteins in crowded media
When Ca2+ was added to the solutions of dilute labeled fibrinogen and unlabeled BSA in the study of Rivas et al. referred to above [14], the equilibrium gradients of BSA were unaffected, but those of fibrinogen increased substantially in a manner that depended upon both the concentration of fibrinogen and BSA, indicating significant self-association of fibrinogen in BSA solutions exceeding 40 g/l. Rivas et al. [14] also measured the equilibrium gradients of dilute rhodamine-labeled tubulin and unlabeled dextran T10 in solutions of containing dextran at concentrations up to 100 g/l. The gradients of tubulin varied upon both tubulin and dextran concentration in a manner indicating promotion of tubulin self-association by high concentrations of dextran.
NITSE was used by Rivas et al. [38] to study the effect of high concentrations of unrelated proteins upon the self-association of the bacterial cell division protein FtsZ. Solutions containing dilute radiolabeled FtsZ in varying concentrations of BSA or hemoglobin at concentrations up to 150 g/l were centrifuged to sedimentation equilibrium and the gradients of both dilute and concentrated protein measured independently. In the absence of crowder protein, FtsZ monomer in its GDP-bound state undergoes Mg+2-linked indefinite self-association [39]. The observed dependence of the apparent buoyant molar mass of FtsZ upon the concentrations of FtsZ and each crowder protein may be quantitatively accounted for by an effective hard particle model in which the crowder protein is represented by an effective hard sphere and each oligomer of FtsZ is represented by a spherocylinder with constant radius and a length that increases with the number of protomers making up the oligomer (Figure 3). It follows that high concentrations of either BSA or hemoglobin significantly enhance the indefinite self-association of FtsZ in a nonspecific manner that can be attributed essentially entirely to excluded volume.
Fig. 3.
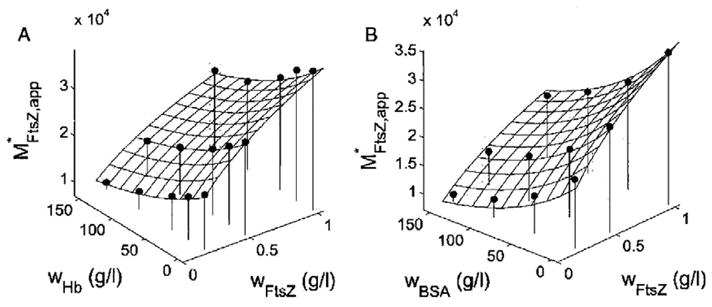
Dependence of apparent weight-average buoyant molar mass of FtsZ upon concentrations of FtsZ and either hemoglobin (A) or BSA (B). Symbols: experimental data. Solid curve: best fit of effective hard particle (sphere + spherocylinder) model as described in [38]. Figure reproduced from [38] with permission.
6.2.3. Hetero-association of tracer components in crowded media
Rivas and Minton [40] proposed an experimental strategy to measure the effect of crowder species X on the hetero-association between macromolecules A and B by means of NITSE. The apparent buoyant molar mass of tracer labeled A (A*) is measured as a function of the loading concentration of crowder X. The measurements are repeated in the presence of varying amounts of unlabeled B. If B binds to A (or if A self-associates), the apparent buoyant molar mass of A* in the presence of B will exceed that measured at the same concentration of X in the absence of B. This will be true at any concentration of X, although the difference between the two values will depend upon the concentration of X. With results obtained at a sufficient number of concentrations of B, an effective isotherm for binding of B to A* can be constructed for each concentration of X. The effect of crowder upon the hetero-association of A and B will be manifest in the dependence of the equilibrium constant( s) obtained by modeling the effective isotherm at each crowder concentration upon the concentration of crowder. Using this strategy, Alcorlo et al. [41] found that the addition of 100 g/l of dextran 10 K increased the affinity of Ø29 phage protein p6 for the left terminal fragment L (259 bp) of Ø29 DNA by a factor of approximately 10 (Figure 4). This is the first direct experimental observation and quantitative analysis using SE of the enhancement of protein–DNA complex formation upon the addition of crowding agents.
Fig. 4.
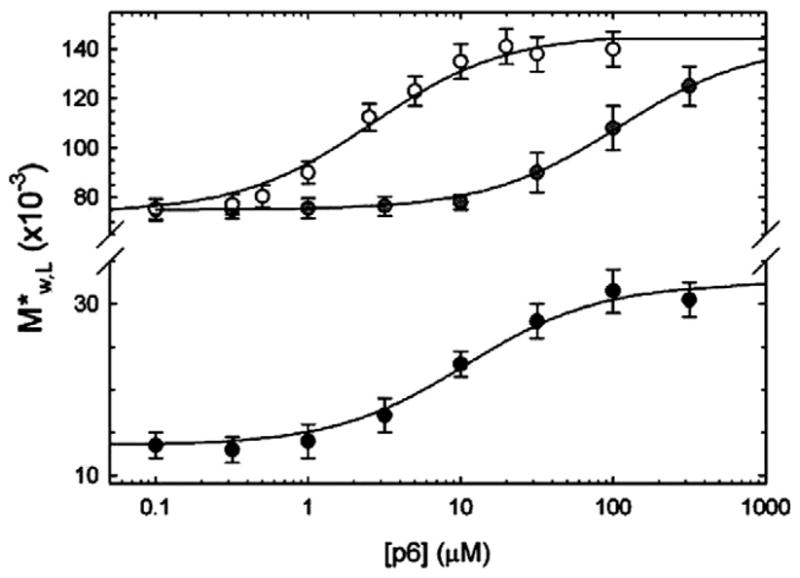
Dependence of the weight-average buoyant molar mass/apparent weight-average buoyant molar mass of L fragment upon the concentration of p6 in the presence (black circles) and in the absence (gray circles) of 100 g/l of dextran 10 K at 0.5 M KCl, and in the absence of dextran (white circles) at 0.05 M KCl. Symbols: data; solid curves: best fit of equivalent independent binding site equation to respective data sets. For high salt, the value of the apparent binding equilibrium association constant Kapp is 104 M−1 in the absence of dextran and 105 M−1 in the presence of 100 g/l dextran. Figure reproduced from [41] with permission.
7. Conclusion
In this review we have summarized theoretical and methodological advances in the measurement and analysis of sedimentation equilibrium in highly concentrated solutions of proteins or polymers. We have also summarized published experimental measurements of non-ideal tracer sedimentation equilibrium in solutions containing both dilute and concentrated macromolecular species. These data can be analyzed to provide quantitative information about self-association of the dilute as well as the concentrated species, hetero-association of dilute and concentrated species, nonspecific repulsive self-interaction between molecules of the concentrated species, and repulsive hetero-interaction between molecules of dilute and concentrated species.
The composition dependence of other thermodynamically-based colligative properties of macromolecular solutions at high concentration (static light scattering, osmotic pressure) can also be analyzed to yield comparable information about repulsive and attractive interactions between species present in significant abundance [42,43]. However, neither of these measurements provides information about intermolecular interactions involving dilute species in the presence of concentrated species. Measurements of the change induced in various spectroscopic properties of dilute proteins upon addition of concentrated polymers can be interpreted in the context of association models (see for example [44]). However, if associations involve more than two states of a tracer protein, the spectroscopic properties of intermediate species, which are not independently measurable, must be specified, requiring assumptions of unknown validity. No such assumptions are necessary for the interpretation of changes in signal-average buoyant mass, since the buoyant mass and associated signal of every species specified in an equilibrium reaction scheme may be calculated directly from the known properties of the individual components, as described above in the section on theory. Nonideal tracer sedimentation equilibrium thus remains the most reliable and widely applicable method for detection and quantitative characterization of intermolecular interactions of dilute macromolecules in solutions containing high concentrations of other macromolecules.
Acknowledgments
G.R. acknowledges funds from Plan Nacional BIO2008-04778-C03-03 (Ministerio de Ciencia e Innovación, Spain), COMBACT SBIO-0260/2006 (Comunidad de Madrid) and DIVINOCELL FP7 HEALTH-F3-2009-223431 (European Commission). Research of A.P.M. is supported by the Intramural Research Program of the National Institute of Diabetes and Digestive and Kidney Diseases, National Institutes of Health, US Department of Health and Human Services.
Contributor Information
Germán Rivas, Email: grivas@cib.csic.es.
Allen P. Minton, Email: minton@helix.nih.gov.
References
- 1.Golemis EA, Adams PD. Protein–Protein Interactions. A Molecular Cloning Manual. 2. Cold Spring Harbor Laboratory Press; NY: 2005. [Google Scholar]
- 2.Phizicky EM, Fields S. Microbiol Rev. 1995;59:94–123. doi: 10.1128/mr.59.1.94-123.1995. [DOI] [PMC free article] [PubMed] [Google Scholar]
- 3.Teller DC. Meth Enzymol. 1973;27:346–441. doi: 10.1016/s0076-6879(73)27017-9. [DOI] [PubMed] [Google Scholar]
- 4.Adams ET, Jr, Lewis MS. Biochemistry. 1968;7:1044–1053. doi: 10.1021/bi00843a025. [DOI] [PubMed] [Google Scholar]
- 5.Holladay LA, Sophianopoulos AJ. J Biol Chem. 1972;247:427–439. [PubMed] [Google Scholar]
- 6.Yphantis DA, Roark DE. Biochemistry. 1972;11:2925–2934. doi: 10.1021/bi00766a001. [DOI] [PubMed] [Google Scholar]
- 7.Wills PR, Winzor DJ. Thermodynamic non-ideality and sedimentation equilibrium. In: Harding SE, Rowe AJ, Horton JC, editors. Analytical Ultracentrifugation in Biochemistry and Polymer Science. Royal Society of Chemistry; Cambridge: 1992. pp. 311–330. [Google Scholar]
- 8.Wills PR, Winzor DJ. Biophys Chem. 2001;91:253–262. doi: 10.1016/s0301-4622(01)00174-0. [DOI] [PubMed] [Google Scholar]
- 9.Behlke J, Ristau O. Biophys Chem. 2000;87:1–13. doi: 10.1016/s0301-4622(00)00173-3. [DOI] [PubMed] [Google Scholar]
- 10.Chatelier RC, Minton AP. Biopolymers. 1987;26:507–524. doi: 10.1002/bip.360260405. [DOI] [PubMed] [Google Scholar]
- 11.Chatelier RC, Minton AP. Biopolymers. 1987;26:1097–1113. doi: 10.1002/bip.360260709. [DOI] [PubMed] [Google Scholar]
- 12.Zhou HX, Rivas G, Minton AP. Annu Rev Biophys. 2008;37:375–397. doi: 10.1146/annurev.biophys.37.032807.125817. [DOI] [PMC free article] [PubMed] [Google Scholar]
- 13.Shire SJ, Shahrokh Z, Liu J. J Pharm Sci. 2004;93:1390–1402. doi: 10.1002/jps.20079. [DOI] [PubMed] [Google Scholar]
- 14.Rivas G, Fernandez JA, Minton AP. Biochemistry. 1999;38:9379–9388. doi: 10.1021/bi990355z. [DOI] [PubMed] [Google Scholar]
- 15.Zorrilla S, Jimenez M, Lillo P, Rivas G, Minton AP. Biophys Chem. 2004;108:89–100. doi: 10.1016/j.bpc.2003.10.012. [DOI] [PubMed] [Google Scholar]
- 16.Svedberg T, Petersen KO. The Ultracentrifuge. Oxford University Press; London: 1940. [Google Scholar]
- 17.Tiselius A. Zeit physik Chem. 1926;124:449–463. [Google Scholar]
- 18.Eisenberg H. Biological Macromolecules and Polyelectrolytes in Solution. Clarendon Press; Oxford: 1976. [Google Scholar]
- 19.Minton AP. Progr Colloid Polym Sci. 1997;107:11–19. [Google Scholar]
- 20.McMillan WG, Jr, Mayer JE. J Chem Phys. 1945;13:276–305. [Google Scholar]
- 21.Dumetz AC, Snellinger-O’Brien AM, Kaler EW, Lenhoff AM. Protein Sci. 2007;16:1867–1877. doi: 10.1110/ps.072957907. [DOI] [PMC free article] [PubMed] [Google Scholar]
- 22.Lund M, Jönsson B. Biophys J. 2003;85:2940–2947. doi: 10.1016/S0006-3495(03)74714-6. [DOI] [PMC free article] [PubMed] [Google Scholar]
- 23.Hall D, Minton AP. Biochem Biophys Res Commun. 2003;1649:127–139. doi: 10.1016/s1570-9639(03)00167-5. [DOI] [PubMed] [Google Scholar]
- 24.Minton AP, Edelhoch H. Biopolymers. 1982;21:451–458. [Google Scholar]
- 25.Minton AP. Mol Cell Biochem. 1983;55:119–140. doi: 10.1007/BF00673707. [DOI] [PubMed] [Google Scholar]
- 26.Minton AP. Meth Enzymol. 1998;295:127–149. doi: 10.1016/s0076-6879(98)95038-8. [DOI] [PubMed] [Google Scholar]
- 27.Minton AP. J Pharm Sci. 2007;96:3466–3469. doi: 10.1002/jps.20964. [DOI] [PubMed] [Google Scholar]
- 28.Rivas G, Ingham KC, Minton AP. Biochemistry. 1992;31:11707–11712. doi: 10.1021/bi00162a006. [DOI] [PubMed] [Google Scholar]
- 29.Correia JJ, Yphantis DA. Equilibrium sedimentation in short column solutions. In: Harding SE, Rowe AJ, Horton JC, editors. Analytical Ultracentrifugation in Biochemistry and Polymer Science. Royal Society of Chemistry; Cambridge: 1992. pp. 231–252. [Google Scholar]
- 30.Muramatsu N, Minton AP. J Mol Recognit. 1989;1:166–171. doi: 10.1002/jmr.300010404. [DOI] [PubMed] [Google Scholar]
- 31.Williams RC., Jr Proc Natl Acad Sci USA. 1973;70:1506–1508. doi: 10.1073/pnas.70.5.1506. [DOI] [PMC free article] [PubMed] [Google Scholar]
- 32.Briehl RW, Ewert S. J Mol Biol. 1973;80:445–458. doi: 10.1016/0022-2836(73)90415-4. [DOI] [PubMed] [Google Scholar]
- 33.Ross PD, Minton AP. J Mol Biol. 1977;112:437–452. doi: 10.1016/s0022-2836(77)80191-5. [DOI] [PubMed] [Google Scholar]
- 34.Liu J, Nguyen MD, Andya JD, Shire SJ. J Pharm Sci. 2005;94:1928–1940. doi: 10.1002/jps.20347. [DOI] [PubMed] [Google Scholar]
- 35.Minton AP. J Cell Sci. 2006;119:2863–2869. doi: 10.1242/jcs.03063. [DOI] [PubMed] [Google Scholar]
- 36.Darawshe S, Rivas G, Minton AP. Anal Biochem. 1993;209:130–135. doi: 10.1006/abio.1993.1092. [DOI] [PubMed] [Google Scholar]
- 37.Fodeke AA, Minton AP. J Phys Chem B. 2010;114:10876–10800. doi: 10.1021/jp104342f. [DOI] [PMC free article] [PubMed] [Google Scholar]
- 38.Rivas G, Fernandez JA, Minton AP. Proc Natl Acad Sci USA. 2001;98:3150–3155. doi: 10.1073/pnas.051634398. [DOI] [PMC free article] [PubMed] [Google Scholar]
- 39.Rivas G, López A, Mingorance J, Ferrándiz MJ, Zorrilla S, Minton AP, Vicente M, Andreu JM. J Biol Chem. 2000;275:11740–11749. doi: 10.1074/jbc.275.16.11740. [DOI] [PubMed] [Google Scholar]
- 40.Rivas G, Minton AP. J Mol Recognit. 2004;17:362–367. doi: 10.1002/jmr.708. [DOI] [PubMed] [Google Scholar]
- 41.Alcorlo M, Jimenez M, Ortega A, Hermoso JM, Salas M, Minton AP, Rivas G. J Mol Biol. 2009;385:1616–1629. doi: 10.1016/j.jmb.2008.11.044. [DOI] [PubMed] [Google Scholar]
- 42.Fernández C, Minton AP. Biophys J. 2009;96:1992–1998. doi: 10.1016/j.bpj.2008.11.054. [DOI] [PMC free article] [PubMed] [Google Scholar]
- 43.Jimenez M, Rivas G, Minton AP. Biochemistry. 2007;46:8373–8378. doi: 10.1021/bi7005515. [DOI] [PubMed] [Google Scholar]
- 44.Zorilla S, Rivas G, Lillo MP. J Mol Recognit. 2004;17:408–416. doi: 10.1002/jmr.712. [DOI] [PubMed] [Google Scholar]
- 45.Ross PD, Briehl RW, Minton AP. Biopolymers. 1978;17:2285–2288. doi: 10.1002/bip.1978.360170920. [DOI] [PubMed] [Google Scholar]
- 46.Minton AP, Lewis MS. Biophys Chem. 1981;14:317–324. doi: 10.1016/0301-4622(81)85033-8. [DOI] [PubMed] [Google Scholar]