

Abstract
Introduction
A diet containing a high amount of fat has been shown, in short-term studies, to increase the expression of pancreatic lipase and colipase.
Aim
To investigate the effects of long-term high-fat–feeding (113 days) on the mRNA expression of pancreatic lipase, colipase, pancreatic lipase-related proteins (1 and 2), and uncoupling proteins during the development of obesity and glucose intolerance.
Methodology
Mice were fed either a high-fat or standard diet and killed after 3, 13, 57, and 113 days. Brown and white adipose tissues from the pancreas were collected for mRNA extraction.
Results
The high-fat–fed mice became obese and glucose-intolerant by 113 days. The high-fat diet increased lipase (p < 0.05) expression initially. At the end of the experiment, the lipase levels had decreased to the level of the control. Colipase levels did not change during the first 57 days of high-fat feeding but decreased below control levels by 113 days (p < 0.05). The high-fat diet increased brown adipose tissue uncoupling protein 1 (UCP1)(p < 0.005) expression but not the expression of uncoupling protein 2.
Conclusion
Long-term high-fat feeding, leading to glucose intolerance, occurs with a simultaneous decrease in the mRNA expression of pancreatic lipase and colipase and an increase in UCP1 expression.
Fat is a major dietary energy source in the Western world, representing 30–40% of the total caloric intake. More than 95% of this fat is composed of triacylglycerol. To enter the intestinal cell and to be further transported into the circulation, triacylglycerol needs to be digested. Several lipases are involved in the digestion of triacylglycerol. Lipolysis begins in the stomach with the action of preduodenal lipases and lingual and gastric lipase. However, the majority of fat digestion occurs in the upper intestine by pancreatic lipase and its protein cofactor, colipase (1,2). Lipase is inhibited by bile salts and therefore requires colipase in a 1:1 molar ratio for its binding and interaction with the triacylglycerol droplet (2). Isolated deficiency of either pancreatic lipase (3) or pancreatic colipase (4) yields steatorrhea, underscoring the importance of these proteins in fat digestion. Also, colipase deficient mice have steatorrhea and decreased body weight (5). Colipase is secreted as a proform, procolipase, which is processed in the intestine to release colipase and a pentapeptide named enterostatin. Enterostatin has been shown to act as a specific satiety signal for fat (6). In rat and mouse pancreas there is twice as much lipase as colipase; hence colipase is the limiting factor for fat digestion (7).
A number of studies have shown that when rats are fed a diet rich in fat, the expression of pancreatic lipases increases to meet the nutritional challenge. This increase has been shown in short-term feeding studies of young animals (8–10) and may not be relevant to obesity, which develops over longer periods. Little is known about the expression of pancreatic lipases during long-term high-fat feeding. Furthermore, changes in lipase expression with high-fat feeding may vary with age because age is an independent factor that influences pancreatic lipase expression (11).
The level of fat in the diet may regulate the expression of other pancreatic proteins. Two pancreatic proteins with sequence homology (68 and 65%, respectively) to pancreatic lipase have been identified and are known as pancreatic lipase related protein 1 (PLRP1) and 2 (PLRP2) (12). It is unknown whether these lipases respond to intake of fat. Rat PLRP2, first identified as a zymogen granule membrane protein, GP-3, is a pancreatic lipase with kinetic properties that differs from traditional pancreatic lipase (13). PLRP2 has broader substrate specificity than pancreatic lipase and is not colipase-dependent (14). No lipase activity has been detected for PLRP1; however, it binds colipase with an affinity equal to that of lipase. Its structural properties suggest that PLRP1 may participate in dietary fat metabolism (14); however, its physiological action is still unknown. Both PLRP1 and PLRP2 are expressed during early gestation and increase to maximum levels at 12 hours after birth, thereafter declining with age (15). PLRP2 has been shown to be important for fat digestion in the neonate (14).
One defense mechanism against a high-fat diet is the induction of thermogenesis via uncoupling protein 1 (UCP1). UCP1 is located in the inner mitochondrial membrane in brown adipose tissue and is able to dissipate the proton gradient. This results in increased heat production and decreased ATP production (16). UCP1 has been shown to increase during high-fat feeding, thereby contributing to diet-induced non-shivering thermogenesis and protecting against obesity (17–19). Uncoupling protein 2 (UCP2) is a protein with 59% sequence homology to UCP1, which has also been suggested to be involved in the defense against obesity and type 2 diabetes, based on reports of an increased expression during high-fat feeding (18,20). The role of UCP2 during high-fat feeding is, however, a matter of controversy (18,21,22). It has recently been suggested that UCP2 (22) does not have a role in total body homeostasis; instead, it might work at the cellular level, limiting the generation of reactive oxygen species (21). Since high levels of UCP2 have been found in organs of the immune system, UCP2 might be involved in the inflammatory response (21). Indeed, mice with a targeted disruption of the UCP2 gene are resistant to infection with Toxoplasma gondii (21).
The aim of the present investigation was to study the effects of long-term high-fat feeding on the mRNA expression of pancreatic lipase, colipase, and pancreatic lipase-related proteins (1 and 2). We also studied the mRNA expression of the thermogenic uncoupling protein 1 and 2. This study was conducted on the outbred NMRI mouse strain, which is a strain with no specific genetic abnormality and that is relatively resistant to the development of obesity when fed a high-fat diet. However, this mouse strain has been shown to develop both obesity and glucose intolerance when fed a high-fat diet for a longer period (23).
METHODS
Animals and diets
Six-week-old male Naval Medical Research Institute (NMRI) mice, weighing 23.7 ± 0.1 g, were obtained from Bornholt, Denmark. The mice were divided into two groups, one was fed standard chow (R3, Lactamin AB, Sweden) containing 210 g/kg protein, 430 g/kg carbohydrate, 50 g/kg fat (15% of the energy as fat), 105 g/kg fiber, 205 g/kg water, vitamins, and minerals, yielding 12.6 MJ/kg energy. The other group was fed a high-fat diet containing 313 g/kg protein, 170 g/kg carbohydrate, 370 g/kg fat (63% of the energy as fat), 92 g/kg fiber, 15 g/kg vitamin mix, and 40 g/kg minerals, yielding 23.2 MJ/kg energy (19) (Table 1). Food and water were available ad libitum. Six mice in each group were killed at day 3, day 13, day 57, and day 113. White adipose tissue and brown adipose tissue from the pancreas were rapidly collected and immediately frozen in liquid nitrogen.
TABLE 1.
Macronutrient content of the diets
| Content | High-fat diet (g/100 g) | Standard diet (g/100 g) |
|---|---|---|
| Protein | 31 | 21 |
| Carbohydrate | 17 | 43 |
| Fat | 36.9a | 5b |
| Energy (%) | ||
| Protein | 24 | 28 |
| Carbohydrate | 13 | 57 |
| Fat | 63 | 15 |
The fat consists of 84% coconut butter and 16% corn oil.
The fat consists of 70% lard and 30% linoleic acid.
Glucose tolerance
At day 0, 57, and 113, a glucose tolerance test was performed on five mice from each group, separate from the mice used for collection of tissue samples. The mice were fasted for 5 hours (starting between 7 and 9 AM), anesthetized with sodium pentobarbital (20 mg/kg i.p.), and injected i.p. with a glucose solution (1 mg glucose/g body weight). Blood samples from these mice were collected from the tail vein (15 μL), and glucose was immediately measured with Accutrend glucose gauge (Roche Diagnostics Scandinavia AB, Bromma, Sweden).
Isolation of RNA and Northern blot
RNA was extracted from the different tissues according to Chomczynski (24). A total of 20 μg RNA was separated on 1% agarose gel containing 2% formaldehyde and transferred to a nylon membrane (Zeta-Probe, Bio-Rad, CA). Prehybridization and hybridization were carried out overnight either at 60°C (for lipase, colipase, and UCP probes) or at 37°C (for the 18S probe). The probes were labeled with (α-32P)dCTP (Amersham, Pharmacia Biotech, U.K.) using a nick translation kit (Roche Diagnostics Gmbh, Mannheim, Germany), whereas the 18S probe was end-labeled using T4 polynucleotide kinase (Life Technologies AB, Täby, Sweden) and (γ-32P)ATP. The filters were washed for 10 minutes in 0.20 mM Na2HPO4, 5% SDS, pH 7.2, and 10 minutes in 0.20 mM Na2HPO4, 1% SDS, pH 7.2. The intensity of the bound probes was analyzed with a phospho-imager (Fujix, Bas 2000). Rehybridization with the 18S probe was accomplished as described above in 37°C. The lipase, colipase, PLRP1, PLRP2, and UCP mRNA levels were compared with the 18S standard and expressed in arbitrary units.
Probes
The probes for UCP1 and UCP2 as well as for mouse pancreatic lipase, PLRP1, and PLRP2 have been described previously (14,19). The 18S rRNA probe was purchased from DNA Technology (Denmark).
Western blot
Pancreas tissue from mice killed on days 3, 57, and 113 was homogenized and 10 μg total protein was applied on a 10% SDS-polyacrylamide gel. Proteins were transferred to a ProBlott membrane (Applied Biosystems), and lipase protein was detected by immunostaining using a polyclonal lipase antiserum diluted 1/500 (a rabbit anti-porcine-lipase, which recognizes both rat and mouse pancreatic lipase) and developed with chemoluminescence.
Statistical Analyses
Data are presented as means ± SEM. The effect of diet on each response variable (i.e., body weight, fat-pad, lipase, colipase, PLRP1, PLRP2, UCP1, and UCP2) was analyzed by analysis of variance (ANOVA) techniques. We used two-way ANOVA, also taking into account the time factor (25). The response variables were log-transformed. If a statistically significant (p < 0.05) interaction between the factors diet and time was indicated, the effect of diet was tested by using the t test for each time point; the (time-specific) p values were then adjusted according to Bonferroni’s method (25). Glucose levels (Fig. 2) were compared using repeated-measure two-way ANOVA, following Duncan’s multiple range test.
FIG. 2.

Glucose tolerance. An i.p glucose tolerance test (1 mg glucose/g body weight) was performed at three different time points: day 0, day 57, and day 113 (n = 5 at all time points). A statistical difference between the high-fat–fed mice and the standard-fed mice was observed at day 113 (p < 0.001). Values are expressed as means ± SEM (two-way ANOVA following Duncan’s multiple range test was used to calculate the significance).
RESULTS
Body weight and epididymal fat-pads
The body weight of the mice increased rapidly during the first 2 weeks of the experiment, regardless of the diet. The mice fed the standard diet reached a plateau in weight gain by day 57 (Fig. 1A). In contrast, the mice fed the high-fat diet had a significant increase in body weight (p < 0.001) (n = 6 at each time point). The epididymal fat pads from the mice fed the high-fat diet weighed significantly more (p < 0.001)(n = 6 at each time point) compared with the fat pads from the mice fed the standard diet (Fig. 1B). Since there was an interaction between diet and time in epididymal fat pad weight, a t test with Bonferroni correction was performed. This analysis showed significance at each time point: day 3, p = 0.03; day 13, p = 0.02; day 57, p = 0.04; and day 113, p = 0.01.
FIG. 1.
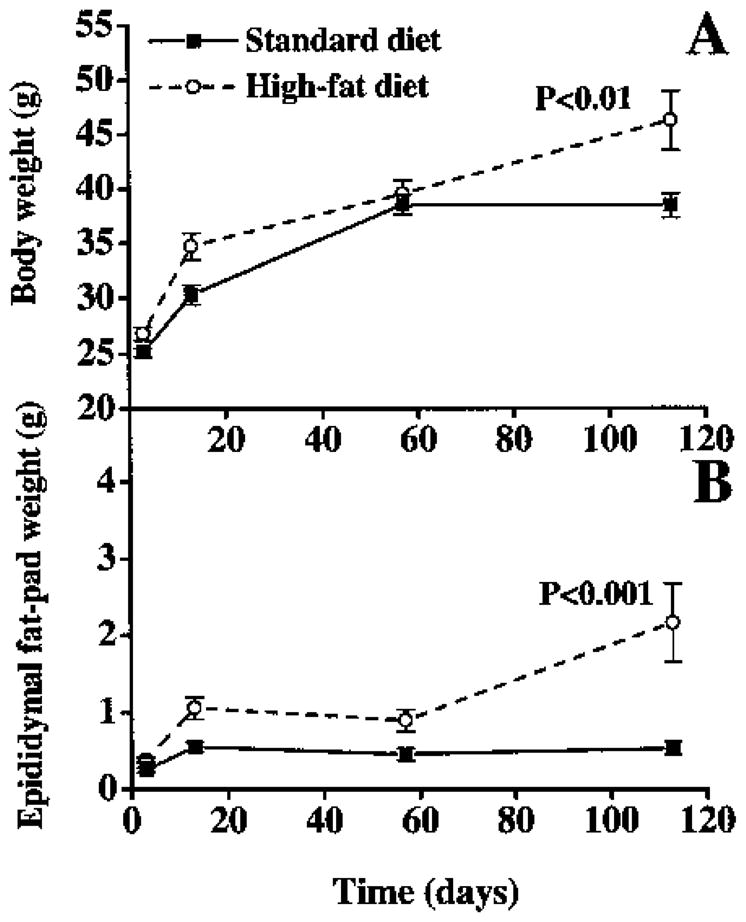
Effect of high-fat feeding on body weight (A) and epididymal fat pad weight (B). Mice were fed a high-fat diet for 3, 13, 57, or 113 days. A: Two-way ANOVA indicated significant differences in body weight (p < 0.01). B: Epididymal fat pads from mice fed a high-fat diet were significantly larger (two-way ANOVA, p < 0.001) at all time points (Bonferroni corrected t test: day 3 (p = 0.03), day 13 (p = 0.02), day 57 (p = 0.04), and day 113 (p = 0.01). Values are expressed as means ± SEM (n = 6).
Glucose tolerance
To detect changes in glucose tolerance, an i.p. glucose tolerance test was performed on days 0, 57, and 113. By day 57, the mice fed a high-fat diet showed slightly elevated blood glucose, although this was not significant difference (p > 0.05)(n = 5 at each time point) (Fig. 2). By day 113, the high-fat–fed animals had significantly higher glucose levels—approximately 60% higher than those measured in the standard-fed mice (p < 0.001, n = 5 at each time point) (Fig. 2).
Pancreatic lipases and colipase expression
High-fat feeding significantly increased the lipase mRNA expression compared with standard feeding (p < 0.05, n = 6 at each time point) (Fig. 3A). The increase occurred rapidly, within the first 3 days of high-fat feeding (increased 39%) and persisted for 57 days (showing an increase of 33% and 26% on days 13 and 57, respectively). However, at the end of the experiment, the lipase mRNA levels in the high-fat–fed mice decreased to the same levels as those in the standard-fed mice. In comparison, the colipase mRNA levels increased gradually for both groups during the first 57 days (Fig. 3B). However, the colipase mRNA levels were decreased by 100% at day 113, with continued high-fat feeding (p < 0.05, n = 6 at each time point). On the other hand, the colipase levels for the standard-fed mice remained high at this last time point (Fig. 3B).
FIG. 3.
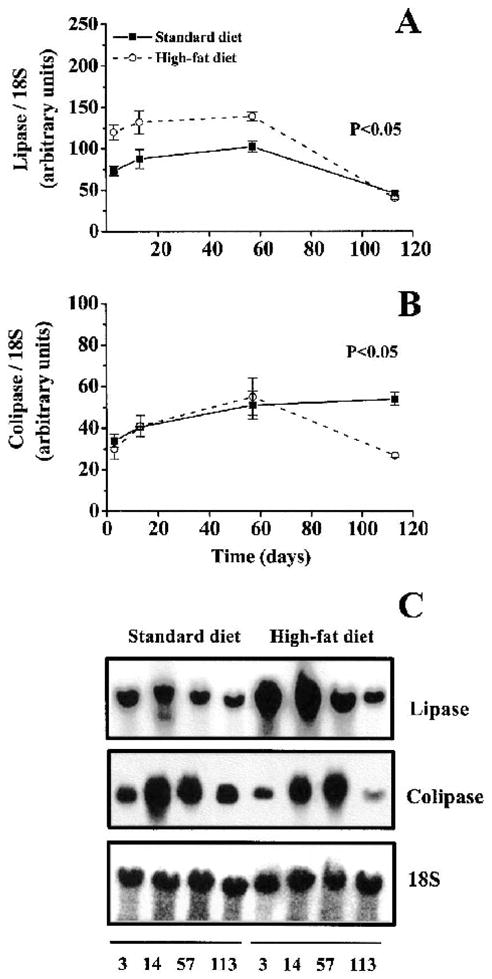
mRNA expression of lipase (A) and colipase (B) after long-term high-fat feeding. C: A representative Northern blot. Northern blots using total RNA from pancreas tissue were hybridized with probes for lipase and colipase and expressed in relation to 18S rRNA. Values are expressed as means ± SEM (n = 6).
To determine whether the change in mRNA levels corresponded to a change in protein level, we analyzed lipase protein levels in pancreatic extracts by protein immunoblotting. Lipase protein levels increased after high-fat feeding on days 3 and 57. On day 113, the lipase protein levels decreased for both the high-fat and standard-fed mice (Fig. 4).
FIG. 4.
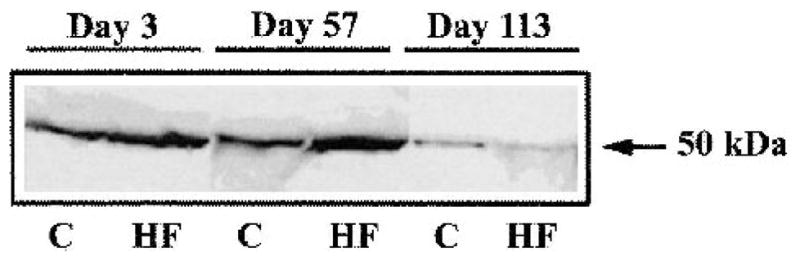
Western blot, showing the lipase protein content from a representative pair of animals at each time point. 10 μg total protein from pancreatic homogenate was applied on a SDS-PAGE. A Western blot was conducted, lipase was detected with antibodies, and the blot was visualized by chemoluminescence. C, control mice fed a standard diet; HF, mice fed a high-fat diet. The data from a pair of animals is shown at each time point.
The mRNA levels for pancreatic lipase-related proteins 1 and 2 (PLRP1 and PLRP2) were higher in the beginning of the experiment and declined with time (Fig. 5). There was a significant difference between the two diets for PLRP1 (p < 0.01, n = 6 at each time point)(Fig. 5); PLRP1 decreased with high-fat feeding (Fig. 5A). There was no statistical difference between the high-fat and standard diet for the expression of PLRP 2.
FIG. 5.
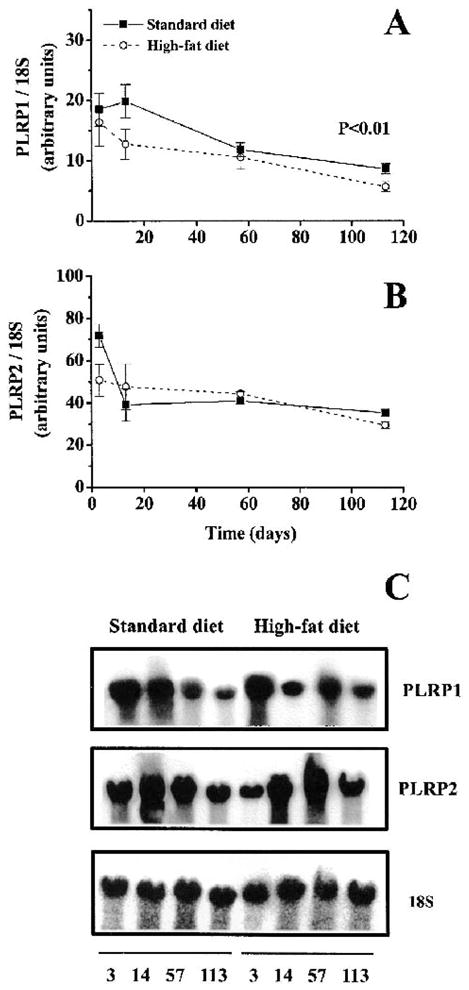
Expression of PLRP1 (A) and PLRP2 (B) mRNA in response to long-term high-fat feeding and a representative Northern blot (C). Total RNA was analyzed on Northern-blot and hybridized with probes for PLRP1 and PLRP2. Values are expressed as arbitrary units in relation to 18S rRNA. A: A significant decrease in PLRP1 mRNA expression was observed after high-fat feeding (two-way ANOVA, p < 0.01). B: There was no significant difference in PLRP2 mRNA expression between high-fat–fed or standard-fed mice. Values are expressed as means ± SEM (n = 6).
Uncoupling protein mRNA expression
UCP1 mRNA expression increased significantly for the mice fed the high-fat diet (p < 0.001)(Fig. 6A). A Bonferroni corrected t test showed a significant difference between high-fat– and standard-fed mice at day 57 (p = 0.003, n = 6 at each time point) and day 113 (p = 0.003, n = 6 at each time point). The mice fed the standard diet had a similar UCP1 expression throughout the experiment (Fig. 6A).
FIG. 6.
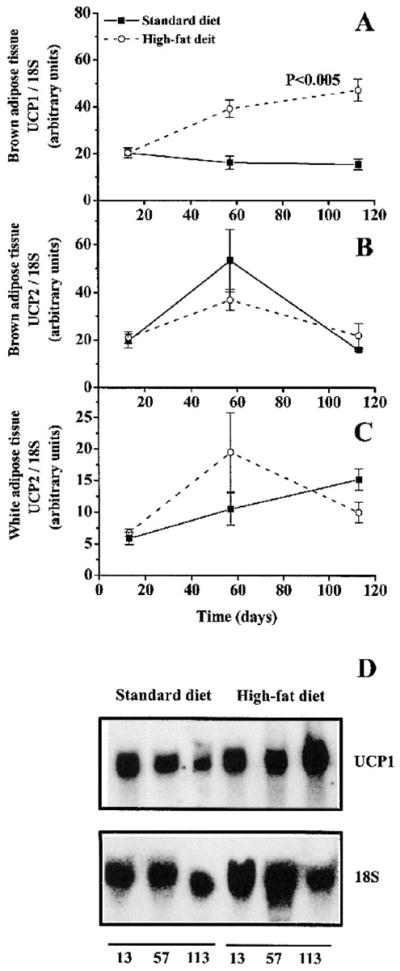
Effect of a high-fat diet on mRNA expression of uncoupling proteins (UCP1 and UCP2) in brown and white adipose tissue. Total cellular RNA was extracted from brown and white adipose tissue, examined by Northern-blot hybridization, and expressed in relation to 18S rRNA. A: UCP1 mRNA expression was increased on days 57 and 113 (p < 0.005). B: In brown adipose tissue, there was no significant change in the mRNA expression of UCP2 between high-fat–fed and standard-fed mice. C: No significant difference in UCP2 was found between high-fat–fed and standard-fed animals in white adipose tissue. Values are expressed as means ± SEM (n = 6). D: A representative Northern blot for UCP1 and the corresponding 18S signal.
There was no difference in UCP2 mRNA expression between mice fed the high-fat and standard diet in either brown adipose tissue (p > 0.05, n = 6 at each time point) (Fig. 6B) or in white adipose tissue (p > 0.05, n = 6 at each time point) (Fig. 6C).
DISCUSSION
In this report we show, for the first time, that long-term high-fat feeding causes obesity and glucose intolerance with concomitant decreases in pancreatic lipase and colipase mRNA levels in NMRI mice. Previous studies have shown that NMRI mice are sensitive to long-term high-fat feeding, developing both obesity and insulin resistance (23). Our study distinguishes three phases of adaptation during high-fat feeding, as interpreted by the body weight of the animals. A first phase (days 3–13), with growing healthy animals, a second phase (days 13–57), with healthy animals reaching their adult body weight, and a third phase (days 57–113), when the high-fat–fed animals became obese and glucose-intolerant.
During the first phase, the high-fat–fed mice grew faster and acquired larger fat pads compared with the mice fed the standard diet (Fig. 1). There was no difference between high-fat–fed and standard-fed mice in the expression of UCP1 and 2 at day 13 (no data were obtained at day 3), indicating that a short period of high-fat feeding failed to stimulate diet-induced thermogenesis (Fig. 6). These mice had an increased expression of lipase mRNA and lipase protein, which suggests a transcriptional control of lipase expression by dietary fat (Fig. 3 and 4). In contrast, mRNA encoding colipase was unchanged during this first phase (Fig. 3). Further, no difference was observed in the expression of mRNA encoding PLRP2 with a high-fat diet (Fig. 5). The amount of mRNA encoding PLRP1 was lower in high-fat–fed mice during this first phase, suggesting that PLRP1 may not be involved in dietary fat digestion (Fig. 5). However, PLRP1 has been shown to compete with lipase for colipase, and a decrease in PLRP1 would hence increase the lipolytic activity of pancreatic lipase.
The increased lipase mRNA and protein expression for the high-fat–fed mice during the first phase is consistent with earlier studies conducted over shorter periods in rats (8–10). Although the increase in pancreatic lipase expression could be viewed as an attempt to increase the lipolytic capacity of the pancreatic secretions during high-fat feeding, the lack of change in colipase mRNA argues against this possibility. The colipase/lipase ratio in rat and mouse pancreatic homogenate is 0.5 (7). Since lipase and colipase form a 1:1 molar ratio during triacylglycerol hydrolysis, colipase expression is the rate-limiting factor for fat digestion.
During the second phase (days 13–57), both groups of mice reached their adult body weight, and we observed increased UCP1 mRNA expression in the mice fed a high-fat diet, which could explain the preserved glucose tolerance and body weight in spite of the high-fat diet. Interestingly, UCP1 mRNA increased concomitant with an arrest in body weight gain, which supports a role for UCP1 in diet-induced thermogenesis, a finding in agreement with earlier reports (17). The elevated lipase mRNA and protein levels persisted during this period. Further, there was still no change in colipase mRNA levels in the high-fat–fed animals. The response of colipase to a high-fat diet is controversial. Some authors reported an increase in colipase resulting from a high-fat diet (26,27), and others reported no change (10,28, 29). In these studies, colipase expression was found to increase in response to a diet with a higher protein content (10,28). Colipase expression has also been shown to be sensitive to surrounding temperature, being maximally expressed at 5°C (19,30). Clearly, the genes encoding lipase and colipase are not coordinately regulated since they respond differently to high-fat diets, dietary protein, and temperature.
During the third phase (days 57–113), the mice fed the high-fat diet became obese and glucose-intolerant. Consistent with previous reports, the levels of UCP1 mRNA continued to rise (18,19). The additional increase in UCP1 expression did not prevent weight gain and glucose intolerance, which is in agreement with Margareto et al. (31). In contrast to UCP1, the mRNA expression of UCP2 was not changed during high-fat feeding in either brown or white adipose tissue (Fig. 6B and C). A large variability was seen at day 57, which could be related to an individual variation in the regulation of the UCP2 gene expression. It has been shown in previous studies that obesity-prone animals do not increase their UCP2 mRNA expression in WAT, whereas obesity-resistant animals are able to increase the UCP2 mRNA transcript (18,20). A lack in UCP2 upregulation has also been shown in previous studies (31,32). However, Pecqueur et al. have shown that the mRNA expression of UCP2 is not necessarily correlated with protein expression and that the UCP2 protein could not be detected in brown adipose tissue, which leads us to question the importance of UCP2 expression in BAT (33).
Interestingly, high-fat feeding decreased both lipase and colipase mRNA during the third phase. Lipase mRNA levels decreased to the level of lipase mRNA in standard-fed mice. Colipase mRNA levels decreased by 50% compared with control. A decreased expression of lipase and colipase during long-term high-fat feeding has not been observed previously and may serve a protective role for the animal. This decrease coincided with the development of impaired glucose tolerance (Fig. 2). A recent study showed that co-lipase-deficient mice had normal glucose levels after 3 months of high-fat diet, whereas the wild-type mice had increased blood glucose levels (5). The colipase-deficient mice also had an increased amount of fat in feces—26% compared with 3.6% in wild-type animals—suggesting a critical role of colipase in fat digestion. One interpretation from our study is that impaired fat digestion may be protective against obesity and glucose intolerance. The decrease of colipase and lipase after long-term high-fat feeding may decrease the rate of lipolysis. This could work as a defense mechanism to limit the development of glucose intolerance and obesity. Further studies are needed to evaluate if lowered colipase and lipase levels have a protective effect against obesity and glucose intolerance.
The decrease in lipase mRNA and protein levels that we observed in high-fat–fed and standard-fed mice at the end of the experiment could be an age-related phenomenon, since there is a reduction in lipase secretion in older humans (11,34). In addition, Greenberg and Holt found that feeding old rats a high-fat diet (72% fat) for 7 days resulted in no change in lipase expression, in contrast to young rats where lipase expression increased (35).
In conclusion, we found that high-fat feeding for a shorter period increases the expression of lipase mRNA, indicating an adaptation of the animal to the increased fat load to ensure fat digestion. We also observed that increased UCP1 mRNA expression ensured energy balance. However, after prolonged exposure to a high-fat diet, the mechanisms involved in the regulation of fat digestion and energy balance become disrupted. After 4 months of high-fat feeding, the animals became obese and glucose-intolerant, despite an increased UCP1 expression. At the same time, both lipase and colipase mRNA expression decreased, suggesting a blunted fat digestion. This could be interpreted as either a defense mechanism to arrest further development of obesity and glucose intolerance or as an arrest in the overall regulation of lipid homeostasis.
Acknowledgments
The authors thank Ulf Strömberg (Occupational and Environmental Medicine, University of Lund, Sweden) for his help with the statistical analyses and Professor Daniel Ricquier (Center National de la Recherche Scientifique, Meudon, France) for supplying probes for the uncoupling proteins. This study was supported by the Swedish Research Council (K2001-03X-07904-15A), A. Påhlssons Foundation, Crafoord Foundation and the Royal Physiographic Society.
References
- 1.Lowe ME. Pancreatic triglyceride lipase and colipase: insights into dietary fat digestion. Gastroenterology. 1994;107:1524–36. doi: 10.1016/0016-5085(94)90559-2. [DOI] [PubMed] [Google Scholar]
- 2.Erlanson-Albertsson C. The interaction between pancreatic lipase and colipase: a protein–protein interaction regulated by a lipid. FEBS Lett. 1983;162:225–9. doi: 10.1016/0014-5793(83)80760-1. [DOI] [PubMed] [Google Scholar]
- 3.Figarella C, De Caro A, Leupold D, et al. Congenital pancreatic lipase deficiency. J Pediatr. 1980;96:412–16. doi: 10.1016/s0022-3476(80)80683-4. [DOI] [PubMed] [Google Scholar]
- 4.Hildebrand H, Borgstrom B, Bekassy A, et al. Isolated co-lipase deficiency in two brothers. Gut. 1982;23:243–6. doi: 10.1136/gut.23.3.243. [DOI] [PMC free article] [PubMed] [Google Scholar]
- 5.D’Agostino D, Cordle RA, Kullman J, et al. Decreased postnatal survival and altered body weight regulation in procolipase-deficient mice. J Biol Chem. 2002;277:7170–7. doi: 10.1074/jbc.M108328200. [DOI] [PMC free article] [PubMed] [Google Scholar]
- 6.Erlanson-Albertsson C, York D. Enterostatin–a peptide regulating fat intake. Obes Res. 1997;5:360–72. doi: 10.1002/j.1550-8528.1997.tb00565.x. [DOI] [PubMed] [Google Scholar]
- 7.Rippe C, Erlanson–Albertsson C. Identification of enterostatin and the relationship between lipase and colipase in various species. Nutr Neurosci. 1998;1:111–7. doi: 10.1080/1028415X.1998.11747220. [DOI] [PubMed] [Google Scholar]
- 8.Sabb JE, Godfrey PM, Brannon PM. Adaptive response of rat pancreatic lipase to dietary fat: effects of amount and type of fat. J Nutr. 1986;116:892–9. doi: 10.1093/jn/116.5.892. [DOI] [PubMed] [Google Scholar]
- 9.Wicker C, Puigserver A. Effects of inverse changes in dietary lipid and carbohydrate on the synthesis of some pancreatic secretory proteins. Eur J Biochem. 1987;162:25–30. doi: 10.1111/j.1432-1033.1987.tb10536.x. [DOI] [PubMed] [Google Scholar]
- 10.Ouagued M, Saraux B, Girard-Globa A, et al. Differential regulation of lipase and colipase in the rat pancreas by dietary fat and proteins. J Nutr. 1980;110:2302–9. doi: 10.1093/jn/110.11.2302. [DOI] [PubMed] [Google Scholar]
- 11.Vellas BJ, Balas D, Lafont C, et al. Adaptive response of pancreatic and intestinal function to nutritional intake in the aged. J Am Geriatr Soc. 1990;38:254–8. doi: 10.1111/j.1532-5415.1990.tb03499.x. [DOI] [PubMed] [Google Scholar]
- 12.Giller T, Buchwald P, Blum-Kaelin D, et al. Two novel human pancreatic lipase related proteins, hPLRP1 and hPLRP2: differences in colipase dependence and in lipase activity. J Biol Chem. 1992;267:16509–16. [PubMed] [Google Scholar]
- 13.Jennens ML, Lowe ME. Rat GP–3 is a pancreatic lipase with kinetic properties that differ from colipase-dependent pancreatic lipase. J Lipid Res. 1995;36:2374–82. [PubMed] [Google Scholar]
- 14.Lowe ME, Kaplan MH, Jackson–Grusby L, et al. Decreased neonatal dietary fat absorption and T cell cytotoxicity in pancreatic lipase—related protein 2—deficient mice. J Biol Chem. 1998;273:31215–21. doi: 10.1074/jbc.273.47.31215. [DOI] [PMC free article] [PubMed] [Google Scholar]
- 15.Payne RM, Sims HF, Jennens ML, et al. Rat pancreatic lipase and two related proteins: enzymatic properties and mRNA expression during development. Am J Physiol. 1994;266:G914–21. doi: 10.1152/ajpgi.1994.266.5.G914. [DOI] [PMC free article] [PubMed] [Google Scholar]
- 16.Nicholls DG, Locke RM. Thermogenic mechanisms in brown fat. Physiol Rev. 1984;64:1–64. doi: 10.1152/physrev.1984.64.1.1. [DOI] [PubMed] [Google Scholar]
- 17.Falcou R, Bouillaud F, Mory G, et al. Increase of uncoupling protein and its mRNA in brown adipose tissue of rats fed on ‘cafeteria diet’. Biochem J. 1985;231:241–4. doi: 10.1042/bj2310241. [DOI] [PMC free article] [PubMed] [Google Scholar]
- 18.Surwit RS, Wang S, Petro AE, et al. Diet—induced changes in uncoupling proteins in obesity—prone and obesity—resistant strains of mice. Proc Natl Acad Sci U S A. 1998;95:4061–5. doi: 10.1073/pnas.95.7.4061. [DOI] [PMC free article] [PubMed] [Google Scholar]
- 19.Rippe C, Berger K, Boiers C, et al. Effect of high—fat diet, surrounding temperature, and enterostatin on uncoupling protein gene expression. Am J Physiol Endocrinol Metab. 2000;279:E293–300. doi: 10.1152/ajpendo.2000.279.2.E293. [DOI] [PubMed] [Google Scholar]
- 20.Fleury C, Neverova M, Collins S, et al. Uncoupling protein-2: a novel gene linked to obesity and hyperinsulinemia. Nat Genet. 1997;15:269–72. doi: 10.1038/ng0397-269. [DOI] [PubMed] [Google Scholar]
- 21.Arsenijevic D, Onuma H, Pecqueur C, et al. Disruption of the uncoupling protein-2 gene in mice reveals a role in immunity and reactive oxygen species production. Nat Genet. 2000;26:435–9. doi: 10.1038/82565. [DOI] [PubMed] [Google Scholar]
- 22.Matthias A, Ohlson KB, Fredriksson JM, et al. Thermogenic responses in brown fat cells are fully UCP1—dependent. UCP2 or UCP3 do not substitute for UCP1 in adrenergically or fatty acid—induced thermogenesis. J Biol Chem. 2000;275:25073–81. doi: 10.1074/jbc.M000547200. [DOI] [PubMed] [Google Scholar]
- 23.Hedeskov CJ, Capito K, Islin H, et al. Long-term fat-feeding-induced insulin resistance in normal NMRI mice: postreceptor changes of liver, muscle and adipose tissue metabolism resembling those of type 2 diabetes. Acta Diabetol. 1992;29:14–19. doi: 10.1007/BF00572823. [DOI] [PubMed] [Google Scholar]
- 24.Chomczynski P, Sacchi N. Single—step method of RNA isolation by acid guanidinium thiocyanate—phenol—chloroform extraction. Anal Biochem. 1987;162:156–9. doi: 10.1006/abio.1987.9999. [DOI] [PubMed] [Google Scholar]
- 25.Altman DG. Practical Statistics for Medical Research. London: Chapman & Hall; 1991. [Google Scholar]
- 26.Okada S, York DA, Bray GA. Procolipase mRNA: tissue localization and effects of diet and adrenalectomy. Biochem J. 1993;292:787–9. doi: 10.1042/bj2920787. [DOI] [PMC free article] [PubMed] [Google Scholar]
- 27.Wicker C, Puigserver A. Rat pancreatic colipase mRNA: nucleotide sequence of a cDNA clone and nutritional regulation by a lipidic diet. Biochem Biophys Res Commun. 1990;167:130–6. doi: 10.1016/0006-291x(90)91740-j. [DOI] [PubMed] [Google Scholar]
- 28.Saraux B, Girard—Globa A, Ouagued M, et al. Response of the exocrine pancreas to quantitative and qualitative variations in dietary lipids. Am J Physiol. 1982;243:G10–15. doi: 10.1152/ajpgi.1982.243.1.G10. [DOI] [PubMed] [Google Scholar]
- 29.Vandermeers—Piret MC, Vandermeers A, Wijns W, et al. Lack of adaptation of pancreatic colipase in rats and mice. Am J Physiol. 1977;232:E131–5. doi: 10.1152/ajpendo.1977.232.2.E131. [DOI] [PubMed] [Google Scholar]
- 30.Girard—Globa A, Bourdel G. Pancreatic hydrolases in cold-induced hyperphagia of rats fed a low or high-fat diet. Reprod Nutr Dev. 1983;23:137–43. doi: 10.1051/rnd:19830112. [DOI] [PubMed] [Google Scholar]
- 31.Margareto J, Larrarte E, Marti A, et al. Up-regulation of a thermogenesis-related gene (UCP1) and down-regulation of PPARgamma and aP2 genes in adipose tissue: possible features of the antiobesity effects of a beta3-adrenergic agonist. Biochem Pharmacol. 2001;61:1471–8. doi: 10.1016/s0006-2952(01)00562-7. [DOI] [PubMed] [Google Scholar]
- 32.Matsuda J, Hosoda K, Itoh H, et al. Cloning of rat uncoupling protein-3 and uncoupling protein-2 cDNAs: their gene expression in rats fed high-fat diet. FEBS Lett. 1997;418:200–4. doi: 10.1016/s0014-5793(97)01381-1. [DOI] [PubMed] [Google Scholar]
- 33.Pecqueur C, Alves-Guerra MC, Gelly C, et al. Uncoupling protein 2, in vivo distribution, induction upon oxidative stress, and evidence for translational regulation. J Biol Chem. 2001;276:8705–12. doi: 10.1074/jbc.M006938200. [DOI] [PubMed] [Google Scholar]
- 34.Meyer J, Necheles H. The clinical significance of salivary, gastric and pancreatic secretion in the aged. JAMA. 1940;115:2050–5. [Google Scholar]
- 35.Greenberg RE, Holt PR. Influence of aging upon pancreatic digestive enzymes. Dig Dis Sci. 1986;31:970–7. doi: 10.1007/BF01303218. [DOI] [PubMed] [Google Scholar]