Abstract
The MISCAN-lung model was designed to simulate population trends in lung cancer (LC) for comprehensive surveillance of the disease, to relate past exposure to risk factors to (observed) LC incidence and mortality, and to estimate the impact of cancer-control interventions. MISCAN-lung employs the technique of stochastic micro-simulation of life histories affected by risk factors. It includes the two-stage clonal expansion model for carcinogenesis and a detailed LC progression model; the latter is specifically intended for the evaluation of screenings. This paper elucidates further the principles of MISCAN-lung and describes its application to a comparative study within the CISNET Lung Working Group on the impact of tobacco control on U.S. LC mortality. MISCAN-lung yields an estimate of the number of LC deaths avoided during 1975–2000. The potential number of avoidable LC deaths, had everybody quit smoking in 1965, is 2.2 million. 750,000 deaths (30%) were avoided in the U.S. due to actual tobacco control interventions. The model fits in the actual tobacco-control scenario, providing credibility to the estimates of other scenarios, although considering survey-reported smoking trends alone has limitations.
Keywords: lung cancer, evaluating cancer control interventions
1. INTRODUCTION
The MISCAN-lung model is an extension of the MISCAN simulation software package, described elsewhere(1,2), which was developed to analyze the effects of cancer screening. Initially used for cervical and breast cancer screening(3,4), MISCAN was also successfully applied to colorectal and prostate cancer (5,6). The presence of an added risk-factor component distinguishes MISCAN-lung from the older MISCAN versions. The risk-factor component takes into account the fact that exposure of a person to one or more risk factors for some period during his lifetime will (dose-dependently) increase parameters for risk of carcinogenesis and mortality compared to a non-exposed person. This risk-factor component is very important when modeling lung cancer (LC). Exposure to tobacco smoke (active smoking) is by far the most important risk factor for cancer of the lung and bronchi. Less prominent risk factors include passive smoking, exposure to radon gas or asbestos fibers, and diet.
The MISCAN-lung model is intended to simulate population trends in LC for comprehensive surveillance of the disease. Primarily, observed trends in incidence and mortality can be investigated in relation to (earlier) exposure to risk factors, in particular smoking. The influence of screening and therapy on (future) trends can also be investigated with the MISCAN-lung model. This allows the impact of cancer-control interventions to be estimated. The effects of different intervention scenarios can be compared in terms of population trends and health outcomes, including life years lost due to LC.
Thanks to those characteristics MISCAN-lung is a very suitable model to serve the purposes of the CISNET-lung Project. One purpose is to investigate LC in the U.S. in relation to tobacco control. Another purpose is to investigate the effectiveness of screening by CT technology for early detection of LC. The present study deals with the former purpose. It primarily contributes to an evaluation of the various modeling approaches as used within the CISNET Lung Working Group.
Employing MISCAN-lung, large male and female populations are modeled through micro-simulation of life histories built with Monte Carlo techniques (random selection from distribution functions). Input data are based on information on demography (census data, births registry) and tobacco consumption (smoke exposure characteristics) in the U.S. Carcinogenesis is based on the two-stage clonal expansion (TSCE) model(7, 8) but progression through preclinical and clinical cancer stages is modeled in more detail with an additional multi-compartment structure.
Other groups that applied micro-simulation and the TSCE model to common input-population and tobacco-consumption data often use parameter values obtained from calibration to different data sources. For instance, to estimate the basic rates for carcinogenesis in the TSCE model, some use the data from the American Cancer Society Cancer Prevention Studies I and II (CPS-I and CPS-II) cohorts (9). MISCAN-lung uses data from the Nurses’ Health Study (NHS) and Health Professionals’ Follow-up Study (HPFS)(10) because of the longitudinal reporting of exposure to risk factors for those cohorts. The corresponding TSCE parameter values were supplied by scientists from Fred Hutchinson Cancer Research Center.
Within the CISNET-lung Project, the Smoking Base Case (SBC) effort is meant to answer the following question: What impact did smoking have on U.S. LC incidence and mortality in the period 1975–2000 for males and females aged 30 through 84? More specifically, what did the U.S. anti-smoking campaigns achieve in terms of LC mortality reduction, and what could potentially have been achieved if everyone had stopped smoking in 1965? Three scenarios are compared: 1). actual tobacco control (ATC) as did actually occur; 2). counterfactual no tobacco control (NTC) as if smoking habits had simply continued just as before the campaigns; and 3). counterfactual complete tobacco control (CTC) as if everyone had stopped smoking after 1965. The percentage of LC deaths attributable to smoking is also of interest.
MISCAN-lung is one of the models of which the results are to be compared with those of models by independent partners in the project. To facilitate such a comparison, the various models were also applied to more simple hypothetical cases (Table I) to calculate LC incidence and mortality for male persons born in 1921.
Table I.
Overview of hypothetical cases to be simulated.
| Case | Start smoking at age (y) | Quit smoking at age (y) | Smoking intensity (cpd) |
|---|---|---|---|
| H1 | 14 | 35 | 20 |
| H2 | 14 | never | 20 |
| H3 | 25 | 35 | 20 |
| H4 | 25 | never | 20 |
| H5 | 25 | 35 | 10 |
| H6 | 25 | 35 | 40 |
| H7 | never | never | 0 |
persons born in 1921; cpd = cigarettes per day
2. METHODS
Detailed information on the MISCAN-lung model and its parameters can be found in the Model Profile (11). The principal model characteristics and inputs for its application in the present SBC study are described below.
2.1. Approach/Model
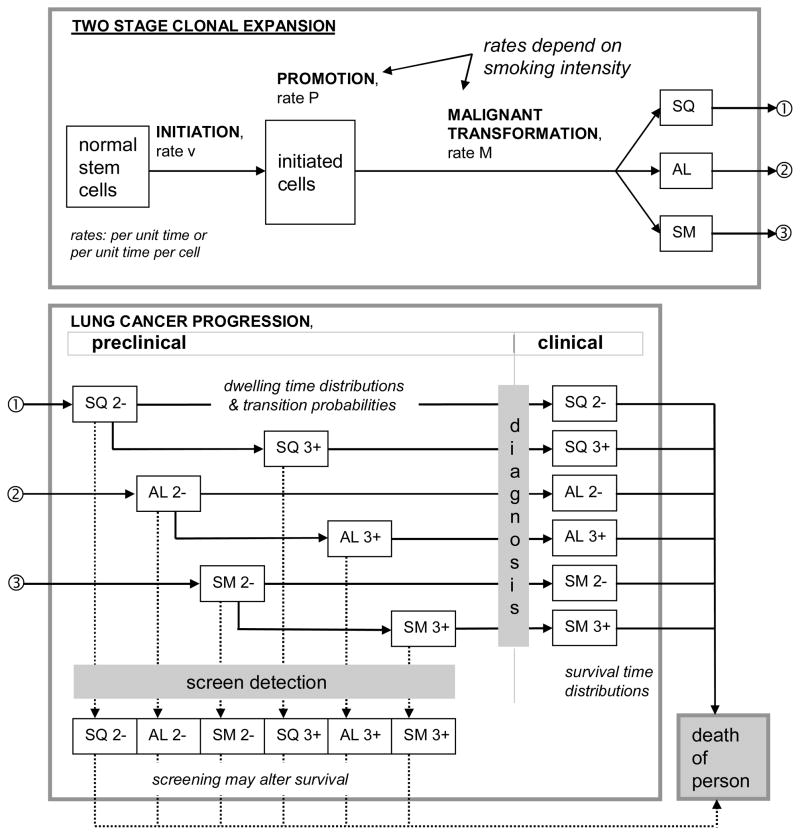
In MISCAN-lung the technique of micro-simulation of individual life histories is applied to constitute a population in which LCs may appear. The life histories are constructed stochastically (Monte Carlo simulation) by drawing events and development rates from probability distributions that describe the relevant characteristics of the population. A life history starts with a birth date and assigning gender/ethnicity. Age of death from causes other than LC (DfOC) is determined, e.g. from a life table without this specific disease. For the lung model, however, DfOC is determined by the smoke generator and it does depend considerably on smoking history. Then the birth cohort and gender/ethnicity-dependent smoking history is generated, i.e. starting age, stopping age and different levels of smoking intensity between those time points. Corresponding age (and possibly gender/ethnicity)-specific risk factors are applied to modify the initiation, hazard, promotion and malignant-transformation rates in the multistage carcinogenesis model (Fig. 1). As a result, a malignant nodule may appear which, after progression to clinically diagnosed LC and without intervention, leads to LC death unless DfOC occurs sooner. More than one malignant nodule may be formed during a life history.
Figure 1.
In the MISCAN-lung model carcinogenesis is a process of two stage clonal expansion influenced by risk factor “smoking” and resulting in the creation of malignant nodules of three histological cell types: squamous cell (SQ), adeno or large cell (AL), and small cell (SM) carcinoma. By random selection from cell type specific transition probabilities, dwelling time and survival time distributions, nodules progress through preclinical to clinical (diagnosed) states and on to lung cancer death, unless the person dies from other causes first (birth cohort and smoking history dependent probability). Early (2−) and late (3+) stage cancer are distinguished. Screen detection –not considered in the present study– may occur in preclinical states, with consequences being modeled as changes in survival time.
The concept of multistage carcinogenesis provides a possible explanation of the long duration from exposure to expression. Carcinogenesis proceeds through at least the stages of initiation, promotion, malignant transformation and progression. Initiation is the process in which a single somatic cell undergoes non-lethal, but heritable, mutation. The initiated cell can escape cellular regulatory mechanisms. Promotion is the process in which the initiated cell is exposed to a tumor promoter that causes phenotypical clonal expansion. Tumor promoters are either external or internal stimuli and stimulate growth of initiated cells. During malignant transformation, cellular growth is further deregulated. Like initiation, this step requires genetic alteration. During the stage of progression cellular growth is further deregulated and proceeds uncontrolled. Progression is probably the most complex stage, because both acquired genetic and phenotypic alterations occur, and cellular expansion is rapid.
The first quantitative mechanistic model concerning carcinogenesis was published by Armitage and Doll in 1954 (12). The more recent TSCE model, also known as the Moolgavkar-Venzon-Knudson (MVK) model, is intended as a more precise implementation of knowledge of carcinogenesis (7,8,13). This model summarizes the promotion stage in a single step and corresponds closely with observed epidemiological evidence. It has been validated for smoking and LC(9). However, current versions of the TSCE model do not explain the progression stage in much detail. A lag time, or lag time (gamma) distribution, is defined to represent time from first occurrence of a malignant cell until LC death. This stage is particularly important for evaluation of early detection of (lung) cancer. In MISCAN-lung an adapted version of the TSCE model is used, but progression is simulated more elaborately with a natural history model for LC (Fig. 1).
The adaptation of the TSCE model for micro-simulation in MISCAN-lung concerns the very early stage. The TSCE model assumes that after initiation of a stem cell there is a stochastic process where an initiated cell can form an additional initiated cell, differentiate, or die. The vast majority of initiations do not lead to the cloning of initiated cells and the chance of malignant transformation is very small. This implies that a micro-simulation model would need to simulate many initiations that would only die out after a limited period of time, adding a lot of computing time with no effect on risk projections. The adapted model, therefore, only simulates initiations that grow out to a clone of initiated cells, large enough to have surpassed the stage in which stochastic death or differentiation of individual cells can lead to the end of the whole clone.
In the absence of exposure to risk factors, base rates of initiation, promotion, malignant transformation and progression are valid. The base rates should be modified when exposure occurs. In MISCAN-lung, exposure to any risk factor is subdivided into a number of intensity levels. At discrete time points during a life history a transition may take place from one intensity level to another. An adjustment factor (>1) is specified for each level and for each rate. Base rate values will be multiplied by those factors (rate ratios) to account for the risk increase corresponding to the current level of exposure.
Computations are carried out as follows. The life history is split up into segments during which the exposure to all risk factors is constant at a certain intensity level. (NB. In the present study there is only one risk factor, i.e. smoking, but to make MISCAN-lung more general, a variety of risk factors, e.g. smoking and diet, can be used simultaneously.) The rate of creation of new clones of initiated cells is constant during each segment. A new clone consists of a specified number of cells. Starting from this initial size, the clone grows exponentially. Let the current clone size be C. The time to malignant transformation is determined iteratively. Let the proliferation rate of the clone of initiated cells, given current exposure to risk factors, be P; and the malignant transformation rate per initiated cell be M. U is drawn from the standard uniform distribution. It is determined if the subsequent period of time is shorter than the length L of the current segment of constant exposure to risk factors:
| [1] |
If so, the time of malignant transformation is reached and the phase of progression begins; if not, the clone size is updated to the value at the end of the current segment of constant exposure to risk factors:
| [2] |
The iterations are repeated for subsequent segments of constant exposure to risk factors until the moment of malignant transformation or the maximum life span is reached. The rates are adjusted, i.e. base rate values are multiplied by the appropriate rate ratios, when a new constant exposure segment begins.
Progression is described with transition probabilities in a multi-compartment model representing consecutive preclinical and clinical disease states. Three LC cell types are distinguished: squamous cell carcinoma (sq), adenocarcinoma and large cell carcinoma combined (al), and small cell carcinoma (sm). Adenocarcinoma and large cell carcinoma were combined due to the consideration that there is some likelihood that adenocarcinoma transforms into the large cell type during the progression phase. A malignant nodule is placed in a preclinical sq, al or sm compartment according to transition probabilities derived from clinically observed incidence. Clinical AJCC stage classifications I, II, III or IV are reduced to 2− (I + II) and 3+ (III + IV) in the model. After a cell type-specific fixed time period, the nodule becomes preclinical screen-detectable state 2− with dwelling time following an exponential distribution. Then, it moves on to either the clinical 2− state or, via the preclinical 3+ state with another exponential distributed duration, to the clinical 3+ state. Remaining survival in the clinical states until death by LC and the parameters of the distribution functions are obtained by calibrating to the results of appropriate clinical studies.
Relevant data on smoking habits in the U.S. population were collected and processed by NCI staff to produce the Smoking History Generator (SHG) application for the CISNET-lung Project(14). This yields information on the observed ages of starting and quitting smoking, smoking intensity and probability of DfOC, depending on race, gender and year of birth. MISCAN-lung uses this information to assign a starting point and duration of smoking, as well as smoking intensity levels, to a simulated life history. The level of exposure varies during the course of the smoking history. This drives the risk of carcinogenesis by affecting the base rate parameters as explained above.
Separate simulation runs were executed for each gender. Furthermore, each scenario (ATC, NTC, CTC and hypothetical) was evaluated as a separate series of runs. To minimize random noise due to stochastic simulation, one hundred million individuals were simulated per run (5 million for the hypothetical cases).
The output used for the present study consists of the LC incidence and mortality counts, and the population size, by age and by calendar year, for never smokers, current smokers, former smokers and total. From this output, rates can be computed (e.g. number of deaths / population size for males, current smokers aged 48 y in 1976). Applying the calculated rates to the corresponding actual U.S. (sub)population yields the MISCAN-lung estimate of the quantity concerned in the U.S. (e.g. number of male deaths, current smokers aged 48 y in 1976).
In case of scenarios NTC and CTC, a correction must be made for the fact that there is no information on the “true” U.S. population, as it has and could have been counted only for the ATC scenario. Where for ATC, the estimated number of LC deaths equals
| [3] |
for NTC, the following computation was made (NB similar for CTC):
| [4] |
where the subscript denotes the scenario to which the simulated quantity refers.
Comparing corresponding numbers calculated for the different scenarios, the impact of tobacco control can be evaluated. The difference between the number of LC deaths under NTC and under ATC is the number of lives saved due to tobacco control. The difference between the number of LC deaths under NTC and under CTC is the number of lives that could have been saved.
2.2. Data
Data tables for the U.S. actual and NTC counterfactual populations, as provided with SHG version 5.2.1 of January 2009, form the base of the simulated individual smoking histories in the different scenarios. Data on smoking histories are presented in five types of data table (Table II). By sampling these tables MISCAN-lung creates the proper smoking histories and subsequently completes the life histories of the individual persons that are simulated.
Table II.
Data tables provided with the SHG application.
| By race (all races, whites) and gender (male, female) | |
| 1 smoking initiation | for 19 birth year bins (5 y), 1890–1894 through 1980–1984, probability of initiation by age (0–89 y) |
| 2 smoking cessation | for 19 birth year bins (5 y), 1890–1894 through 1980–1984, probability of cessation by age (0–100 y) |
| 3 type of smoker | probability to be in a smoking intensity class (1: light smoker – 5: heavy smoker) by age of initiation (12–30 y) |
| 4 cigarettes per day (cpd) | number of cpd for each of the five smoking intensity classes, by age (21–89 y) in each of the 19 birth year bins |
| 5 other cause mortality | by year of birth (1890–2000) and by age (0–99 y), probability to die from other causes for never smokers and for smokers in the five intensity classes |
To simulate smoking histories for the hypothetical cases the data tables provided with the SHG application were modified to make MISCAN-lung select correctly from the desired data ranges. For instance, to calculate a hypothetical case for which all persons start smoking at age 14 y and quit smoking at age 35 y, all probabilities in the corresponding SHG initiation table should be zero except for age 14 y (probability = 1) and all probabilities in the SHG cessation table should also be zero except for age 35 y (probability = 1). Likewise, all smoking intensities (light to heavy smoker) should be set to the same level if only a specific exposure of e.g. 20 cpd is considered. Then, the corresponding probabilities of DfOC must also be given the same value. Similar adaptations of the SHG data tables are necessary when simulating the counterfactual scenario of CTC for the U.S. population. As it is then assumed that nobody smoked from 1965 onwards, it is necessary to reset the start-smoking probabilities to zero in and after that year, to reset quit probability to one, and also to adjust the smoking levels and probabilities of DfOC to the new (non-)smoking status.
Base rate values of the parameters of the TSCE model for carcinogenesis were estimated by CISNET participants from the Fred Hutchinson Cancer Research Center (FHCRC)(10). They used likelihood-based methods to calibrate the TSCE model to incidence data from the NHS and HPFS trials conducted in the 1970s–80s. Initiation rates per normal stem cell were converted to rates of creation of clones of initiated cells for MISCAN-lung, assuming an average initial size of 80 (male) or 30 (female) cells per surviving clone. In the present study it is assumed that exposure to tobacco smoke will cause excess risk mainly through increased promotion and malignant transformation rates. Gender-specific multiplicative factors for exposure-dependent risk adjustment are specified for smoking levels in steps of five up to 40 cigarettes per day (cpd), and for more than 40 cpd (Table III). The numerical values are based on previous simulations of screening studies (see section Calibration and Validation below).
Table III.
Rate ratios for TSCE parameters by smoking intensity relative to when not smoking.
(E.g. the promotion rate for a man smoking 18 cpd is 1.4987 · 0.0973 = 0.1458 per year)
| Cigarettes per day | Males | Females | ||||
|---|---|---|---|---|---|---|
| Initiation | Promotion | Malignant transformation | Initiation | Promotion | Malignant transformation | |
| ≤ 5 | 1.0 | 1.1810 | 1.7804 | 1.0 | 1.2322 | 1.3026 |
| 6–10 | 1.0 | 1.3208 | 2.2976 | 1.0 | 1.4116 | 1.5031 |
| 11–15 | 1.0 | 1.4186 | 2.6437 | 1.0 | 1.5371 | 1.6373 |
| 16–20 | 1.0 | 1.4987 | 2.9206 | 1.0 | 1.6400 | 1.7446 |
| 21–25 | 1.0 | 1.5685 | 3.1575 | 1.0 | 1.7295 | 1.8365 |
| 26–30 | 1.0 | 1.6311 | 3.3675 | 1.0 | 1.8099 | 1.9179 |
| 31–35 | 1.0 | 1.6885 | 3.5578 | 1.0 | 1.8835 | 1.9917 |
| 36–40 | 1.0 | 1.7418 | 3.7329 | 1.0 | 1.9519 | 2.0596 |
| >40 | 1.0 | 1.8157 | 3.9735 | 1.0 | 2.0467 | 2.1528 |
| Base rates for non-smokers, per year (malignant transformation: per initiated cell per year) | ||||||
| 0 | 0.024 | 0.0973 | 7.58 · 10−8 | 0.036 | 0.0973 | 7.58 · 10−8 |
Transition probabilities and dwelling time parameters for the progression part of the model were obtained in previous Base Case analyses and from simulating screening studies (see section Calibration and Validation below).
Three additional sources of input data for MISCAN-lung concern the U.S. population. They are
Single age populations (0–84, 85+ y) by year for U.S. (1969–2002) and SEER9 (1973–2002) and by sex and race (white, black, other, all races);
Lung cancer mortality counts for U.S. population (U.S. and SEER9 data for whites and all races, by single age 0–84 y and 85+ y, and by year 1969–2005);
Number of births in the U.S., by year 1890–2004. Up to 1960 only whites and blacks are distinguished(15).
As agreed upon by CISNET partners, two sets of birth year ranges were used. One includes persons born between 1900 and 1970 while the other one is extended backwards to start in 1890. An empirical set (ec) of birth year cohorts (5 y bins) comprises those starting with birth year 1900. Using this set implies that the desired 30–84 y range of ages in the studied period 1975–2000 is not complete until 1985. During the early years the oldest age brackets (from 1975 up: 75–84 y, 76–84 y, etc.) are missing. This is not the case with the other set (all cohorts, ac), starting with birth year 1890, but the number of births during the backwards-extended period is not known precisely. This also holds for the smoking histories of those persons.
For age standardization of calculated LC rates, the 2000 U.S. Standard Population, Census P25-1130 – single ages was used, as published on the NCI-SEER website(16).
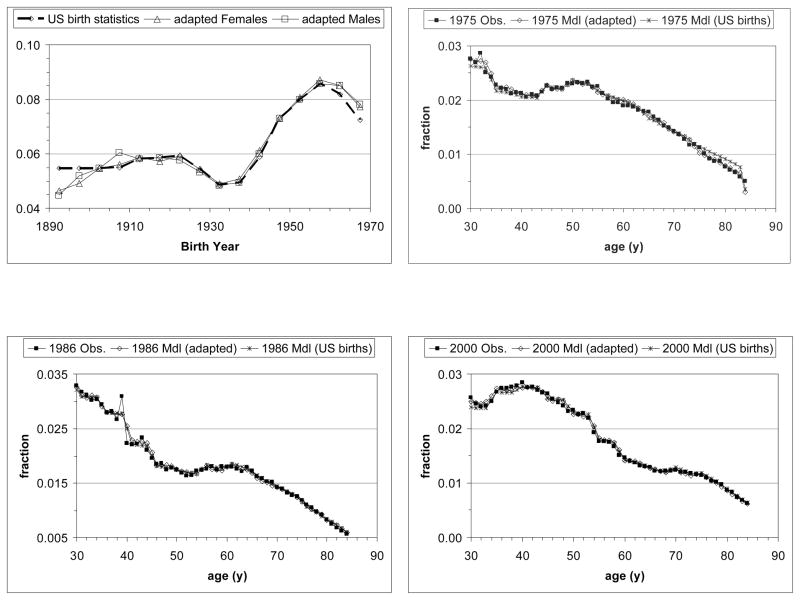
Due to migration, derivation of the U.S. population during the period of interest based on observed earlier U.S. births will be inaccurate. As the model does not explicitly simulate migration, births were distributed across the birth years in order to obtain age fractions by year during the period studied (1975–2000) that agree with observed fractions. Fig. 2 illustrates this for females, all races, ac set of birth year cohorts.
Figure 2.
Birth year distributions (U.S. birth statistics, original and adapted for males and females, serving as input for MISCAN-lung) and age distributions in the single years 1975, 1986 and 2000 (start, middle and end of studied period, respectively) for all races females. MISCAN-lung calculated age distributions for U.S. statistics and for the adapted birth year distributions. The latter conform better with observed age distributions, in particular in the year 1975.
2.3. Calibration and Validation
For its application to the present SBC study, MISCAN-lung was not calibrated to U.S. population LC mortality data. The model was calibrated before to other U.S. data, such as various common inputs in past Base Case analyses, including SEER LC incidence during a limited time period (1975–1979). Those Base Case inputs were in general well reproduced, except for older age groups (>70 y).
In the past, calibration and validation of the progression part of the model took place by simulation of screening in the Mayo Lung Project (MLP(17) – flat screen X-ray radiography) and Early Lung Cancer Action Project (ELCAP(18) – CT screening). An automatic fit procedure as in the MISCAN prostate cancer model(6) was applied to simultaneously adjust model parameters until best agreement with observed incidence data was reached. In general, the results were satisfactory.
3. RESULTS
3.1. Hypotheticals
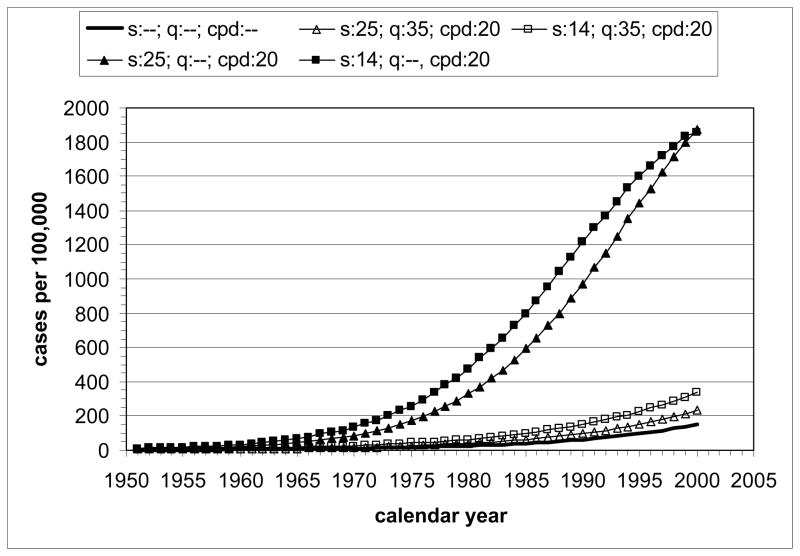
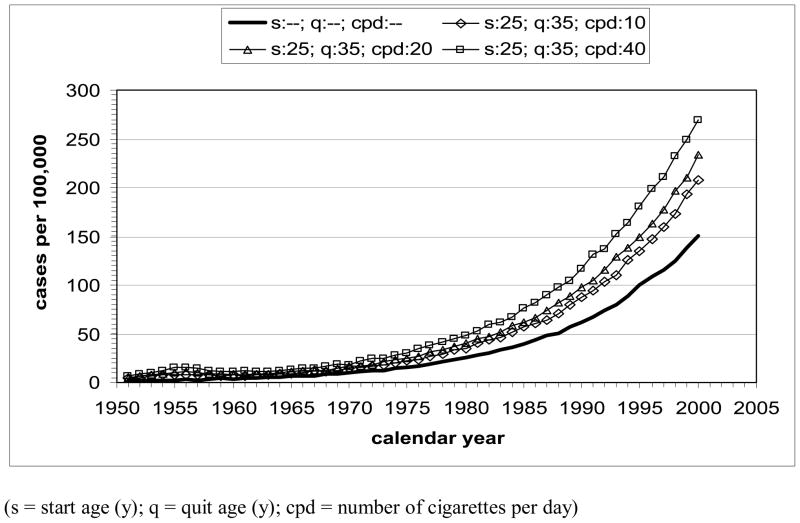
The model-estimated LC mortality rates by calendar year for the hypothetical scenarios (U.S. males, all races, born in 1921, various starting and stopping times and smoking intensities, including never smokers) are shown in Fig. 3. All curves show increasing LC rate with increase of calendar time, except for the presence of a small temporary decrease after 1956 due to reduced mortality in quitters at age 35 y. Qualitatively, the trends confirm expectations of lowest LC mortality rates for never smokers and, at equal smoking intensity, higher rates for longer exposure (with highest rates for the early starter, never quitter). Increasing the smoking intensity from 10 to 40 cpd at constant exposure time increases the LC mortality rate as a function of calendar time. For females, qualitatively similar results are obtained.
Figure 3.
Lung cancer mortality by calendar year for U.S. males, all races, born in 1921, calculated with MISCAN-lung. Hypothetical scenarios under actual tobacco control: A) Influence of start age and smoking duration at 20 cpd; B) Influence of smoking intensity for start age 25 y (1946) and quit age 35 y (1956). Bold curve represents never-smoker.
3.2. Calibration and Validation
A previous study revealed that the model agrees well with the SEER 1975–1979 LC incidence. A new calibration to U.S. LC mortality has not been performed for the present study.
3.3. Tobacco Control Scenarios
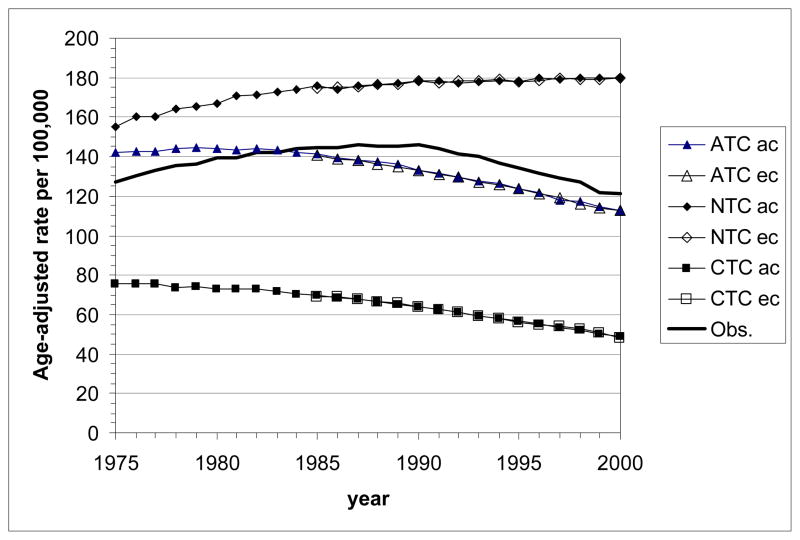
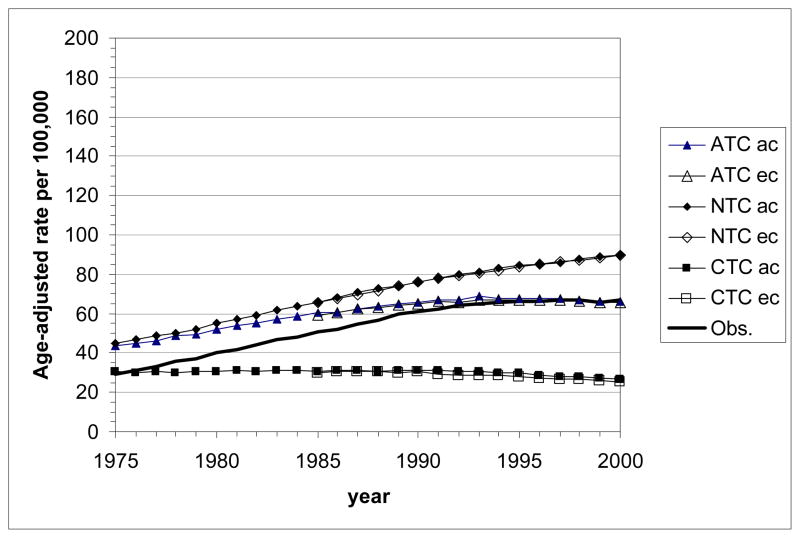
Age-standardized LC mortality rates calculated with MISCAN-lung for the U.S. male and female populations (all races, ages 30–84 y) are presented in Fig. 4. Curves are shown for the actual (ATC) and the two counterfactual (NTC, CTC) tobacco control scenarios. The two sets of birth year cohorts (ec and ac) are considered. Differences between the results for these sets remain very small. They are slightly more pronounced in females than in males.
Figure 4.
Age-standardized lung cancer mortality rates (using the 2000 US Standard Population, Census P25-1130) by calendar year as estimated with the MISCAN-lung model for the three tobacco control scenarios (ATC, actual control; NTC, no control; CTC, complete control). The bold line represents the age-standardized observed mortality rates in the U.S. ac: all cohorts, starting with birth cohort 1890; ec: empirical cohorts, starting with birth cohort 1900.
Top panel: all races, males aged 30–84 y; bottom panel: all races, females aged 30–84 y.
As expected, highest rates are seen for the NTC scenario. Under ATC the rates are reduced. The CTC scenario yields the lowest rates. This holds for males and females, but corresponding values are always much lower for females than for males.
For NTC, the trend across calendar year is an increase in LC mortality rate, which for males levels off to a plateau value of about 180 per 100,000 after 1990. Increase and leveling off is also seen for females, but before the year 2000 no plateau value is reached.
For CTC, rates tend to decrease at a gradually faster pace by calendar year for males; for females this trend seems to develop, but during the studied period the rate still remains rather constant.
For ATC, the time trend in LC mortality rates for both males and females is an increase to a (rather flat) peak value followed by a decrease. During the studied period, for males the phase of decrease is more prominent (peak around 1980) while for females the phase of increase is seen until about 1995. Although the trends of the observed U.S. LC mortality rates have a similar shape as in the model output, predicted peaks occur some 5–10 years earlier than observed. The model overestimates the male LC mortality rates until 1983 and underestimates them in later years. For females, the overestimation lasts until 1992, after which the model and the observations agree rather well.
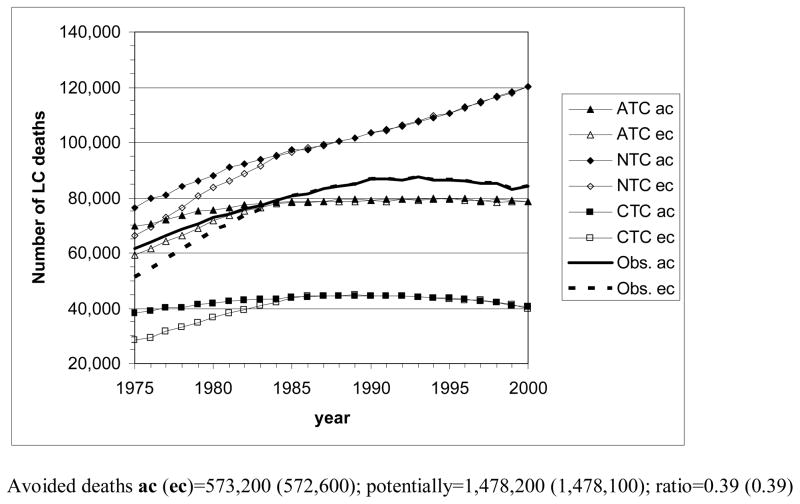
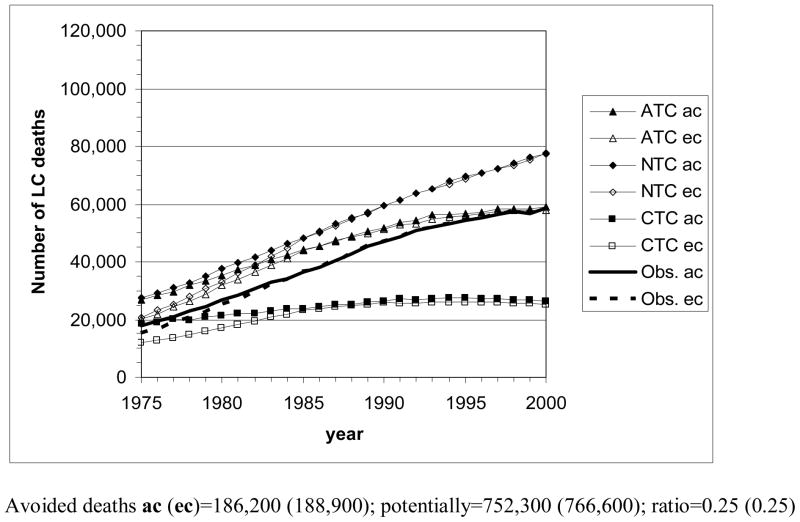
Fig. 5 shows the number of LC deaths by calendar year that MISCAN-lung estimates for the various tobacco control scenarios, for the U.S. populations of males and females of all races and for the two sets of birth year cohorts. As persons of certain ages are missing before 1985 in the ec case, corresponding ec and ac curves deviate clearly before this time point. Deviations in later years remain very small and are more pronounced for females than for males.
Figure 5.
The number of lung cancer deaths by year (1975–2000) in the U.S., according to the MISCAN-lung model for the three tobacco control scenarios, and actually observed. ac: all cohorts, starting with birth cohort 1890; ec: empirical cohorts, starting with birth cohort 1900. Avoided deaths = total number of LC deaths in case of no tobacco control (NTC) − total number of LC deaths in case of actual tobacco control (ATC). Potentially avoidable deaths = total number of LC in case of no tobacco control (NTC) − total number of LC deaths in case of complete tobacco control (CTC).
Top panel: all races, males aged 30–84 y; bottom panel: all races, females aged 30–84 y.
Concerning the scenarios and gender differences similar remarks can be made as for the LC mortality rates. However, due to an increase of the elderly population in particular, the graphs are by and large rotated counterclockwise, which makes decreasing trends in risk less apparent.
By adding the yearly numbers of estimated LC deaths across the whole period for the separate scenarios, the number of LC deaths avoided due to actual tobacco control can be calculated as the difference between the total numbers for NTC and ATC. The estimated number of potentially avoidable LC deaths follows from the difference between the total numbers for NTC and CTC. The resulting numbers are (Fig. 5): 573,200 avoided male deaths and 1,478,200 potentially avoidable male deaths in the ac set of birth years (in the ec set: 572,600 and 1,478,100); ratio=0.39. Avoided and potentially avoidable female deaths amount to 186,200 and 752,300, respectively, in the ac set (188,900 and 766,600 in the ec set); ratio=0.25.
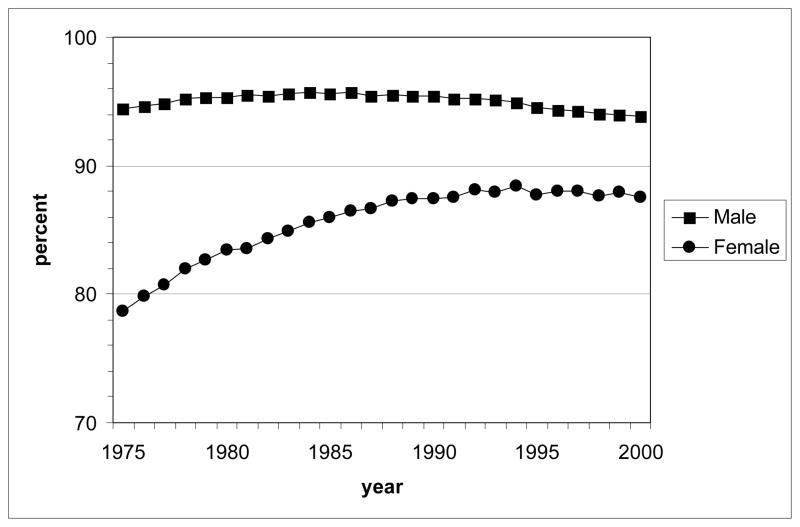
Because MISCAN-lung distinguishes current and former smokers from never smokers when counting the numbers of simulated LC deaths, it is possible to derive the percentage of LC deaths by calendar year that is attributable to smoking (population attributable risk, PAR). The results for males and females are shown in Fig. 6. According to the model, for males the PAR remained at a rather high value of around 94% during the whole period, with only a slight decreasing trend after 1985. For females, an increase is seen from 78% in 1975 to 88% in 1990, after which the level remained relatively constant.
Figure 6.
Population-attributable lung cancer risk deaths by calendar year (1975–2000) according to the MISCAN-lung model under the actual tobacco control (ATC) scenario, for all races U.S. males and females, aged 30–84 y (all cohorts, starting with birth cohort 1890). The percentage was calculated by multiplying the ratio of model-predicted never smokers / total LC deaths to the observed total number of LC deaths, adding across all single ages in a year to obtain the estimated number of background (never smokers) LC deaths, and then taking the difference, total observed minus background, to yield the smoking-attributable number of LC deaths in that year.
4. DISCUSSION
For U.S. male and female populations with appropriate composition by age and with quantified patterns of tobacco consumption, through micro-simulation of life histories during which LC may develop, LC mortality (counts and rates) was calculated with the MISCAN-lung model. Several scenarios of tobacco control were considered. Values of parameters for various components of the model – e.g. carcinogenesis, disease process, and smoke exposure dependent risk factors – had been obtained before from the literature and by calibrating to data in other CISNET Base Case studies. Where appropriate, gender-specific parameter values and input quantities were used. Not only because of the biological differences that may cause, e.g. different susceptibility to smoke exposure, but also to account for social phenomena like the later adoption of smoking by large numbers of women.
Age-standardized LC mortality rates calculated with MISCAN-lung under ATC show behavior similar to observed trends, i.e. rates declining for males in recent years while still rising for females, but it looks like the calculated trend has shifted in time with respect to the observations. Observed rates were first overestimated, and later underestimated. The latter is seen for males only, because of the studied time frame. A similar effect occurs when considering the numbers of LC deaths. There may be several reasons for those deviations. The cohorts of smokers considered in the SHG may not fully represent the U.S. population. The composition of cigarettes has changed over time, which may have caused changes to the lethality of cigarette smoke. Other exposures may have occurred which influence LC mortality but were not modeled. For the two counterfactual scenarios, NTC and CTC, no observed data are available for comparison.
The worldwide estimated PAR for LC in industrialized countries in the year 2000 amounts to 92% and 71% for males and females aged 30 years or older, respectively(19). The U.S. Centers for Disease Control and Prevention (CDC) publish smoking-attributable mortality (SAM) information which for the period 2000–2004 reports PARs of 87% and 70%(20) for LC in the U.S. This represents a very small decrease with respect to the preceding reporting period 1997–2001, when the numbers were 88% and 71%. Earlier, in 1991, 90% and 78% were estimated, or 86% for males plus females(21). Much earlier, in 1982, an estimate of 85% for the combined genders was stated (22). Comparison of those numbers from the literature with the present MISCAN-lung results reveals that the model yields rather high values, especially for females. The model considers complete smoking histories for the simulated persons. The CDC analyses rely on gender and age-specific data (different age range: 35–64, ≥65 y versus 30–84 y) from its National Health Interview Survey (NHIS) to calculate current and former cigarette smoking prevalence, and on gender-specific relative risk (RR, relative to never smokers) estimates for LC death of current and former smokers in the period 1982–1988 from the American Cancer Society’s CPS-II trial. Resulting smoking-attributable fractions (SAF) of preventable deaths are multiplied by the total number of LC deaths (death certificate data from CDC’s National Center for Health Statistics) to yield the SAM.
It is worth noting that the model results reflect almost exclusively the impact of tobacco control on adult smokers, rather than in primary prevention in adolescents. Adolescents that never began smoking at age 15 as a result of tobacco control in 1965 would have been 50 years old in 2000 (and not yet experienced lung cancer death or diagnosis). It is also important to note that not all former smokers have quit as a result of public health campaigns. They may also have quit because of competing health diagnoses such as heart failure or COPD that are attributable to smoking. Indeed, in our paper tobacco control is not limited to “public health campaigns” but is understood to include all effects of acquiring knowledge on the detrimental effects of smoking.
Demographic assumptions focus on the population characteristics including gender, race/ethnicity, and age distribution. MISCAN-lung does not assume any entry or exit from the population due to migration. This may be a problem when studying the dynamic U.S. population with a net influx of immigrants during the rather long time period considered (1890–1970). In the present study the simulated births distribution was adjusted so that (in conjunction with modeled mortality) it reflects the people who were alive in the U.S. during the studied period, 1975–2000. Any influence of immigrants on (the reduction of) LC incidence and mortality will further be limited as those coming from e.g. Central and South America, Africa, India or South-East Asia tend to smoke substantially less than U.S.-born citizens(23).
Insufficiencies in knowledge that influence the model concerning uncertainty in parameter estimates as well as in structural composition and the correct interpretation of the model are limiting factors. Important for the present study is the uncertainty of the smoking histories. Surveys started in the 1960s but data is needed from about 1900 onwards. Collection of data based on self-reporting of smoke consumption is likely to yield biased results, e.g. due to the respondents’ tendency to give socially desirable answers, to selective or deteriorated recall and to digit preference(24). As a result, considerable underestimation may occur(25).
Model parameters vary when derived from effects of smoking observed in different study cohorts. MISCAN-lung carcinogenesis parameters are based on the NHS/HPFS trials with their available longitudinal information on risk factors. FHCRC, for instance, has chosen other estimates which seem to fit observed U.S. LC mortality data slightly better.
The CPS-I and CPS-II cohorts show different effects of smoking with respect to DfOC, being interpreted as period effects. It may well be that smoking-related DfOC in the period before CPS-I also deviates from present modeling based on CPS data. This could have a substantial influence on the calculated LC trends.
Investigation of the impact of tobacco control policies on smoking-related LC mortality can be seen as an important step towards the identification of optimal strategies for reducing the LC burden. Doing that by means of comparative analyses of results of models that associate smoking and LC perfectly fits the purposes of CISNET. MISCAN-lung is a model next to those of several independent research groups being fed with the same input. Comparison of the results can be considered a form of quality control. Either the results are independently confirmed or the collaboration contributes to a better understanding of the complex processes because any discrepancies will be noticed, discussed and remedied. One advantage of the MISCAN lung model is that it is also capable of evaluating screening for LC since it incorporates a natural history model with preclinical screen-detectable stages.
The MISCAN-lung calculations on the hypothetical cases confirm the earlier conclusion (from e.g. analyses of the CPS studies (26)) that low smoking intensity (cpd) and long duration is worse with respect to LC mortality than high smoking intensity and short duration. For example, the model predicts that, in the case of two people starting at the same age of 25 y, quitting smoking 40 cpd at age 35 reduces the LC mortality rate some 40 years later multiple (7,8) times as compared with continuous smoking of 20 cpd. When smoking between ages 25 y and 35 y, doubling the amount from 20 cpd to 40 cpd or halving to 10 cpd would increase the LC mortality rate around age 75 y by about 20% or decrease it by about 10%, respectively. Prolonging the duration (at 20 cpd) by starting 11 y earlier or by continued smoking increases the LC mortality rate by about 50% or 900%, respectively. In other words, smoking more for a shorter time is less risky than smoking less for a long time. The firmness of this conclusion may be questioned, considering that uncertainty in smoking duration is generally less than uncertainty in intensity (self-reporting bias and weak relationship between cpd and actual exposure of the lungs to carcinogens) which may wrongly emphasize the importance of the former variable. The message of greater interest, inferred from the tobacco control scenario simulations, is that although the ATC campaigns have had a favorable impact on lung cancer mortality, potentially up to a factor of 1.5 (males) or 3 (females), more lung cancer deaths could have been avoided had smoking been abandoned completely from 1965 onwards. Taking the reported U.S. smoking behavior as input, MISCAN-lung derives high percentages of LCs that are to be attributed to smoking. Therefore, the discouragement of smoking should at least be maintained but preferably be intensified.
Time trends and gender differences have been reported for LC histology, both in the U.S.(27,28) and Europe(29,30). Since the mid-1980s the relative incidence of adenocarcinoma has increased dramatically, which may be due to changed cigarette design (filter tip) in the 1950s. In the U.S. this LC cell type now is predominant, whereas in Europe squamous cell carcinoma is the most common. On both continents adenocarcinoma occurs relatively more often in females than in males. As prognosis and treatment depend on LC stage and cell type, the inclusion of LC subtypes in the models is very useful for clinically oriented studies. But also for tobacco control, because it will help enrich the knowledge about the relationship between (certain components of) cigarette smoke and LC subtype. Both research areas would profit if uncertainties could be reduced, or at least better accounted for, in particular the uncertainties in cigarette consumption before the 1960s and the relation between smoking and DfOC. Perhaps a Bayesian approach (like Gibbs sampling) could be applied to estimate the most probable pre-1960s smoking behavior and to yield statistical inference on the smoking-DfOC relationship. An update of the carcinogenesis parameters, possibly differentiated by histological LC subtype, would also be of help to continue progress by enabling more precise evaluation of different control scenarios with respect to model-predicted LC incidence.
Acknowledgments
This work was funded by NIH Grant 5U01CA097416. We thank our colleagues (W.D. Hazelton, R. Meza and S.H. Moolgavkar) from the Fred Hutchinson Cancer Research Center, Seattle, for kindly providing us with parameter values for the carcinogenesis model.
We also thank our colleagues from the dept. of Public Health, Erasmus MC (J. van Rosmalen and K. ten Haaf) for re-checking the model results.
Footnotes
Other competing interests: none declared.
References
- 1.Habbema JD, van Oortmarssen GJ, Lubbe JT, van der Maas PJ. The MISCAN simulation program for the evaluation of screening for disease. Comput Methods Programs Biomed. 1985;20:79–93. doi: 10.1016/0169-2607(85)90048-3. [DOI] [PubMed] [Google Scholar]
- 2.Loeve F, Boer R, van Oortmarssen GJ, van Ballegooijen M, Habbema JD. The MISCAN-COLON simulation model for the evaluation of colorectal cancer screening. Comput Biomed Res. 1999;32:13–33. doi: 10.1006/cbmr.1998.1498. [DOI] [PubMed] [Google Scholar]
- 3.Van Oortmarssen GJ, Habbema JD. Epidemiological evidence for age-dependent regression of pre-invasive cervical cancer. Br J Cancer. 1991;64:559–565. doi: 10.1038/bjc.1991.350. [DOI] [PMC free article] [PubMed] [Google Scholar]
- 4.De Koning HJ, Boer R, Warmerdam PG, Beemsterboer PM, van der Maas PJ. Quantitative interpretation of age-specific mortality reductions from the Swedish breast cancer-screening trials. J Natl Cancer Inst. 1995;87:1217–1223. doi: 10.1093/jnci/87.16.1217. [DOI] [PubMed] [Google Scholar]
- 5.Vogelaar I, van Ballegooijen M, Schrag D, Boer R, Winawer SJ, Habbema JDF, Zauber AG. How much can current interventions reduce colorectal cancer mortality in the U.S? Mortality projections for scenarios of risk-factor modification, screening, and treatment. Cancer. 2006;107(7):1624–1633. doi: 10.1002/cncr.22115. [DOI] [PubMed] [Google Scholar]
- 6.Draisma G, Boer R, Otto SJ, van der Cruijsen IW, Damhuis RA, Schroder FH, de Koning HJ. Lead times and overdetection due to prostate-specific antigen screening: estimates from the European Randomized Study of Screening for Prostate Cancer. J Natl Cancer Inst. 2003;95:868–878. doi: 10.1093/jnci/95.12.868. [DOI] [PubMed] [Google Scholar]
- 7.Moolgavkar SH, Venzon DJ. Two-event models for carcinogenesis: Incidence curves for childhood and adult tumors. Math Biosci. 1979;47:55–77. [Google Scholar]
- 8.Moolgavkar SH, Knudson AG. Mutation and cancer: A model for human carcinogenesis. J Natl Cancer Inst. 1981;66:1037–1052. doi: 10.1093/jnci/66.6.1037. [DOI] [PubMed] [Google Scholar]
- 9.Hazelton WD, Clements MS, Moolgavkar SH. Multistage carcinogenesis and lung cancer mortality in three cohorts. Cancer Epidemiol Biomarkers Prev. 2005;14:1171–1181. doi: 10.1158/1055-9965.EPI-04-0756. [DOI] [PubMed] [Google Scholar]
- 10.Meza R, Hazelton WD, Colditz GA, Moolgavkar SH. Analysis of lung cancer incidence in the nurses’ health and the health professionals’ follow-up studies using a multistage carcinogenesis model. Cancer Causes Control. 2008;19:317–328. doi: 10.1007/s10552-007-9094-5. [DOI] [PubMed] [Google Scholar]
- 11.CISNET Lung Cancer Model Profiles. Erasmus Medical Center; [Accessed on February 25, 2010]. (in particular Section “Smoking_Base_Case16Feb09” is specific to the present implementation of MISCAN-lung.)Available at: http://cisnet.cancer.gov/lung/profiles.html. [Google Scholar]
- 12.Armitage P, Doll R. The age distribution of cancer and a multi-stage theory of carcinogenesis. Br J Cancer. 1954;8:1–12. doi: 10.1038/bjc.1954.1. [DOI] [PMC free article] [PubMed] [Google Scholar]
- 13.Moolgavkar SH, Luebeck EG. Two event model for carcinogenesis: biological, mathematical, and statistical considerations. Risk Anal. 1990;10:323–341. doi: 10.1111/j.1539-6924.1990.tb01053.x. [DOI] [PubMed] [Google Scholar]
- 14.Jeon J, Meza R, Krapcho M, Clarke L, Byrne J, Levy D. Actual and counterfactual smoking prevalence rates in the US population via microsimulation. In: Feuer R, Levy D, Moolgavkar, editors. Chapter 5 in SBC Tobacco Control Monograph: The impact of tobacco control efforts on US lung cancer mortality: 1975–2000. NCI/NIH; Bethesda: 2012. in press. [Google Scholar]
- 15.Carter SB, Gartner SS, Haines MR, Olmstead AL, Sutch R, Wright G, editors. Millennial Edition. Vol. 1. Cambridge University Press; 2006. Historical Statistics of the United States. Table Ab11–30. [Google Scholar]
- 16.NCI-SEER. [Accessed on August 20, 2009];US Standard Population (Census P25-1130) – Single Ages. 2000 Available at: http://seer.cancer.gov/stdpopulations/stdpop.singleages.html.
- 17.Fontana RS, Sanderson DR, Woolner LB, Taylor WF, Miller WE, Muhm JR. Lung cancer screening: the Mayo program. J Occup Med. 1986;28:746–750. doi: 10.1097/00043764-198608000-00038. [DOI] [PubMed] [Google Scholar]
- 18.Henschke CI. Early lung cancer action project – Overall design and findings from baseline screening. Cancer. 2000;89:2474–2482. doi: 10.1002/1097-0142(20001201)89:11+<2474::aid-cncr26>3.3.co;2-u. [DOI] [PubMed] [Google Scholar]
- 19.Ezzati M, Lopez AD. Estimates of global mortality attributable to smoking in 2000. The Lancet. 2003;362:847–852. doi: 10.1016/S0140-6736(03)14338-3. [DOI] [PubMed] [Google Scholar]
- 20.Adhikari B, Kahende J, Malarcher A, Pechacek T, Tong V National Center for Chronic Disease Prevention and Health Promotion, CDC. Smoking-attributable mortality, years of potential life lost, and productivity losses --- United States, 2000–2004. [Accessed August 26, 2009];Morb Mort Wkly Rep. 2008 57:1226–1228. Available at: http://www.cdc.gov/mmwr/preview/mmwrhtml/mm5745a3.htm. [Google Scholar]
- 21.Shopland DR, Eyre HJ, Pechacek TF. Smoking-attributable cancer mortality in 1991: Is lung cancer now the leading cause of death among smokers in the United States? J Natl Cancer Inst. 1991;83:1142–1148. doi: 10.1093/jnci/83.16.1142. [DOI] [PubMed] [Google Scholar]
- 22.Shopland DR, editor. The health consequences of smoking: Cancer; A report of the Surgeon General. United States: Public Health Service. Office on Smoking and Health; 1982. [Accessed August 26, 2009]. Available at: http://profiles.nlm.nih.gov/NN/B/C/D/W/ [Google Scholar]
- 23.Mackay J, Eriksen M. for the World Health Organization. The Tobacco Atlas. Brighton, UK: Myriad Editions Limited; 2002. [Accessed on November 17, 2009]. Availalble at: http://www.who.int/tobacco/resources/publications/tobacco_atlas/en/index.html. [Google Scholar]
- 24.Fadnes L, Taube A, Tylleskär T. How to identify information bias due to self-reporting in epidemiological research. The Internet Journal of Epidemiology. 2009;7(2) [Google Scholar]
- 25.Hatziandreu EJ, Pierce JP, Fiore MC, Grise V, Novotny TE, Davis RM. The reliability of self-reported cigarette consumption in the United States. Am J Public Health. 1989;9:1020–1023. doi: 10.2105/ajph.79.8.1020. [DOI] [PMC free article] [PubMed] [Google Scholar]
- 26.Flanders WD, Lally CA, Zhu BP, Henley SJ, Thun MJ. Lung cancer mortality in relation to age, duration of smoking and daily cigarette consumption; Results from Cancer Prevention Study II. Cancer Res. 2003;63:6556–6562. [PubMed] [Google Scholar]
- 27.Thun MJ, Lally CA, Flannery JT, Calle EE, Flanders WD, Heath CW., Jr Cigarette smoking and changes in the histopathology of lung cancer. J Natl Cancer Inst. 1997;89:1580–1586. doi: 10.1093/jnci/89.21.1580. [DOI] [PubMed] [Google Scholar]
- 28.Freedman ND, Leitzmann MF, Hollenbeck AR, Schatzkin A, Abnet CC. Cigarette smoking and subsequent risk of lung cancer in men and women: analysis of a prospective cohort study. Lancet Oncol. 2008;9:649–656. doi: 10.1016/S1470-2045(08)70154-2. [DOI] [PMC free article] [PubMed] [Google Scholar]
- 29.Harkness EF, Brewster DH, Kerr KM, Fergusson RJ, MacFarlane GJ. Changing trends in incidence of lung cancer by histologic type in Scotland. Int J Cancer. 2002;102:179–183. doi: 10.1002/ijc.10661. [DOI] [PubMed] [Google Scholar]
- 30.Kabir Z, Connolly GN, Clancy L. Sex-differences in lung cancer cell-types? An epidemiologic study in Ireland. Ulster Med J. 2008;77:31–35. [PMC free article] [PubMed] [Google Scholar]


