

Abstract
Gene co-expression networks (GCN), built using high-throughput gene expression data are fundamental aspects of systems biology. The main aims of this study were to compare two popular approaches to building and analysing GCN. We use real ovine microarray transcriptomics datasets representing four different treatments with Metyrapone, an inhibitor of cortisol biosynthesis. We conducted several microarray quality control checks before applying GCN methods to filtered datasets. Then we compared the outputs of two methods using connectivity as a criterion, as it measures how well a node (gene) is connected within a network. The two GCN construction methods used were, Weighted Gene Co-expression Network Analysis (WGCNA) and Partial Correlation and Information Theory (PCIT) methods. Nodes were ranked based on their connectivity measures in each of the four different networks created by WGCNA and PCIT and node ranks in two methods were compared to identify those nodes which are highly differentially ranked (HDR). A total of 1,017 HDR nodes were identified across one or more of four networks. We investigated HDR nodes by gene enrichment analyses in relation to their biological relevance to phenotypes. We observed that, in contrast to WGCNA method, PCIT algorithm removes many of the edges of the most highly interconnected nodes. Removal of edges of most highly connected nodes or hub genes will have consequences for downstream analyses and biological interpretations. In general, for large GCN construction (with > 20000 genes) access to large computer clusters, particularly those with larger amounts of shared memory is recommended.
Background
Gene networks can be described in a rather abstract way: They consist of genes (nodes) connected to other genes by edges. The edges represent a relationship between the two genes they connect in a network of genes. This abstract nature of networks means that they have found a wide variety of applications in (systems) biology [1–5]. The construction of a network begins by defining the nodes to be part of the network and then establishing edges, which may be weighted, between relevant nodes. Edges are established by using some sort of measurement (e.g. a correlation metric) taken between two nodes.
A network exhibiting scale-free topology has most nodes connected to a small number of other nodes (i.e. less connectivity), but has a small number of nodes which are connected to many nodes (i.e. high connectivity). These highly connected nodes are often referred to as hubs. One property of such networks is their robustness to random perturbation or deletion of nodes, since most are only connected to a few other nodes [11]. On the flip-side, the hubs are essential to maintain the structure/topology of the network and targeted deletion of these nodes has major impacts on the network. If a hub gene becomes dysfunctional, then the network will be severely perturbed and may result in a disease state [5, 7]. While the hubs in a network are essential to biological function, there are other important structures existing in a network. For example, sets of nodes that are highly interconnected with each other but poorly connected to the rest of the network. We call these modules, but they are also known in the literature as dense subgraphs or communities, and are important for helping us to better understand the structure and function of the network [8, 9].
Gene co-expression networks (GCN) are a way to model data from gene expression microarray or RNAseq experiments. Nodes are the transcripts, edge weights are a measure of how strongly the expression levels of the two transcripts/nodes are co-expressed across a series of treatments and are typically the absolute Pearson correlation coefficients. A co-expression measure is biologically interesting to study since two genes whose transcript levels rise and fall together across a series of samples might be under a common control mechanism such as a transcription factor or other regulatory machinery. The GCN are increasingly becoming important in integrative genetics and systems biology approaches that aim to detect causal genes and their networks [5, 10–12].
The main objective of this study was to compare two common categories of GCN construction methods, with respect to detecting and keeping highly interconnected hub genes in the GCN, using connectivity as a criterion. One method is called, Weighted Gene Co-expression Network Analysis (WGCNA) and is thoroughly discussed in the original paper of Zhang and Horvath [7], an R package is also available for performing these analyses [11]. Since its first publication by Zhang and Horvath [7], the WGCNA method has been refined, standardized and now widely used in the construction of gene co-expression networks in many different species [5, 12]. The other method is called, Partial correlation and an information theory (PCIT) and full details of the PCIT algorithm are provided in Reverter and Chan [13] and an R package implementing the algorithm is also available in Watson-Haigh et al. [14]. PCIT is a method used to identify spurious edges for removal and is a data driven approach. We have provided some details of WGCNA and PCIT methods in Supplementary file.
For comparison of methods, we use real microarray datasets from our fetal sheep skin transcriptomics experiment. The rationale for this experiment was that the density of Merino wool follicles is established early in fetal development and this commercially important trait dictates wool fibre diameter, which is the key driver of the price paid for wool. It has been shown that Merino lambs exposed to metyrapone, an inhibitor of cortisol synthesis, in utero show a lifetime alteration in wool growth parameters. McDowall et al. [conference presentation/paper] performed a microarray gene expression experiment in an attempt to elucidate the genes responsible for initiating primary wool follicles (between days 55-65 of gestation). We use the microarray gene expression data from this experiment to compare the two GCN methods.
Methodology
Microarray data quality control and analyses:
The microarray experimental design and generation of transcriptomics data across 4 different experimental conditions are given in the Table 1(see supplementary material). All microarray data analyses were performed in the R statistical programming environment, using BioConductor programs. Several quality control (QC) steps were used to ensure that there were no gross anomalies with the technical aspects of hybridization [15]. The identification of differentially expressed (DE) genes was achieved using the limma package while GOEAST package was used to identify gene ontology (GO) terms enriched in a list of DE genes. See Supplementary file for additional results from microarray data quality control and exploratory analyses.
Building gene co-expression networks:
Ten gene co-expression networks (GCN) were created, a WGCNA and PCIT derived network for each of the following: D60 (day 60 samples); D67 (day 67 samples); Treated (Metyrapone samples); Control (control samples) and ALL (all samples). For each network, Pearson correlations were calculated for all pairs of transcripts and used as the basis for building the networks. Of the 24,072 probe sets on the array, 10,561 were excluded due to low mean expression (≤ 2.5 on the log2 scale) or low variance (≤ 0.001) across all 16 arrays, leaving 13,511 genes from which to calculate Pearson correlations.
In the WGCNA approach, a power adjacency function was applied to the absolute Pearson correlation matrices. The value of the power adjacency function's exponent (β) was chosen using the scale-free topology criterion. We chose β in the interval (1, 11) which maximized the scale-free topology fit (R2 ≥0.85) while maintaining a high mean connectivity. In the PCIT approach, we applied the PCIT algorithm to the Pearson correlation matrices using the PCIT R package [14] to identify and delete edges found to be insignificant by the algorithm [13]. We define the adjacency matrix by using the absolute value of the remaining edge weights (Pearson correlations).
The WGCNA approach created a Topological Overlap Measure (TOM) using gene expression data. The TOM is a generalized measure of the common edges for those two nodes in a network share [16]. It has been shown to be useful in biological networks [17] and takes values in the interval (0,1). A TOM based dissimilarity measure (1-TOM) can be used as input to average linkage hierarchical clustering. Modules can be defined as discrete branches in the clustering tree and can be formally defined by applying a tree cutting algorithm to it [11]. We do not formally define modules by using tree cutting, instead we use TOM plots to visualize the interconnectedness of nodes in the network.
We defined highly differentially ranked (HDR) nodes based on first computing the connectivity (k) of the ith gene (ki). Then ranks of the node connectivities (coded in ascending order as 1,2,3,…) are computed for each method. Then we compared the ranks to identify those which are highly differentially ranked (HDR) between WGCNA and PCIT derived networks. See Supplementary file for calculations of ki and HDR.
Results and Discussion
Constructed gene networks:
Of the 24,072 genes present on the array, 13,511 were identified for network construction by applying the mean and variance filters, described above, across all 16 microarray samples. With WGCNA that uses the scale-free topology criterion, we found coefficients of β for the power adjacency function to be 3, 7, 11, 8 and 6 for the ALL, Control, Treatment, D60 and D67 networks respectively. Mean connectivity for these networks were 518, 319, 153, 185 and 561 respectively. TOM plots showed clear modular structures present in all networks (Figure 1 top row). In one of the D67 network we have identified a module of 267 genes, some of which is known to be involved in wool follicle development Table 2 (see supplementary material). In particular BMP4 is expressed around the time of secondaryderived follicles which give Merinos their distinctive fleece.
Figure 1.
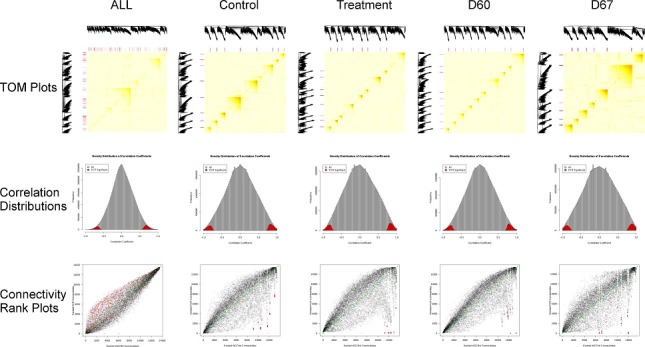
Plots relevant to the All, Control, Treatment, D60 and D67 networks (columns). Top row: TOM plots for the WGCNA networks. Heat maps shows the level of topological overlap as measured by TOM, where dark red/orange represents a higher level of overlap between pairs of nodes in the network. Modules can be defined using the dark red/orange squares along the diagonal. Red bars above and to the left of each heat map indicate the location of the highly differentially ranked (HDR) nodes. All HDR nodes identified from all the networks are show in the ALL network TOM plot. Middle row: Frequency distributions of all Pearson correlations (grey) used to generate the networks and those edges remaining following PCIT (red). Bottom row: Plots of ranked connectivity's calculated from the PCIT and WGCNA derived networks. Data points are semi-transparent, thus dense regions of points appear as dark areas. Green dashed line is the line of equality. HDR nodes are shown in red, with all 1,017 indicated in the connectivity rank plot for the ALL network.
With PCIT, many edges were identified as insignificant and deleted by PCIT (Figure 1 middle row) leaving a much sparser network with 2.76%, 3.07%, 3.14%, 3.11% and 2.77% edges with absolute weights of ≥0.49, 0.66, 0.66, 0.63 and 0.69 for the ALL, Control, Treatment, D60 and D67 networks respectively.
Highly differentially ranked (HDR) nodes:
For the ALL network, the Spearmans rank correlation coefficient for connectivity is high (0.94) indicating a broad level of agreement between the connectivity ranks of nodes in the WCNA and PCIT derived networks. There is some disagreement among middle ranking nodes as seen by the departure from the line of equality (y=x), but highly and lowly connected nodes are similarly ranked in the WGCNA and PCIT derived networks (Figure 1 bottom row). Therefore, one may conclude that both approaches rank nodes, by connectivity, approximately equally. This is especially true when looking at the most highly connected nodes (hubs) which are always ranked highly. However, the connectivity ranks for the Control, Treatment, D60 and D67 networks show a different story (Figure 1 bottom row). They show reasonable agreement in rank for most nodes with Spearman rank correlation coefficients of 0.79, 0.66, 0.81 and 0.78 for the Control, Treatment, D60 and D67 networks respectively. However, a small number of nodes (n=357 for the Control network; n=370 for the Treatment network; n=251 for the D60 network and n=477 for the D67 network) showed highly different connectivity ranks in the PCIT network compared to the WGCNA network. We call these highly differentially ranked (HDR) nodes and are identified as dense clusters of data points in the off-diagonal regions of the plots (red data points in Figure 1, bottom row). Of the 13,511 genes in the networks, we found a total of 1,017 were HDR in at least 1 of the networks and 29 were HDR in all but the ALL network Figure 3(see supplementary material).
These HDR nodes are highlighted in the TOM plots of the WGCNA derived networks (Figure 1, top row). We found that all HDR nodes are among the most highly interconnected, as determined by TOM, and were present in every module of their respective networks. Table 2 (see supplementary material) gene enrichment analyses of a list of HDR nodes from one of the WGCNA modules. From this type of analyses, we could make an informed conclusion regarding relevance from a biological perspective and the impact of WGCNA vs. PCIT in retaining or deleting hub genes.
We found that PCIT is removing edges from nodes that are among the most highly interconnected genes, not only in a network but also within modules, like those mentioned in Table 2 (see supplementary material). I.e. it's removing all the strong connections that exist between tightly co-regulated genes. While some of these edges may not be seen to be independent of the edges to a third node, they are likely to be key members of modules. The highly interconnected nature of the HDR nodes means that these are good candidate hubs. The removal of hubs from networks has a serious effect on the topology of that network and of the modules from which it is comprised. We believe that the PCIT approach to edge deletion is also deleting edges for hub nodes due to the fact that they are all highly interconnected for biological reasons rather than the formation of spurious edges forming due to non-independence of the correlations. The removal of edges by PCIT from HDR nodes is likely to have the effect of knocking out the hub nodes of the network and is likely to severely disrupt its topology.
Conclusion
We have generated ovine microarray gene expression data and applied various quality control methods available in Bioconductor R programs before comparing two commonly used co-expression network construction methods. We illustrated similarity and differences in these approaches using this real biological data set (a drug challenge transcriptomics experiment in sheep) rather than an artificial simulated data set or a large data set often only seen in human or mouse studies. Thereby, our findings are more applicable to the typical rather than atypical studies where experiments tend to be smaller in size. However, these investigations and results apply to any microarray gene expression data regardless of species. We have restricted our comparison to just WGCNA and PCIT softwares because they represent two broad categories. The results of this study can, somewhat, be extrapolated to those softwares that fall under the two broad categories. We can conclude that WGCNA method is favorable over PCIT method as the former retains biologically relevant hub genes and their connections within sub-networks intact. This is proven by gene enrichment analyses of all genes within each sub-networks and modules across different treatment conditions in both methods and its relevance to phenotypes in question (here wool or hair growth). While we can recommend testing more GCN algorithms, there are several new approaches and softwares constantly emerging (e.g. FunNET [18]) and it is impossible to compare all. Lastly, one could also test these methods on other transcriptomics data sets but this would not change the conclusion.
Supplementary material
Acknowledgments
Authors thank M.L. McDowall, N.M. Edwards, G.S. Natrass, H.A. McGrice and P.I. Hynd for their contribution to sheep experiment and providing data from this experiment to authors for comparison of network methods.
Footnotes
Citation:Kadarmideen & Watson-haigh, Bioinformation 8(18): 855-861 (2012)
References
- 1.H Jeong, et al. Nature. 2001;411:41. [Google Scholar]
- 2.MR Carlson, et al. BMC Genomics. 2006;7:40. doi: 10.1186/1471-2164-7-40. [DOI] [PMC free article] [PubMed] [Google Scholar]
- 3.TF Fuller, et al. Mamm Genome. 2007;18:463. [Google Scholar]
- 4.HN Kadarmideen. IET Sys Biol. 2008;2:423. [Google Scholar]
- 5.HN Kadarmideen, et al. Mol BioSystems. 2011;7:235. [Google Scholar]
- 6.R Albert, et al. Nature. 2000;406:378. [Google Scholar]
- 7.B Zhang, S Horvath. Stat Appl Genet Mol Bio. 2005;4:17. [Google Scholar]
- 8.A Vespignani. Nat Genet. 2003;35:118. doi: 10.1038/ng1003-118. [DOI] [PubMed] [Google Scholar]
- 9.F Luo, et al. Bioinformatics. 2007;23:207. [Google Scholar]
- 10.HN Kadarmideen, et al. Mamm Genome. 2006;17:548. doi: 10.1007/s00335-005-0169-x. [DOI] [PMC free article] [PubMed] [Google Scholar]
- 11.P Langfelder, et al. Bioinformatics. 2008;24:719. [Google Scholar]
- 12.LJA Kogelman, et al. BMC Genomics. 2011;12:607. doi: 10.1186/1471-2164-12-607. [DOI] [PMC free article] [PubMed] [Google Scholar]
- 13.A Reverter, EKF Chan. Bioinformatics. 2008;24:2491. [Google Scholar]
- 14.NS Watson-Haigh, et al. Bioinformatics. 2010;26:411. [Google Scholar]
- 15.L Gautier, et al. Bioinformatics. 2004;20:307. [Google Scholar]
- 16.AM Yip, S Horvath. BMC Bioinformatics. 2007;8:22. doi: 10.1186/1471-2105-8-22. [DOI] [PMC free article] [PubMed] [Google Scholar]
- 17.E Ravasz, et al. Science. 2002;297:1551. doi: 10.1126/science.1073374. [DOI] [PubMed] [Google Scholar]
- 18.E Prifti, et al. Bioinformatics. 2008;24:2636. [Google Scholar]
Associated Data
This section collects any data citations, data availability statements, or supplementary materials included in this article.