Experimental errors in macromolecular crystallography are underestimated as they do not account for the contribution of crystal-to-crystal variations.
Keywords: experimental errors, R values
Abstract
Experimental errors as determined by data-processing algorithms in macromolecular crystallography are compared with the direct error estimates obtained by a multiple crystal data-collection protocol. It is found that several-fold error inflation is necessary to account for crystal-to-crystal variation. It is shown that similar error inflation is observed for data collected from multiple sections of the same crystal, indicating non-uniform crystal growth as one of the likely sources of additional data variation. Other potential sources of error inflation include differential X-ray absorption for different reflections and variation of unit-cell parameters. The underestimation of the experimental errors is more severe in lower resolution shells and for reflections characterized by a higher signal-to-noise ratio. These observations partially account for the gap between the expected and the observed R values in macromolecular crystallography.
1. Introduction
Knowledge of experimental error is essential in order to put scientific results into a probabilistic context, i.e. to define whether or not an observed effect results from random factors. While the error of a primitive measurement (e.g. the determination of the width of this page using a ruler) can be defined directly, in almost any realistic scenario the experimental error of a single measurement is essentially unknown. A reliable practical approach to this problem is to repeat the experimental measurements a reasonable number of times to obtain the standard uncertainty.
In macromolecular crystallography, the experimental data consist of the intensities of individual reflections which form the X-ray scattering pattern. To evaluate the uncertainty of an individual measurement, certain assumptions are made with respect to the properties of the detector in addition to the counting statistics. Fortunately, the very nature of crystallographic data allows estimation of the level of variability based on repeated measurements of the same quantity, since multiple instances of the same reflection and its symmetry-related copies are measured during data collection.
The a priori expectation is that a theoretical model predicting the intensities of X-ray scattering should bring the calculated values within the limits of experimental uncertainty. This, however, is not the case in macromolecular crystallography, as demonstrated by the R values that far exceed the expectation based on experimental errors. It is often presumed that this discrepancy is mainly a consequence of inadequacy of the theoretical models, such as poor modeling of the bulk-solvent contribution (Jiang & Brünger, 1994 ▶; Glykos, 2011 ▶) and atomic disorder (Vitkup et al., 2002 ▶; Levin et al., 2007 ▶). Most importantly, the experimental errors are thus only a small fraction of the overall model error, perhaps to such an extent as to render them irrelevant. It appears as if the experimental errors are much smaller than those originating from our limited ability to model the content of the unit cell. In fact, a major crystallographic refinement program implements a maximum-likelihood refinement target that makes no use of experimental errors (Lunin et al., 2002 ▶; Lunin & Skovoroda, 1995 ▶), while others incorporate experimental error through variance inflation (Bricogne & Gilmore, 1990 ▶; Pannu & Read, 1996 ▶; Murshudov et al., 1997 ▶; Cowtan, 2005 ▶).
In this work, we explore the alternative possibility that the experimental errors are underestimated by data-processing programs, particularly in lower resolution shells. To evaluate the adequacy of the error estimates, we extended the concept of repeated measurements to a single data set which contains thousands of individual reflections. Using multiple crystals grown and prepared for data collection using an identical protocol, we determine values of the experimental uncertainty that include crystal-to-crystal variation and compare them with those predicted for individual experiments by data-processing programs.
2. Materials and methods
2.1. Protein crystallization
Glycerol dehydrogenase from Thermotoga maritima (TmGldA) was expressed as described previously (Lesley et al., 2002 ▶; the cell line was received from the Joint Center for Structural Genomics). The protein was purified using a combination of metal-affinity and gel-filtration chromatography. Hen egg-white lysozyme (HEWL) was purchased from USB (Cleveland, Ohio, USA) and used without further purification. Human fatty-acid binding protein 4 (FABP4) was expressed and purified as described by Bai et al. (2010 ▶).
For crystallization, TmGldA was concentrated to 5–10 mg ml−1 in storage buffer composed of 10 mM Tris pH 7.5, 150 mM NaCl. Crystals were grown by the sitting-drop vapour-diffusion method using 35% MPD, 0.1 M sodium/potassium phosphate pH 6.2 as precipitant. The classic method was used to obtain tetragonal HEWL crystals by mixing protein dissolved in 0.1 M sodium acetate buffer pH 4.6 at 50 mg ml−1 and 8%(w/v) NaCl, 0.1 M sodium acetate pH 4.6. FABP4 crystals were grown using protein concentrated to 5–10 mg ml−1 in 10 mM Tris pH 7.5, 150 mM NaCl, 5 mM β-mercaptoethanol, 1.6 M sodium citrate pH 6.5 as precipitant.
TmGldA and FABP4 crystals were harvested directly from the drop, while HEWL crystals were first transferred into 2.5 M sodium malonate pH 5.0 for cryoprotection (Holyoak et al., 2003 ▶). Crystals were flash-cooled and stored in liquid nitrogen for data collection.
2.2. Data collection and processing
X-ray diffraction data were collected at Stanford Synchrotron Radiation Lightsource (SSRL). To minimize radiation damage, the shortest possible sweep yielding the complete data set was used, taking advantage of the relatively high symmetry of the TmGldA, HEWL and FABP4 crystals (space groups I422, P43212 and P212121, respectively).
Nine TmGldA crystals were used that were harvested from two simultaneously prepared crystallization drops. All of the crystals were of approximately the same size (∼0.3 mm) and diffracted to roughly the same resolution (∼1.8 Å).
A tetragonal HEWL crystal was used to collect 16 data sets using identical protocols (the same starting angle, oscillation width and number of frames). Furthermore, 13 individual crystals were used to collect data at three levels of diffraction intensity. The lowest resolution data were generated by centering the minimally sized and maximally attenuated beam on the tip of a crystal (owing to the excellent quality of lysozyme crystals, this still produced data of fairly high resolution: ∼1.55 Å). The ‘medium-resolution data’ were collected by simply reducing the degree of beam attenuation. The ‘high-resolution data’ were collected by increasing the size of the unattenuated beam to the maximum and centering on a thick section of the crystal.
In another experiment, a HEWL crystal was intentionally shattered in the drop and seven crystal fragments were used for data collection. Furthermore, three crystals were used to collect multiple data sets by focusing the X-ray beam on different parts of the crystal, twice using a 20 × 50 µm beam and once using a microbeam (SSRL beamline 12-2).
The rod-shaped FABP4 crystals were used to collect multiple data sets from different sections of the same crystal using a small-sized beam (20 × 50 µm). Single data sets were also collected from seven crystals.
Data were processed using DENZO/SCALEPACK (Otwinowski & Minor, 1997 ▶), MOSFLM/SCALA (Evans, 2006 ▶; Leslie & Powell, 2007 ▶) and XDS/SCALA (Evans, 2006 ▶; Kabsch, 2010 ▶) combinations for integration and scaling. To minimize possible bias in the data-processing protocol, an automated procedure was implemented for DENZO/SCALEPACK. Specifically, autoindexing was followed by integration with fixed mosaicity. An automated procedure was implemented in which the integrated intensities were scaled together and error-model parameters were iteratively adjusted to achieve values of χ2 between 0.9 and 1.1 whenever possible and was interspersed with multiple rounds of scaling and outlier rejection until no further outliers were identified. The mosaicities determined for individual frames by SCALEPACK were then used to reintegrate the intensities with DENZO. The whole process was iterated until it converged with the best possible error-model parameters and mosaicity values assigned to individual frames that were no more than 0.05° higher than the corresponding values obtained from SCALEPACK. The Python scripts used to implement this protocol are available from http://pyhkl.sourceforge.com.
For processing with MOSFLM/SCALA, iMOSFLM (Battye et al., 2011 ▶) was used with default parameters followed by space-group identification with POINTLESS (Evans, 2006 ▶) and scaling in SCALA (mis-identification of the space group, e.g. P43212 versus P41212, was corrected as necessary). Automatic processing scripts developed by Ana Gonzalez and Yingssu Tsai (autoxds; http://smb.slac.stanford.edu/facilities/software/xds/) were used to integrate diffraction images with XDS and scale the integrated intensities with SCALA.
2.3. Estimation of the experimental errors from multiple data sets
The multiple data sets for each case were scaled together using a single reference data set and the following equation [similar to Wilson scaling (Wilson, 1942 ▶), but applied here to individual reflections since the crystals are expected to be isomorphous],
The effect of the low-resolution cutoff on scaling parameters was negligible and σI values were used for weighted regression {specifically, the weights were defined as w = 1/[(σI/I)2 + (σref/I ref)2] and only positive intensities were used in regression}. For every reflection, the weighted arithmetic mean intensity was determined as follows (summation over instances of the reflection in multiple data sets),
The unbiased weighted sample variance can be estimated,
 |
To obtain the weighted variance estimate from the set of σh values, we observe that the variance of a sample variance is proportional to the square of the variance itself and therefore the correct weights are 1/σh 4,
 |
To compare the variation of the observed intensities in the multiple data sets with the averaged σh, we introduce the following parameter:
 |
The results described below were not sensitive to the choice of the reference data set, while the inter-data-set scaling itself always substantially reduced the overall average κh. This parameter is further referred to as the variance ratio. It is used to characterize our empirical observations and its use does not imply any specific mechanism or source of the additional error or its reduction. The relative contribution of the ‘additional’ error can easily be derived from the variance ratio as (κh 2 − 1)1/2.
Alternatively, the observed values from individual data sets may be averaged without weighting, given that the error estimates are in fact questionable. The variance ratio is then represented by the simplified formula
We have found that both approaches produce very similar results, with the simple averaging producing slightly lower variance ratios. The weighted κh was used in all of the analyses presented below.
3. Results and discussion
3.1. Converting intensities to amplitudes produces overestimated errors
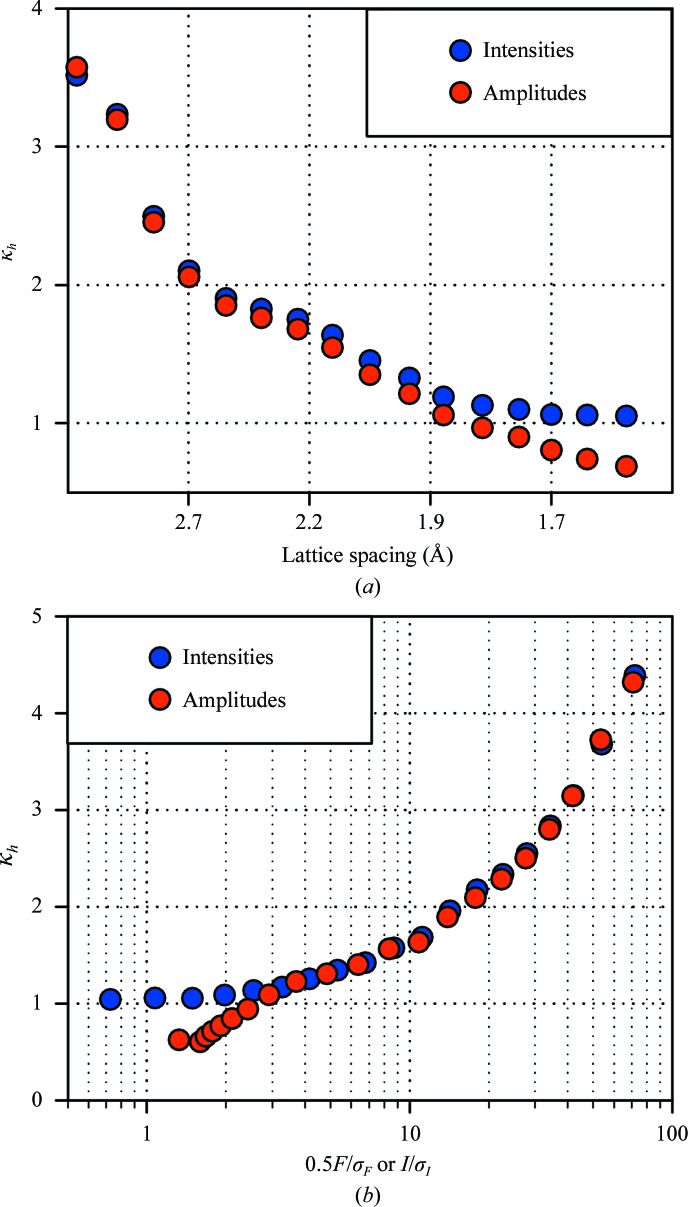
The analysis described below can be applied to both the intensities of individual reflections and the structure-factor magnitudes derived from these using various algorithms (French & Wilson, 1978 ▶; Sivia & David, 1994 ▶). It appears reasonable to expect that the variance ratio should not change upon such a conversion. Our observation, however, is that this does not hold in higher resolution shells and further analysis indicates that this effect occurs mostly for the weak reflections, offering a clue to its origin (see Fig. 1 ▶; results are shown for the nine TmGldA data sets). Conversion of negative and inflation of weak intensities results in some increase in the variation across multiple data sets and this effect is obviously most pronounced in the higher resolution shells. To avoid this complication, the subsequent analysis applies to intensity measurements.
Figure 1.
Comparison of error correction for reflection intensities and amplitudes. (a) The variance ratio in resolution shells. In higher resolution shells κh ≃ 1 for the intensities, but it declines below unity for the amplitudes. (b) The variance ratio versus the relative strength of a reflection. For the intensities κh ≃ 1 for I/σI < 2, whereas for the amplitudes the variance ratio decreases rapidly for the weaker reflections. This indicates that the conversion algorithm introduces additional variation for the weaker data. The example shown uses TmGldA data processed with MOSFLM/SCALA; identical behavior was observed for all other reported data.
3.2. Multiple crystals
In this experiment, several crystals obtained using an identical crystallization protocol were used to collect multiple data sets. Three different protein crystal forms were utilized as described in §2. Similar observations were made in all cases, namely that the variance ratio was consistently above unity. The resolution and amplitude dependence followed the same pattern (an example is shown in Fig. 1 ▶), clearly indicating that the observed behavior is not unique to a particular protein crystal form but rather reflects some general contribution to the experimental errors that is not accounted for by modern data-processing algorithms.
Specifically, the variance ratio generally approaches unity in higher resolution shells, indicating that the errors of the weaker reflections are determined more accurately. This is perhaps because the statistical error then exceeds the systematic error of the crystal-to-crystal variation. In contrast, in the lower resolution shells the errors are significantly underestimated. Naturally, it is not expected that the absolute values of the error inflation will be universal for different protein crystals, only the general form of the resolution dependence of the variance ratio.
Given that the average signal-to-noise ratio (I/σI) of a reflection generally decreases in higher resolution shells, we also analyzed its influence on the variance ratio. Generally, we found that better estimates are obtained for the weaker reflections, which is likely to be because counting error then exceeds crystal-to-crystal variation. The exact relationship between the variance ratio and the reflection strength was very similar for the three crystal forms studied here and is approximated well by the following empirical relationship:
 |
For the three crystal forms studied here the optimization resulted in fairly similar values for the empirical parameters: κ0 ≃ 1.0, s crit ≃ 15 and γ ≃ 1.5. Δκ, on the other hand, varies significantly (from ∼2.2 for the low-resolution HEWL data to ∼6.5 for the FABP4 data) and provides overall scaling of the variance ratio.
3.3. Data-processing algorithms
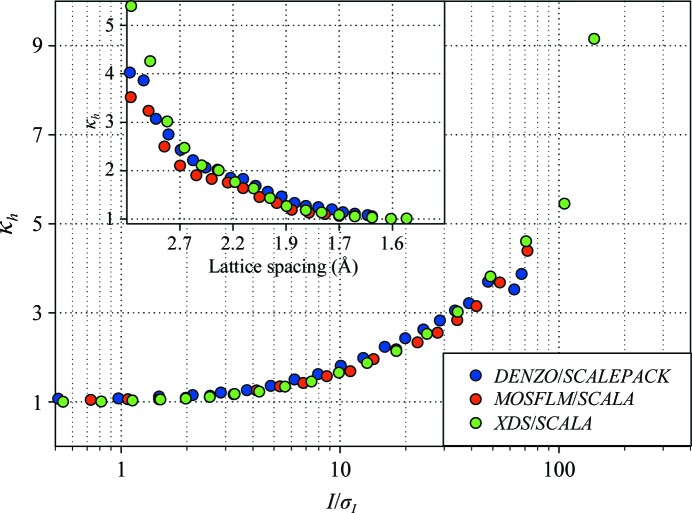
Several modern software packages are available for the integration of raw diffraction images and subsequent scaling of the integrated reflection intensities. We examined the three most common scenarios encountered in data processing for the combination of the integration and scaling algorithms: (i) DENZO/SCALEPACK, (ii) MOSFLM/SCALA and (iii) XDS/SCALA. The variance ratio is shown versus the reflection strength in Fig. 2 ▶. All three algorithms show the same behavior, with the errors being largely accurate for the weak reflections and being substantially underestimated for the stronger reflections and, correspondingly, in lower resolution shells. It is noteworthy that the MOSFLM/SCALA combination appears to provide the most accurate prediction of the experimental error, while XDS/SCALA underestimates the errors for stronger reflections the most. It is quite conceivable that this picture may be significantly altered if ‘more careful’ data processing is employed and it may vary for different crystal forms. However, for all three algorithms the data-processing statistics as reported by the corresponding programs were clearly acceptable as judged by standard data-quality indicators.
Figure 2.
Comparison of error correction for the same nine TmGldA data sets processed using different programs. The variance ratio is shown versus the reflection strength. MOSFLM/SCALA processing provided the most accurate error estimates and the XDS/SCALA combination tended to underestimate the variability of the stronger reflections the most. The inset shows the same data in resolution shells.
3.4. HEWL data sets collected at different resolutions/beam intensities
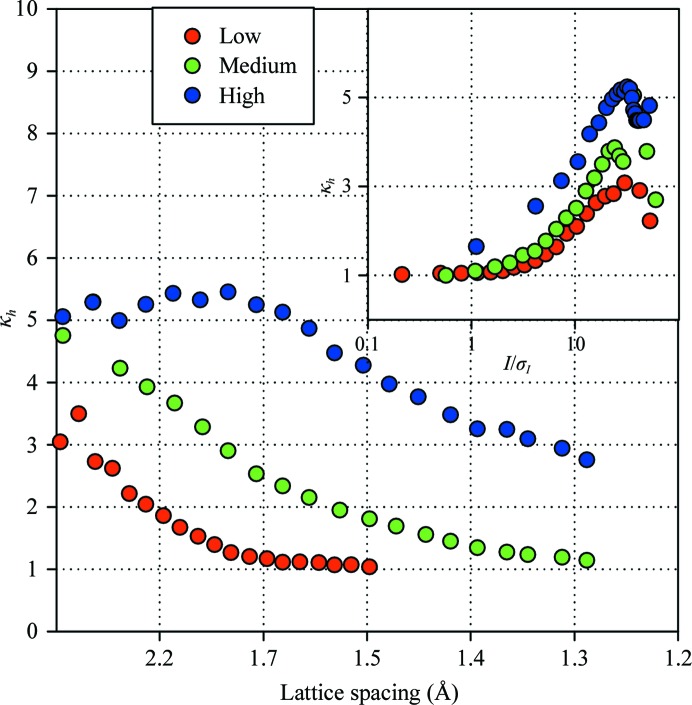
Data for HEWL crystals were collected using different incident-beam intensities, resulting in correspondingly stronger/weaker data overall. At all three signal levels studied in this work the magnitude of the error inflation consistently declined in higher resolution shells; however, the absolute values differed, suggesting that the degree to which errors need to be inflated are not uniquely defined by the scattering angle (see Fig. 3 ▶). The variance ratio is much more consistently reproduced as a function of the reflection amplitude. Moreover, the amplitude dependence is consistent when different proteins are compared in addition to HEWL at three signal levels. This suggests the possibility that the error inflation can be modeled as a universal function of the relative amplitude of a reflection. It is noteworthy that the highest resolution data sets are characterized by higher error inflation. These data sets were collected using the larger beam size, which may explain the increase in error inflation because a higher variation may be observed over larger illuminated crystal volume.
Figure 3.
Resolution and amplitude dependence of the variance ratio for three groups of data sets of low (red), medium (green) and high (blue) resolution/beam intensity.
3.5. Multiple data sets collected from a single crystal
Whilst every precaution was taken to ensure that the multiple crystals used for data collection were as similar as possible, it cannot be completely excluded that the observed variations arise from differences in both the crystal-growth conditions and the cryoprotection protocol. To minimize such crystal-to-crystal variations, two approaches were utilized.
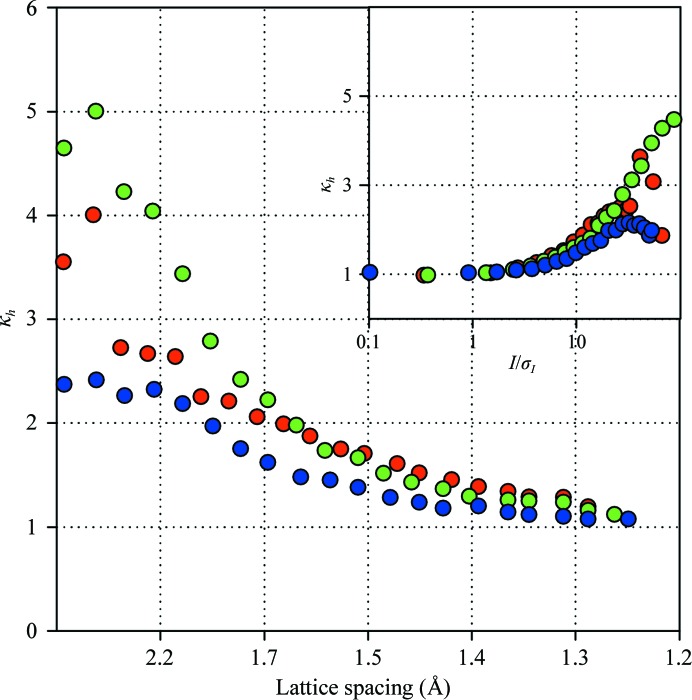
Firstly, a single HEWL crystal was intentionally shattered with a metal needle. Multiple smaller chunks were cryoprotected and used for data collection. The crystals thus obtained have been subjected to identical growth conditions in the same drop and their cryoprotection protocols were as identical as possible. Most interestingly, the observed error inflation remained essentially at the same level and exhibited the same resolution/amplitude dependence that was observed when multiple independently grown crystals were employed (see Fig. 4 ▶).
Figure 4.
Resolution and amplitude dependence of the variance ratio for data sets collected using fragments of a shattered HEWL crystal (red) and using independent illumination volumes of a HEWL crystal (green) and an FABP4 crystal (blue).
Secondly, multiple data sets were collected from a single rod-shaped FABP4 crystal by exposing different non-overlapping areas. These crystals mostly grew in the form of long rods with a cross-section of approximately 50 × 50 µm and a length of up to 1 mm. Using a 50 µm X-ray beam, up to 16 data sets could be collected by shifting the beam along a crystal oriented collinear with the stem of the cryoloop. Large HEWL crystals were also utilized in a separate set of experiments which included the use of a microfocused beam. The spatial gap between illuminated volumes was at least 10 µm, thus preventing the spread of radiation damage (Sanishvili et al., 2011 ▶).
In all cases, the behavior of the variance ratio remained the same as that obtained using the multi-crystal approach (see Fig. 4 ▶). This clearly demonstrates that subtle differences in crystal-preparation protocols are not the main source of the additional error that we observe. Apparently, the extra fluctuations of this amplitude in diffraction properties occur between different illuminated volumes. The exact nature of such variations remains beyond the scope of this report, but we can say with confidence that sufficient variations in crystal packing, shape etc. occur on the scale of tens of micrometres to produce the observed inflation in experimental errors. The overall level of error inflation was only slightly reduced, with the lowest values being obtained from the set of experiments utilizing the microfocused beam. This again indicates that the error inflation is likely to originate from spatial crystal variations.
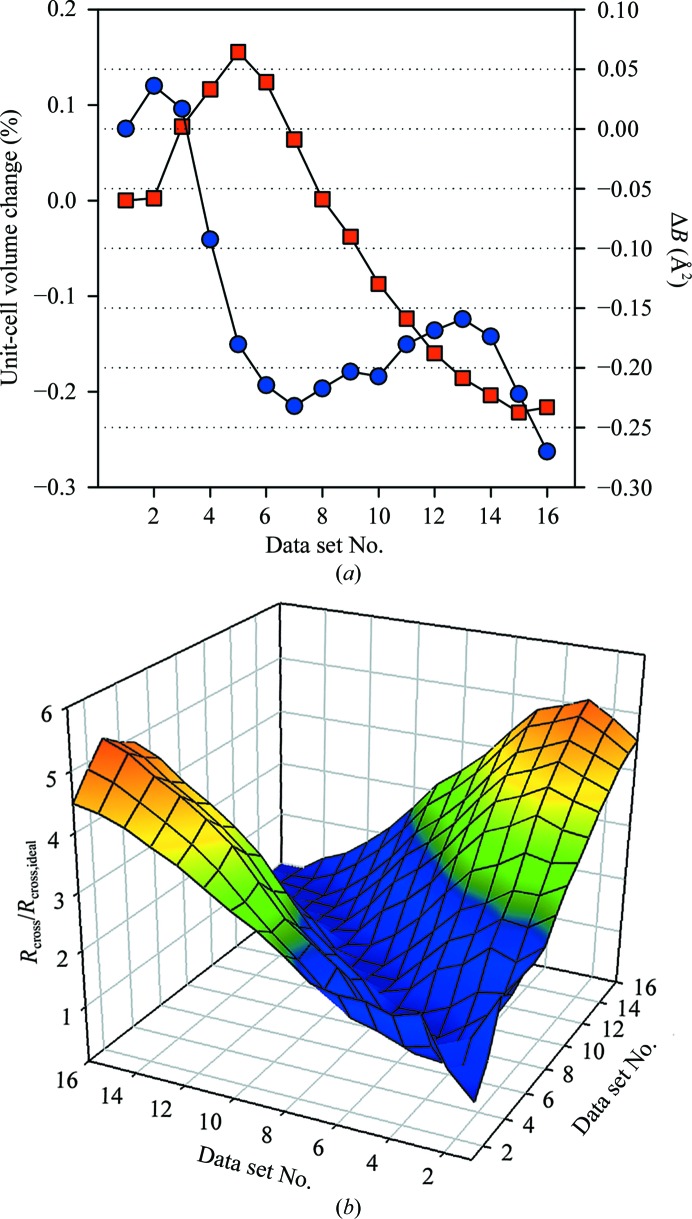
The data sets collected from multiple spots on a single crystal were scaled together as described above prior to analysis of the error inflation. A small trend in the relative temperature factor derived from (1) was observed upon scaling (see Fig. 5 ▶). Together with equally obvious small changes in the unit-cell parameters, this provides a clear indication that some discernible differences exist throughout the crystal. To determine whether the discrepancy among the data sets correlates with the spatial separation of the corresponding illumination volumes, the cross-data-set R value,
was normalized by its expected value (see Appendix A ),
 |
and is shown in Fig. 5 ▶(b). The analysis clearly shows that the independently collected data sets differ less when collected from nearby areas of the crystal. Importantly, even within a single crystal sufficient variation is present to produce significantly larger differences than expected from the predicted experimental errors.
Figure 5.
(a) An example of the trend observed in unit-cell volume (squares) and the relative scaling B factor (circles) for data sets collected from adjacent non-overlapping sections of the same HEWL crystal. (b) The relative increase in the R cross value compared with its expectation R cross,ideal is shown for pairwise comparisons of individual data sets.
3.6. Same crystal, same orientation (redundant data collection)
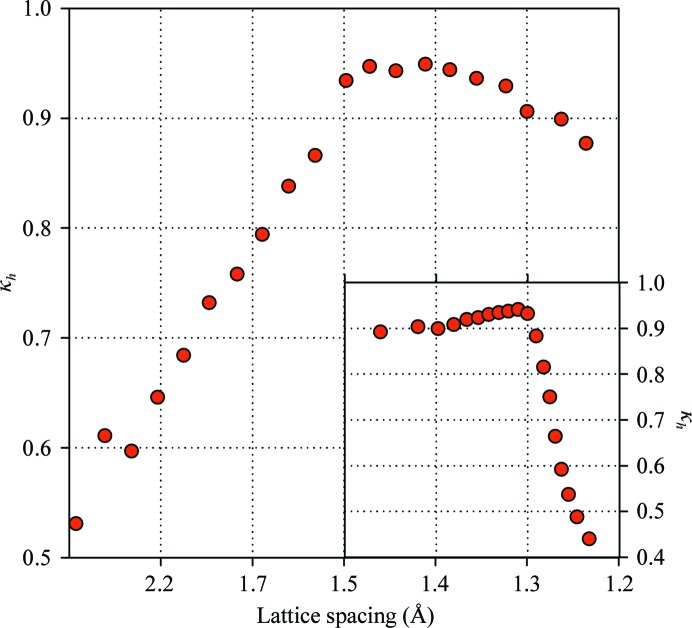
In this experiment, data sets were collected repeatedly using the same starting orientation and exactly the same parameters of data collection. For the data sets scaled to the reference 〈κh〉 was reduced to ∼0.8, indicating that the experimental errors are slightly overestimated by the data-processing programs. In Fig. 6 ▶ the κh in individual resolution shells is shown. It levels off below unity in the higher resolution shells, and it is important to emphasize that the worst inconsistency is observed in the lower resolution shells, in which the errors are overestimated the most. This correlates with the effect of relative amplitude. Fig. 6 ▶ also shows κh versus the I/σI ratio. It is clear that for high-precision reflections the errors are overestimated the most. Coincidentally, most such reflections are observed in lower resolution shells, so it is not immediately obvious which of the two variables influences the variance ratio the most.
Figure 6.
Resolution and amplitude dependence of the variance ratio for data sets collected using the same HEWL crystal (single-crystal redundant data collection).
This is dramatically different from what is observed for data sets collected from multiple crystals. Most importantly, the errors appear to be much better estimated for the redundant data collection. Arguably, this is what the data-processing algorithms are designed to do and thus we conclude that modern programs are quite adequate for the task. The errors are slightly overestimated, but this is acceptable for an experimentalist as it sufficiently guards against reaching unjustified conclusions owing to an overly optimistic view of the experimental uncertainties. The additional error identified by collecting data from multiple crystals can be characterized as the systematic error, which cannot be readily estimated from a single data set. Our observations suggest that the systematic error varies with the strength of a reflection in a universal way (although the overall error inflation varies with a crystal form) and an error-correction algorithm based on (7) can be proposed.
3.7. Cross-data-set R values
Are the R values in protein crystallography too high given the range of predicted experimental errors? It appears so since if the calculated structure-factor magnitudes are brought to within the experimental precision from the measured intensities the R value is expected to be (see Appendix A )
For most crystallographic data the 〈I〉/〈σI〉 ratio is in the range 10–50 and thus the expected R values should be as low as 1–4%. The fact that the actual R values are systematically higher by an order of magnitude leads to the widely accepted notion that modern macromolecular crystallographic models do not capture some as yet unknown property of protein molecules in the crystalline state, with anharmonic motions and proper bulk-solvent modeling considered to be the prime suspects.
Similarly, it is expected that the corresponding measure of the discrepancy between two independently collected data sets, R cross, should be close to the predicted value R cross,ideal (see equations 8 and 9 above). For all three studied crystal forms the R cross values are systematically higher than the expectation (see Table 1 ▶). In fact, the corresponding values are similar to the R values encountered in refinement. This hints at the possibility that the higher than expected R values in macromolecular crystallography are a consequence of systematic errors in the experimental data rather than the inadequacy of the ‘standard model’.
Table 1. Various R values for the three crystal forms.
R cross,ideal, R cross and R ideal were calculated using (9), (8) and (10), respectively. The reported values for the cross-data-set measures are averages over all possible pairwise data-set combinations; R ideal is averaged over all of the data sets. R inflated is the R ideal calculated using errors adjusted by the variance ratio. R cryst is the average R value obtained by refining corresponding structural models against individual data sets using REFMAC (Murshudov et al., 2011 ▶) for minimization and Coot (Emsley et al., 2010 ▶) for manual rebuilding as necessary. The relative standard deviation of the unit-cell volume (ΔV/V) among the crystals used in each case is also shown.
| R cross,ideal | R cross | R ideal | R inflated | R cryst | ΔV/V (%) | |
|---|---|---|---|---|---|---|
| TmGldA | 0.057 | 0.079 | 0.039 | 0.054 | 0.16 | 0.37 |
| FABP4 | 0.048 | 0.127 | 0.026 | 0.068 | 0.15 | 0.51 |
| HEWL | ||||||
| Low resolution | 0.095 | 0.113 | 0.066 | 0.081 | 0.17 | 0.36 |
| Medium resolution | 0.061 | 0.096 | 0.037 | 0.065 | 0.12 | 0.33 |
| High resolution | 0.019 | 0.071 | 0.012 | 0.049 | 0.11 | 0.17 |
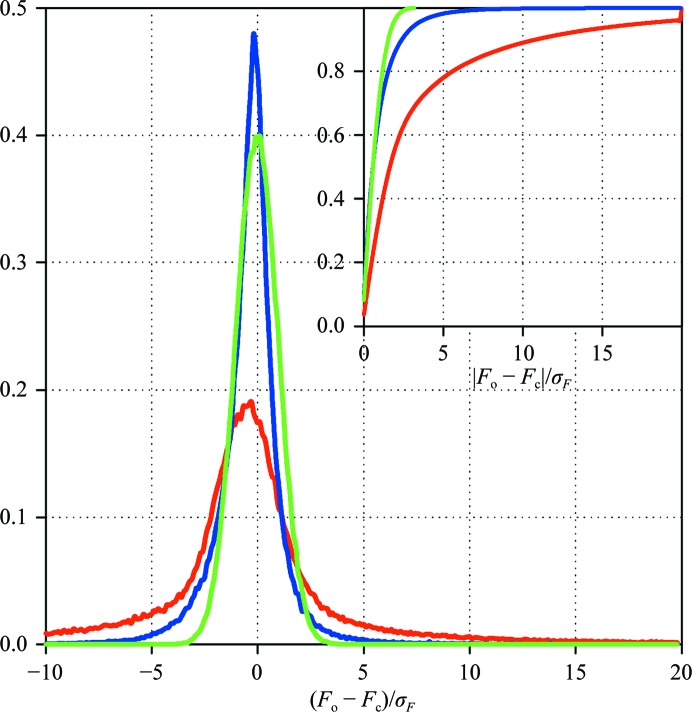
The availability of multiple data sets allows determination of the fraction of the difference between the observed and the calculated structure-factor magnitudes that arises from systematic errors (e.g. those originating from the inadequate nature of the crystallographic models). The structures of TmGldA, FABP4 and HEWL were all refined against multiple data sets. For every model the F o − F c difference was calculated for every reflection and normalized by the σF. When the original experimental errors were used, the corresponding distribution was much broader than the expectation based on normally distributed errors. With errors adjusted by the variance ratio the distribution was significantly narrowed, indicating that the largest discrepancy mostly occurs for reflections that have a significant error contribution from crystal-to-crystal variation (see Fig. 7 ▶).
Figure 7.
Distribution of the differences between the observed and the calculated structure-factor magnitudes normalized by the experimental errors (original, red; inflated, blue). The expected distribution for the normally distributed errors is shown in green. The inset shows the cumulative distribution function. The sample data shown were obtained for seven independent FABP4 crystal data sets.
4. Concluding remarks
Despite all of the advances in macromolecular crystallography in recent years, only the primitive form of model-error analysis in direct space is routinely utilized; namely, various estimates of the overall error of positional refinement (Luzzati, 1952 ▶; Murshudov & Dodson, 1997 ▶; Cruickshank, 1999 ▶). Obviously, this does not reflect the complexity of modern crystallographic models, in which different elements are likely to be determined with variable accuracy, and more detailed model-error analysis has been proposed and implemented (Sheldrick, 2008 ▶; Schneider, 2000 ▶). One of the reasons for this deficiency is the generally accepted notion that the systematic errors originating from the inadequacies of the standard crystallographic model (which includes multiple stereochemically restrained atoms undergoing harmonic oscillations around average positions and uniform electron density modeling the bulk solvent) far exceed the statistical errors in the experimental determination of the diffraction intensities. The presented work addresses the possibility that modern data-processing algorithms significantly underestimate the experimental errors, especially in lower resolution shells. Indeed, we have found that the variation in experimental data observed upon repetitive collection using multiple crystals produces significant error inflation. This does not mean that the data-processing algorithms are inadequate, but rather that they do not completely capture the larger variation associated with crystal inhomogeneity (Kriminski et al., 2002 ▶; Nave, 1998 ▶; Hu et al., 2001 ▶).
Simple estimates suggest that the target lower limit of the R values in macromolecular crystallography may be closer to 5–10%. For instance, for the multiple crystal experiments the expected R values given that the model predictions can be brought within experimental error were 5.4, 6.8 and 6.5% for the TmGldA, FABP4 and HEWL crystals, respectively (see Table 1 ▶). The corresponding characteristic R values obtained from refined protein structures were ∼16, ∼15 and ∼12%. While these are still significantly higher than the expected values, the gap between the two is greatly reduced and this indicates that the model error may be comparable to the experimental error.
Our finding that the variation of the measured intensities of X-ray diffraction by macromolecular crystals is significantly higher than the variation predicted by the modern data-processing algorithms begs the next question: what is the origin of the additional variation? This is an important question in order to consider possible ways of improving the error determination and perhaps even the data quality. Equation (7) provides a simple empirical way to evaluate the amplitude of the additional variation. For a strong reflection determined with about 10% error level, it predicts that the additional variation is at least ∼15% of the measured intensity (assuming the relatively low value for Δκ of ∼2.5). Several possibilities consistent with the experimental data are discussed below.
4.1. Changes in intensity owing to crystal shape
An X-ray photon has to travel through the crystal, and the longer the distance it has to travel the more likely it is to be absorbed. Hence, the shape of the diffracting object (including the surrounding solvent) will affect individual reflections non-uniformly depending on the path traveled by both the incident and the diffracted beams. Another contributing factor is the change in the crystal volume that is illuminated. Most of the variation arising from crystal shape is accounted for during scaling. In our tests, using different absorption-correction options as implemented in SCALA did not result in any significant reduction of the overall error inflation, indicating that either non-uniform absorption contributes little to the additional variation in intensities or that the existing methods are still unable to capture it correctly.
Given that an X-ray beam is attenuated by ∼1% when passing through 10 µm of a protein-crystal-like material, the 15% of additional variation in intensities would require about a 150 µm difference in beam-path length that cannot be accounted for by scaling. This is comparable to the size of the incident X-ray beam used in most experiments and such a large unaccounted variation in illuminated volume and absorption appears to be unlikely. It must be noted, however, that for the data sets collected using multiple sections of the rod-shaped FABP4 crystals the variance ratio was the lowest that we observed, which would be consistent with expected differential illumination/absorption. However, this may also reflect the more homogeneous nature of these crystals, and the variance ratios were significantly higher when the same experiment was performed using brick-shaped HEWL crystals.
4.2. Radiation damage
Precautions were taken to minimize the radiation damage experienced by crystals. In all cases, no significant increase in the scaling B factors or significant changes in unit-cell parameters during data collection were observed as would be expected in the presence of radiation damage (Sliz et al., 2003 ▶; Shimizu et al., 2007 ▶). It is also expected that additional variation resulting from minor radiation damage would be correctly captured by data-processing algorithms (from the discrepancies among symmetry-related reflections measured at different points during data collection). Another important observation is that the variance ratio did not exceed unity when multiple data sets were collected from the same crystal in an identical orientation (§3.6). Given that the same crystal was exposed 16 times and therefore absorbed a much higher dose, the lack of error inflation indicates that the variation introduced by radiation damage is either small in our experiments or is effectively accounted for by the data-processing programs.
4.3. Variation of unit-cell parameters
It has been estimated that a 0.5% change in the unit-cell parameters may produce a 10–15% change in the intensities of individual reflections (Crick & Magdoff, 1956 ▶). In all cases studied in this work, the effective relative unit-cell parameter variation [calculated from the relative unit-cell volume variation as (1 + ΔV/V 1/3 − 1 ≃ ΔV/3V)] was close to 0.1% (see Table 1 ▶). This indicates that unit-cell changes alone would not be able to account for the observed variance ratio in multiple data sets. It must be noted, however, that ‘crystal inhomogeneity’ as discussed below would also result in variation of the unit-cell parameters. Importantly, the unit-cell parameter variation was about an order of magnitude smaller when redundant data sets were collected using the same crystal in the same orientation (see §3.6).
4.4. Crystal inhomogeneity
This phenomenon may be understood fairly broadly and we do not suggest any specific mechanism resulting in the additional variation of the diffraction intensities. For instance, both static disorder and acoustic diffuse scatter (Glover et al., 1991 ▶) may contribute to our observations. Some of the sources of the variation discussed above may fall under this definition (e.g. variation of unit-cell parameters). As shown in Fig. 5 ▶(b), the R cross for the data sets collected from different sections of the same crystal increases with the spatial separation of the illuminated regions of the crystal. This suggests the possibility of non-uniformities present even within the same protein crystal.
Importantly, the contributions of all of the potential sources of additional variation discussed above are expected to be proportional to the intensity to some degree, making it difficult to distinguish between them. It is also most likely that several factors contribute to the increased variation simultaneously. However, no matter what the origin of the additional error in the intensities of the X-ray diffraction exhibited by macromolecular crystals as measured by modern methods, it is much larger than the error predicted from a single data set and appears to explain at least to some extent why the R values in macromolecular crystallography are higher than one expects.
Acknowledgments
We thank Dr Mark Wilson and the anonymous referees for their valuable comments on the manuscript and their constructive suggestions. Portions of this research were carried out at the Stanford Synchrotron Radiation Laboratory, a national user facility operated by Stanford University on behalf of the US Department of Energy, Office of Basic Energy Sciences. The SSRL Structural Molecular Biology Program is supported by the Department of Energy, Office of Biological and Environmental Research and by the National Institutes of Health, National Center for Research Resources, Biomedical Technology Program and the National Institute of General Medical Sciences.
Appendix A. Estimation of ideal R values
We assume that a perfect model is available and therefore the only remaining source of discrepancy between F o and F c is the experimental error in the observed diffraction intensities. The simplest estimate can be obtained by assuming that the F os are normally distributed with a standard deviation of σF around the true value of the structure-factor magnitude F c. F o is a positive number and the distribution function is appropriately scaled. The expectation of the absolute value of the discrepancy between the observed and predicted structure-factor magnitudes can then be calculated as follows:
After normalizing by σF, this can be presented as (F o = xσF, F c = ασF),
Specifying t = x − α and using the scaled normal distribution,
 |
we obtain
 |
A more accurate estimate can be obtained from the conditional probability given by a σF-inflated Rice distribution (Murshudov et al., 1997 ▶),
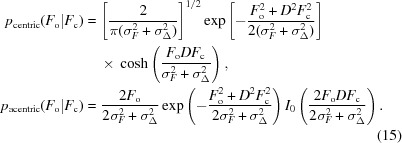 |
For a perfect model σΔ = 0 and D = 1 and we obtain for the corresponding probabilities of the observed amplitudes
 |
After normalization by σF these distributions take the following shape:
 |
For the centric reflections,
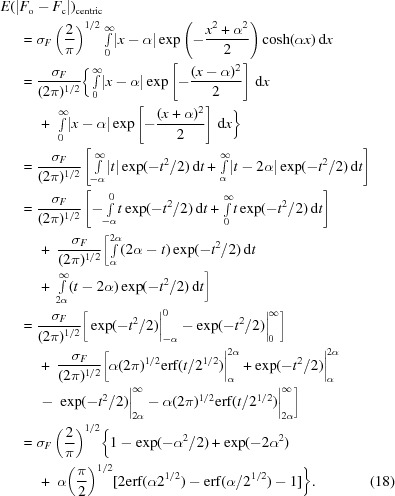 |
For the acentric reflections there is no analytical expression for the corresponding integral,
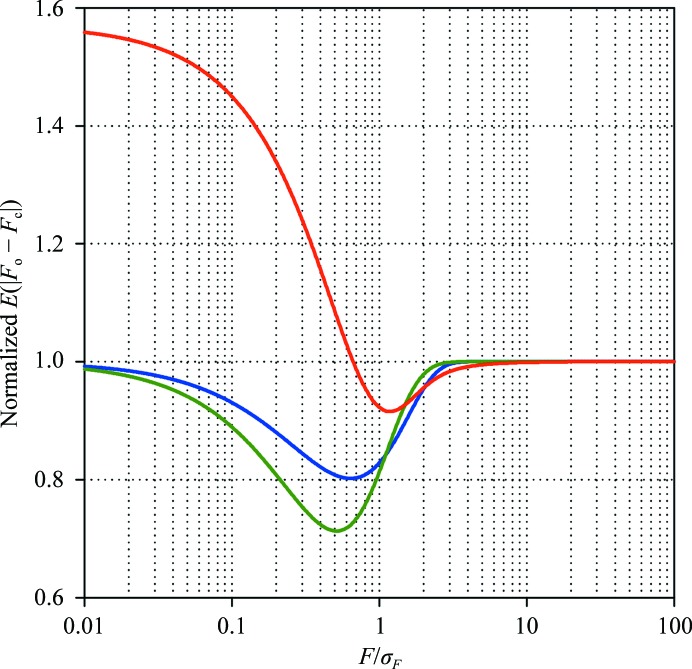
which can be estimated numerically. A comparison of estimates based on the normal distribution and the Rice distribution for the centric and acentric reflections is shown in Fig. 8 ▶. A trivial approach that would ignore the absence of negative structure-factor magnitudes and the fact that the calculated structure factors are governed by the Rice distribution would produce a horizontal line at unity, since in such a simplified approach E(|F o − F c|) = (2/π)1/2σF. As expected, for the stronger reflections (F/σF > 2) the trivial estimate is acceptable, since the Rice distribution then resembles the normal distribution. To verify that the trivial estimate of the R ideal works well, we have compared it with the Rice-distribution-based estimate for ∼250 data sets from the PDB. We found that the two estimates differed by ∼0.01% of the predicted R ideal value. Thus, (10) provides a sufficiently accurate estimate of the expected R value.
Figure 8.
Expected absolute value of the difference between the calculated and the observed structure-factor magnitudes given a perfect model, normalized by σF(2/π)1/2. The three approximations are based on the normal distribution (blue) and the centric (green) and acentric (red) Rice distributions.
To obtain an estimate of R cross,ideal, we assume that the structure-factor magnitudes from two data sets are normally distributed. Taking into account that the R value is defined by the absolute value of the difference between two measurements, one can demonstrate that
 |
Again, we find that the correction introduced by the more complicated formula is negligible and that the simplistic estimate is sufficiently accurate.
References
- Bai, G., Feng, B., Wang, J. B., Pozharski, E. & Shapiro, M. (2010). Bioorg. Med. Chem. 18, 6756–6762. [DOI] [PubMed]
- Battye, T. G. G., Kontogiannis, L., Johnson, O., Powell, H. R. & Leslie, A. G. W. (2011). Acta Cryst. D67, 271–281. [DOI] [PMC free article] [PubMed]
- Bricogne, G. & Gilmore, C. J. (1990). Acta Cryst. A46, 284–297.
- Cowtan, K. (2005). J. Appl. Cryst. 38, 193–198.
- Crick, F. H. C. & Magdoff, B. S. (1956). Acta Cryst. 9, 901–908.
- Cruickshank, D. W. J. (1999). Acta Cryst. D55, 583–601. [DOI] [PubMed]
- Emsley, P., Lohkamp, B., Scott, W. G. & Cowtan, K. (2010). Acta Cryst. D66, 486–501. [DOI] [PMC free article] [PubMed]
- Evans, P. (2006). Acta Cryst. D62, 72–82. [DOI] [PubMed]
- French, S. & Wilson, K. (1978). Acta Cryst. A34, 517–525.
- Glover, I. D., Harris, G. W., Helliwell, J. R. & Moss, D. S. (1991). Acta Cryst. B47, 960–968.
- Glykos, N. M. (2011). Acta Cryst. D67, 739–741. [DOI] [PubMed]
- Holyoak, T., Fenn, T. D., Wilson, M. A., Moulin, A. G., Ringe, D. & Petsko, G. A. (2003). Acta Cryst. D59, 2356–2358. [DOI] [PubMed]
- Hu, Z. W., Thomas, B. R. & Chernov, A. A. (2001). Acta Cryst. D57, 840–846. [DOI] [PubMed]
- Jiang, J.-S. & Brünger, A. T. (1994). J. Mol. Biol. 243, 100–115. [DOI] [PubMed]
- Kabsch, W. (2010). Acta Cryst. D66, 125–132. [DOI] [PMC free article] [PubMed]
- Kriminski, S., Caylor, C. L., Nonato, M. C., Finkelstein, K. D. & Thorne, R. E. (2002). Acta Cryst. D58, 459–471. [DOI] [PubMed]
- Lesley, S. A. et al. (2002). Proc. Natl Acad. Sci. USA, 99, 11664–11669.
- Leslie, A. & Powell, H. (2007). Evolving Methods for Macromolecular Crystallography, edited by R. J. Read & J. L. Sussmann, pp. 41–51. Dordrecht: Springer. doi:10.1007/978-1-4020-6316-9.
- Levin, E. J., Kondrashov, D. A., Wesenberg, G. E. & Phillips, G. N. (2007). Structure, 15, 1040–1052. [DOI] [PMC free article] [PubMed]
- Lunin, V. Y., Afonine, P. V. & Urzhumtsev, A. G. (2002). Acta Cryst. A58, 270–282. [DOI] [PubMed]
- Lunin, V. Yu. & Skovoroda, T. P. (1995). Acta Cryst. A51, 880–887.
- Luzzati, V. (1952). Acta Cryst. 5, 802–810.
- Murshudov, G. N. & Dodson, E. J. (1997). CCP4 Newsl. Protein Crystallogr. 33, 31–39.
- Murshudov, G. N., Skubák, P., Lebedev, A. A., Pannu, N. S., Steiner, R. A., Nicholls, R. A., Winn, M. D., Long, F. & Vagin, A. A. (2011). Acta Cryst. D67, 355–367. [DOI] [PMC free article] [PubMed]
- Murshudov, G. N., Vagin, A. A. & Dodson, E. J. (1997). Acta Cryst. D53, 240–255. [DOI] [PubMed]
- Nave, C. (1998). Acta Cryst. D54, 848–853. [DOI] [PubMed]
- Otwinowski, Z. & Minor, W. (1997). Methods Enzymol. 276, 307–326. [DOI] [PubMed]
- Pannu, N. S. & Read, R. J. (1996). Acta Cryst. A52, 659–668.
- Sanishvili, R., Yoder, D. W., Pothineni, S. B., Rosenbaum, G., Xu, S., Vogt, S., Stepanov, S., Makarov, O. A., Corcoran, S., Benn, R., Nagarajan, V., Smith, J. L. & Fischetti, R. F. (2011). Proc. Natl Acad. Sci. USA, 108, 6127–6132. [DOI] [PMC free article] [PubMed]
- Schneider, T. R. (2000). Acta Cryst. D56, 714–721. [DOI] [PubMed]
- Sheldrick, G. M. (2008). Acta Cryst. A64, 112–122. [DOI] [PubMed]
- Shimizu, N., Hirata, K., Hasegawa, K., Ueno, G. & Yamamoto, M. (2007). J. Synchrotron Rad. 14, 4–10. [DOI] [PubMed]
- Sivia, D. S. & David, W. I. F. (1994). Acta Cryst. A50, 703–714.
- Sliz, P., Harrison, S. C. & Rosenbaum, G. (2003). Structure, 11, 13–19. [DOI] [PubMed]
- Vitkup, D., Ringe, D., Karplus, M. & Petsko, G. A. (2002). Proteins, 46, 345–354. [DOI] [PubMed]
- Wilson, A. J. C. (1942). Nature (London), 150, 152.


