

Abstract
The mapping and analysis of supply chains is a technique increasingly used to address problems in the food system. Yet such supply chain management has not yet been applied as a means of encouraging healthier diets. Moreover, most policies recommended to promote healthy eating focus on the consumer end of the chain. This article proposes a consumption-oriented food supply chain analysis to identify the changes needed in the food supply chain to create a healthier food environment, measured in terms of food availability, prices, and marketing. Along with established forms of supply chain analysis, the method is informed by a historical overview of how food supply chains have changed over time. The method posits that the actors and actions in the chain are affected by organizational, financial, technological, and policy incentives and disincentives, which can in turn be levered for change. It presents a preliminary example of the supply of Coca-Cola beverages into school vending machines and identifies further potential applications. These include fruit and vegetable supply chains, local food chains, supply chains for health-promoting versions of food products, and identifying financial incentives in supply chains for healthier eating.
Keywords: food system, food supply chain, diet, obesity, Coca-Cola, globalization, food industry, food policy, food history, financial incentives, interventions
INTRODUCTION
Today, more than two thirds of adults and more than one third of children in the United States are considered overweight or obese and rates are continuing to rise.1,2 Obesity has become a global problem, rising throughout Western counties and the developing world.3 Some real efforts are being made to address obesity, but examples of programs or policies that have successfully led to reductions of obesity remain few. In part this can be attributed to a food and beverage environment conducive to unhealthy eating. The food environment is not easy to change given that it is the net outcome of numerous processes, including the dynamics of the food supply chain. Yet efforts made to improve this food environment have thus far typically focused only on the consumer end of the chain.
This article develops a method that can be used to (1) identify innovative interventions throughout the food supply chain to create a healthier food environment and (2) improve existing interventions rendered less effective by their lack of consideration of the dynamics of the food supply chain. (Food is taken to mean all foods and nonalcoholic beverages for human consumption.) The analysis, provisionally termed consumption-oriented food supply chain analysis, follows from established supply chain approaches to problem solving in the food system. Such approaches are well established in the food industry. Supply chain management uses the supply chain as an organizing concept for identifying wherein business operations costs can be saved and profits accrued.4 The management system of Efficient Consumer Response was, for example, adopted by leading supermarkets in the 1980s and 1990s to increase the efficiency of their supply chain.5 Value chain analysis is a part of supply chain management that focuses on identifying where products gain value in the supply chain.6 The value chain approach has since been adapted by economic sociologists to study power relations in global food (and other) chains and the interactions between the actors in these chains. Their aim is to shed light on the socioeconomic and environmental consequences, such as working conditions, and identify leverage points for improved business practices.7–9 Researchers concerned with agriculture and international development have also used this value chain approach to identify how export-oriented food chains in developing countries affect employment and other development issues.10 And the development of local value chains is at the heart of movements in the United States and elsewhere to develop more sustainable, locally oriented food supply chains.11
Food supply chains are increasingly analyzed for their environmental impact and sustainability. Life cycle assessment is a technique for examining the environmental impact of foods (and other products) throughout their life cycles.12 A related form of analysis is carbon footprinting, used by food companies and others to examine where greenhouse gas emissions are located along the food supply chain.13 Product roadmapping is another form of supply chain analysis that aims to increase the sustainability of supply chains.14 The practice of sustainable public procurement also takes a supply chain approach to increase the efficiency and sustainability of sourcing sustainable, healthy meals for public institutions.15 Another application of supply chain analysis is identifying and preventing food safety risks. The technique of hazard analysis at critical control points (HACCP), for example, maps out the supply chain in order to identify potential points of entry of pathogens and other hazards and then identify measures to mitigate these risks.16
Though all these applications are different, they share the common objective of identifying points in the chain that can be levered for change. The underlying concept is that it is only by mapping the whole chain, and understanding the interactions within that chain as a system, that the most effective leverage points can be identified. The basis of this concept can be traced to systems analysis, which posits that any system—such as a food system, a city, an ecosystem—must be analyzed as an interconnected whole, not as a reductionist collection of independent components linked by direct causality. The analysis also posits that systems contain leverage points where “a small shift in one thing can produce big changes in everything.”17(p. 1) These leverage points are considered to often exist in places not at all obvious, and they may be counterintuitive. The methodology developed here accepts this view, but, taking on board the supply chain approach, stresses the concept of action throughout the chain—that though one point could be enough, leveraging a series of points may be needed to create coherent change along the chain, and it is this coherence which then creates a tipping point for change. The method also adopts the economic concept of incentives and disincentives as the best way to articulate a leverage point for change.
Another critical aspect of the methodology is that unlike other applications, it focuses on identifying how food supply chains could be leveraged to alter food consumption. Despite the increasing application of supply chain analysis to food systems issues, there has thus far been no serious effort to examine how such analyses could be used to leverage healthier diets (also see Gereffi et al., 20099). There have been analyses in the other direction—examining how food consumption patterns affect the food supply—but not in the direction from supply to demand.18–20 This gap reflects one of the core problems of modern food supply chain management: that human health remains marginalized as a supply chain issue, falling into the gaps between the different processes and actors in the chain (in contrast to the environmental and labor issues now perceived as supply chain issues).21 How to alter supply chain dynamics to encourage healthier eating thus represents a gap that needs to be filled.
The article starts by describing the concept of food supply chains and then examines how they have changed over time in the United States in the context of rising obesity. Using insights gained from the historical overview, the article then explores why the food supply chain has the potential to be leveraged to improve the food environment. It then explains how this can be done and develops a 5-step method for conducting what is provisionally termed consumption-oriented food supply chain analysis. It then discusses potential applications of the analysis, including a preliminary examination of the supply of Coca-Cola beverages into school vending machines.
WHAT IS A FOOD SUPPLY CHAIN?
A food supply chain can be defined as the processes and actors that take a food from farm to fork. The basic steps in a food supply chain are
Inputs into agricultural production: These include natural resource inputs, such as land and water; human inputs, such as labor; and external inputs, such as seeds, fertilizers, pesticides, and mechanized vehicles.
Agricultural production: This includes the production of arable crops (grains, oilseeds), horticulture (fruits, vegetables), fish (farmed, wild), meat, and dairy.
Inputs of nonfood aspects of the product and its distribution: A good example would be food packaging (aspect of the product) or vending machines (its distribution).
Primary food storage and processing: This includes refrigeration and freezing (perishable foods), canning (e.g., vegetables), slaughtering (meat), milling (flour), and crushing (oilseeds).
Secondary food processing: Notably the manufacturing of highly processed foods such as cookies, snacks, and prepared foods.
Distribution, transport, and trade: Such as by truck from farm to a local market or from packing house to warehouse or by plane to another country.
Food retailing: This includes local markets, small stores, supermarkets, as well as catering operations such as restaurants, hospitals, schools. It may also include wholesaling.
Food promotion and labeling: Such as advertising, sales promotions, nutrition labeling, and health claims.
A simplified arrangement of these basic steps is shown in Figure 1a. Food supply chains can also be characterized by the actors responsible for the different steps; as shown by Figure 1b, there are many—and this is not an exhaustive list. The entire chain is also affected by cross-cutting inputs, notably capital and natural and human resources. What is critical is that the food supply chain is not viewed as a linear, deterministic arrangement (despite its depiction in Figure 1) but as a system in which the different components are profoundly interconnected, with a change in one part of the chain affecting other parts, whether intentionally or not.
FIGURE 1.
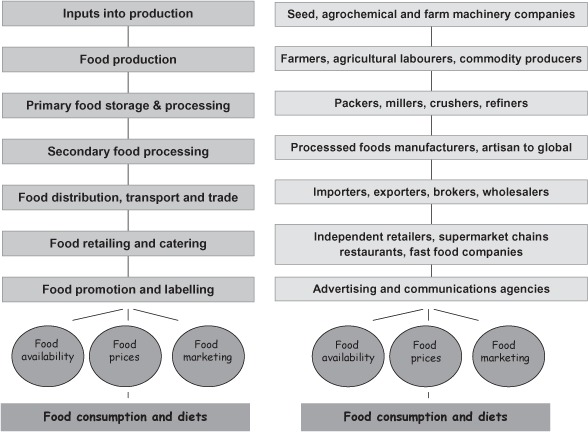
A basic food supply chain. (a) Process-based food supply chain. (b) Actor-based food supply chain.
Though most food supply chains comprise the same basic steps, they take many different forms. These differences arise from variations in the food product, scale, level of detail, etc., and, importantly, the reason for mapping and analyzing the chain in the first place. For example, the differing objectives of food supply chain analysis discussed in the introduction all lead to different-looking chains.
WHY LEVERAGE THE FOOD SUPPLY CHAIN TO PROMOTE HEALTHY DIETS?
Basic Rationale
The reason for leveraging food supply chains to promote healthy eating is because they affect key aspects of the food environment in which people make food choices: food availability (the range of foods available in the marketplace), food prices (food retail prices), and food marketing (how food is sold through retail channels, labeled, and promoted). A further reason is that there are points in the chain that can be leveraged for change. As indicated by existing analyses, this rationale is best illustrated by looking at how food supply chains have changed over time.22,23 Here, the example of the basic changes in the American food supply chain over the past two centuries is provided to show how food supply chain characteristics affect the food environment (Figure 2). This example also provides insights that support the development of the subsequently described method of consumption-oriented food supply chain analysis.
FIGURE 2.
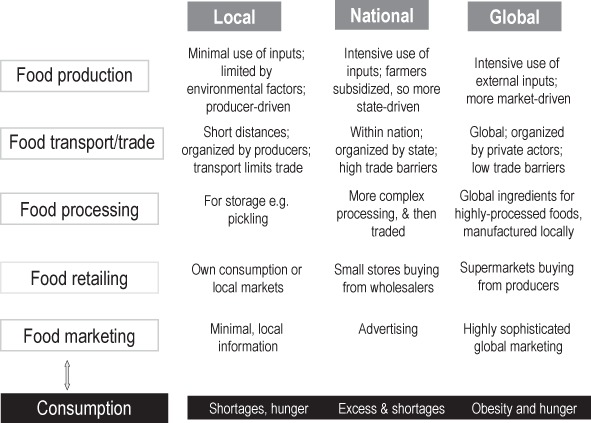
Broad historical shifts in the American food supply chain, from local to national to global.
Historical Overview
Prior to the 19th century, local food chains were the norm in America. Most Americans lived on farms and were self-sufficient; town-dwellers patronized public markets or had their own gardens. The degree of food transportation was relatively small and food processing limited to home drying, canning, and pickling.24,25 Revolutions in transportation in the 19th century changed all this, essentially nationalizing the chain. The development first of canals and then of railroads and refrigeration enabled fresh meat, fruits, and vegetables to be transported all over the country and to be available to consumers at lower prices. As the decades continued, agricultural research led to new breeds of crops and livestock. Cold-storage warehouses appeared in the 1850s and new canning technologies in the 1860s. A&P, the country's first grocery chain, appeared in 1869.24,25
Into the 20th century, processing giants like Kellogg's, Post, and Heinz emerged, producing canned and packaged goods on a mass scale, so replacing the sale of loose products from bulk packages weighed out by store clerks. In the 1920s onwards, as mass production created more products than “need” and food packages provided a place to stamp a brand, food branding and advertising became the way to compete for the consumer dollar. Billboards, newspaper and radio advertisements, premium giveaways, and enticing packaging could now be used to create demand for the wealth of new packaged products. By the 1930s, inexpensive diners, cafes, and hamburger joints had sprung up, and the 1950s saw the introduction of frozen TV dinners and McDonald's.24,25
This was also the era that saw the beginning of the big farm commodity programs that still characterize agricultural policy in the United States. The Agricultural Adjustment Act (AAA) of 1933 provided subsidies to incentivize farmers to expand production. Technological developments of agricultural inputs over next decades (e.g., fertilizers) further encouraged greater production. Farming became increasingly intensive and industrial, in turn affecting the availability and farmgate prices of the subsidized crops, such as wheat and soybeans.
The second half of the 20th century saw important changes in the way that the entire food chain was organized in the United States.26–28 Most importantly, the power in the chain shifted away from the farm to the food-consuming industries—the primary processors, manufacturers, and retailers who “consume” the products produced by the earlier steps in the chain. Horizontal and vertical integration and consolidation led to increased levels of industry concentration. By 1997, four companies controlled 60% of all hog slaughtering in the United States,26 and in 2000, the top 5 food retailers controlled 40% of food sales.27 Primary food processors also diversified into different steps of the chain, enabling them to control the supply of their foods from farm to retail.28 These higher levels of consolidation and concentration, combined with the effect of the big commodity programs, put pressure on farm size—very large family farms accounted for 45% of production in 2003, up from 32% in 1989—while the size of the farming population fell.29,30
This reorganization of the food supply chain meant that the financial costs in the chain moved away from the farm. Between 1980 and 1999, post-farm costs (e.g., labor, packaging, advertising, corporate profits) rose 45% relative to 13% for on-farm costs, with the largest increase coming from pretax corporate profits (rising 98%). By 1999, 80% of the prices consumers paid for foods reflected on-post-farm costs.31 So despite declining production costs and the downward pressure on prices stemming from competition among retailers, food retail prices rose.32,33
From here, it was a short step to the globalization of America's food supply chain. US food companies began to buy up companies in other countries, thus increasing their global reach and power.28,34 Exports increased as well, as agricultural policy, combined with high levels of technological and organizational efficiency, continued to promote the production of surplus relative to domestic need.27,35 Successive governments pursued the policy of opening foreign markets for American products through the World Trade Organization and bilateral trade agreements (e.g., the North American Free Trade Agreement), which also opened up the country to imports. The development of cold chain technologies now allowed highly perishable products like seafood and fruits and vegetables to be flown in from all over the world. As a result, Americans began to consume more of the fruits—like grapes— now available beyond the US seasons and/or at lower prices than US products.36 The process also allowed US food processors to rely more on ingredients sourced from overseas, cutting their costs of production.35
This shift to the global model involved more than just more imports and exports. It represented a political, economic, and ideological shift— essentially a paradigm shift—that favored the development of a market-oriented, economically efficient, and competitive food supply chain, a chain that lowers the costs of production and produces a consistent supply of a plethora of foods (many of them highly processed and based on common ingredients), proactively marketed to consumers.37 Even though the majority of food is not imported in the United States, and local chains are reemerging, it is this global model that now dominates the way food is produced and provided in the United States and many parts of the world.
Characteristics and Incentives in the Food Supply Chain
Between them, these changes over time affected the foods available in the United States, their prices, and the way they were marketed. The historical analysis shows that the crucial changes were organizational (the way the chain is organized and where the power lies), financial (where the costs, profits, and value lie in the chain), technological (the degree and type of technological inputs used in the chain); and in policy (the legal instruments, regulations, and policies that affect the chain). For example, organizationally, the chain became more horizontally and vertically integrated and, financially, the costs in the chain moved off the farm. The use of technology helped overcome the constraints imposed by the natural environment and facilitated the growth of mass production, while agricultural and trade policies altered incentives to farmers. These four sets of characteristics are thus used as an organizing principle for the methodology.
This in turn leads to the concept of incentives and disincentives in the chain. The important question here is not how food supply chains behave but why. It is this why that is the focus of the analysis part of consumption-oriented food supply chain analysis. To understand the why, it is necessary to go beyond description and enter an analytical framework of identifying the incentives and disincentives to the behavior of the different actors in the chain. The incentives and disincentives stem from the characteristics of the chain:
Organizational incentives: The incentives that actors have to organize themselves in specific ways, such as consolidating to increase their competitive advantage.
Financial incentives: Such as seeking profit, adding value, and cutting costs.
Technological incentives: The incentives presented by new technological innovations.
Regulatory/policy incentives: The incentives created by new regulations, policies, or legal decisions, as well as the disincentives they may present.
A fifth group of incentives are the incentives that come from consumers. These are different in that they are not incentives within the food supply chain but incentives that affect it. Indeed, it is often posited that it is consumer demand that drives the food supply chain rather than the other way around.38 Though this concept is problematic in that it implies that consumers make entirely independent decisions about what they want and buy, it is unquestionably the case that, in their lifestyles and through their buying power, consumers affect the food supply chain. The rise of suburban living in the 1950s, for example, was an important demographic change that changed the nature of demand from consumers, as did many other cultural, economic, and social factors. Here, though, it is understood that the supply and demand side are integrated, with both acting together to shape the environment in which consumers make their choices. For example, though the food supply chain has a strong influence on food retail prices, prices also reflect the degree of consumer demand and willingness to pay (an expression of value, not just prices). In turn, the ability to actually afford and access the food is affected by economic characteristics of households and communities.
Another important factor identified through the historical overview is that important shifts in outcomes of the food supply chain occur in response to mutually complementary changes throughout the chain. Take, for example, the rising production and consumption of packaged, processed foods and the decline of loose, unbranded primary processed foods. This pivotal shift was not just the result of the introduction of packaging technologies but of the rise of advertising, the introduction of supermarket retailing, the availability of low-cost ingredients—all operating in a consistent direction. These mutually reinforcing changes led to coherent incentives throughout the chain that provided a tipping point for change. The lesson here is that degree of coherence between the incentives in different steps in the chain is an important factor determining whether and what changes will take place and why chains behave and differ as they do. This in turn suggests that incentives in parts of the chain can be undermined by disincentives elsewhere, preventing change, and thus that the chain must be levered in a coherent manner to create long-term, sustainable changes to the food environment, consumer preferences, purchasing behaviors, and food consumption habits at the population level. There are two general approaches to do so. One is to intervene at several points along the chain to line up the incentives; the second is to implement just one or a small number of actions that introduce incentives or remove disincentives so significant that it has a ripple effect throughout the chain.
CONDUCTING A CONSUMPTION-ORIENTED FOOD SUPPLY CHAIN ANALYSIS
Basic Method
A consumption-oriented food supply chain analysis comprises 5 key steps:
-
1.
describing the steps in the chain from farm to fork;
-
2.
describing the organizational, financial, technological, and policy characteristics of the processes and actors in each step of the chain and the characteristics of the consumers;
-
3.
identifying the organizational, financial, technological, and policy incentives and disincentives within the chain (where they are, what they are), and how they interact with consumer incentives;
-
4.
analyzing how these characteristics and incentives and disincentives affect the food environment: food availability, prices, and marketing;
-
5.
identifying how these incentives could be leveraged to better align the food supply chain with healthy diets (what and who is needed to lever change).
The development of this analysis, and the concepts on which it is based, has been necessarily very general. To help identify specific levers to encourage healthy eating, the method needs to be applied to solve specific problems in the food environment. The supply of Coca-Cola beverages into school vending machines is used here to show how the method works. The availability of sweetened soft drinks in school vending machines has long been cause for concern among health advocates in the United States and elsewhere. Although there has been considerable activity in the United States and around the world to reduce this availability, efforts have focused on the consumer end of the chain rather than on reducing the incentives in supply chains.39 A consumption-oriented supply chain analysis could contribute to understanding what these incentives are. The presented analysis is not complete, because it is intended to simply illustrate the method. A fully comprehensive systems approach would require greater consideration of other soft drinks companies and other actors in the chain (such as soft drink distributors and vending machine operators), the influences on soft drink consumption outside the school environment in the broader food system, and, for all of these aspects, more in-depth information from stakeholder interviews.
Testing the Method
Step one
The first step is to describe the steps in the supply chain, as done in Figure 3. As shown, the Coca-Cola Company (“the Company”) and the bottlers are legally and managerially separate entities, albeit codependent. There are many bottlers, although increasing consolidation means that Coca-Cola Enterprises now holds 80% of the US market. The Company is responsible for manufacturing the concentrate and marketing, and the bottlers bottle and distribute the product to retailers (termed customers by the Company). Retailers comprise wholesalers, restaurants (fountain sales), stores (supermarkets, small shops, etc.) and vending machines. Thus it is the bottlers, and their distributors, that distribute soft drinks into school vending machines, not the Company.
FIGURE 3.
The Coca-Cola supply chain.
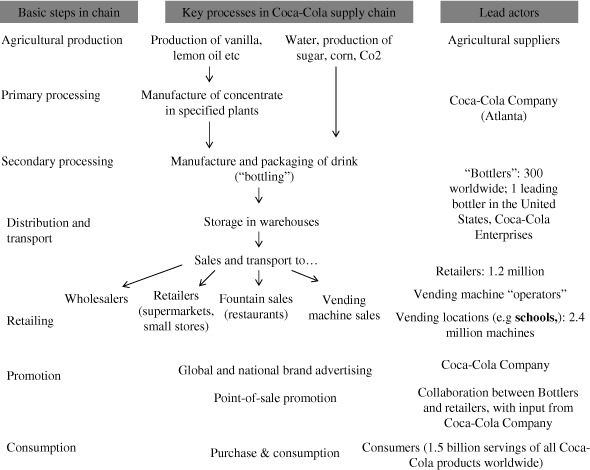
Source: Dervied from publicly available information from the Coca-Cola Company.40–45
Step two
The second step is to describe the organization, financial, technological, and policy characteristics of the processes and actors in each step, while also taking account of the role of consumer characteristics. The Coca-Cola Company is (just) the leader in a highly concentrated soda market (35.7% of the market relative to Pepsi's 34.7%).46 Considered one of the worlds leading brands,47 the Coca-Cola Company sells over 3000 beverage products in over 200 countries, with leading brands in the United States being Coca-Cola classic, Diet Coke, Sprite, and Fanta.48
Within the chain, the Company is the most powerful actor: there is only one Company relative to the multiple actors in the other steps in the chain, and it owns the brand and the concentrate formula. Lacking these characteristics, bottlers are less powerful. This weaker power relation is formalized by the legal contracts between the Company and the bottlers, which determine the conditions under which the bottlers operate. For example, the contracts prevent bottlers from producing, distributing, or handling cola products in their territories other than those of the Company, provide the Company with the right to establish concentrate prices, and require the bottlers to place a specified number of vending machines.
Both the Company and the bottlers are more powerful than the actors in the earlier part of the chain—the agricultural and product suppliers—and the later part of the chain—the retailers etc. At a basic level this is because there are many more suppliers and retailers than bottlers and so they have less bargaining power. It is notable, though, that the Company has expressed concern that the increasing consolidation among retailers and their increasing bargaining power—especially in the case of Wal-Mart—could affect their profitability.40 Vending machines present an interesting case: they are different to standard retail customers in that they are vehicles through which beverages are sold directly to consumers housed in a third-party setting. As a third-party setting, schools are relatively small, unconsolidated operations with little expertise of contracting arrangements and often desperate for new funds. As such they are in a relatively weak position to bargain about the conditions of housing the machines. In most cases, the contracts between the bottler and the schools formalize this weaker power relation.
The financial costs in the chain reflect these organizational characteristics. The costs of ingredients and packaging are relatively low (albeit rising). Production and distribution costs are relatively high but are borne by bottlers. This means that the Company benefits from high sales volumes while incurring relatively low capital costs (even though this includes the cost of developing new products). This, in turn, frees up significant funds for marketing and explains why the Company is able to spend so much on advertising: the Company spent $776.8 million on advertising and just in measured media in 2007, not including the money it provided to bottlers for promotional activities.49 This cost distribution in the chain leads to huge net operating revenues for the Company ($31.9 billion in 2008) and profit margins (64.4% in 2008)50 with the bottlers gaining a lower but still high profit margin (36.9% in 2008) and large revenues ($28.1 billion in 2008).51 Retail stores generally have low margins, but the relatively lower costs of provided drinks through vending machines makes them a high margin channel for bottlers.
There are many technological characteristics of the chain, but of particular relevance here is vending technology. Originally invented in 1888, vending machines have since become technologically very sophisticated, with wireless cash accounting methods, the ability to vend a wide range of package sizes and a wide selection of beverages, and innovative payment methods.
Policy characteristics of the chain also play a role. An important but often overlooked regulation is the Soft Drink Interbrand Competition Act (1980), which gives bottlers the legal right to exclusive territories within which to distribute their product as long as there is sufficient interbrand competition. This means that it is not permitted to have more than one bottler selling Coca-Cola Company products in one territory (e.g., a state).
Also important here have been the changes in policies affecting the availability of sweetened soft drinks in schools. These changes reflect a history of tortuous debate and decision-making that began with the enactment of the National School Lunch Program (NSLP) in 1946. The NSLP contained no specific provisions relating to the sale of foods in school shops and vending machines etc, but in 1970, congress granted the US Department of Agriculture (USDA) the authority to regulate these so-called competitive foods, a move that led to the designation of “soda water” as a “food of minimum nutritional value” and a legal challenge to the USDA by the soft drinks industry. The result was the limited federal control over soft drinks in schools but with states retaining their ability to regulate beyond federal rules.39,52
In the 2000s, states started to act, with hundreds of bills proposed to restrict soft drink availability in schools beyond federal regulations. To date, over 30 states have taken legislative action to somehow control the availability of sweetened soft drinks in schools.53 In 2006, the American Beverage Association developed some self-regulatory school beverage guidelines brokered by the Alliance for a Healthier Generation. The guidelines eliminate the availability of full-calorie drinks in schools, limit the portion sizes of caloric beverages, and require low- and no-calorie drinks to be available.54
Changes in consumer characteristics also played a role here. As spending power among young people soared during the 1980s and 1990s, they simply had more money to spend on soft drinks while at school.55
Step three
The third step in the analysis is to translate these characteristics into incentives and disincentives. What is clear is that, historically, all the characteristics—except for the relatively recent policy restrictions—have coherently facilitated the supply of soft drinks into schools, driven by the ultimate incentive of wanting to reach young people. Organizationally, for example, Company-bottler contracts create an incentive for bottlers to place vending machines in schools, while the highly concentrated nature of the industry, combined with the lack of intrabrand competition and the weak power of schools, creates the incentive for exclusive contracts with schools. Financially the high margins from vending machines create an incentive for bottlers, and the cash benefits are an incentive for schools. Developments in the regulatory environment on school food removed disincentives to their availability, as did developments in vending technologies.
Step four
The fourth step is to examine the implications for availability, retail prices, and marketing. The increase of availability of sweetened soft drinks in schools has been well documented: in 2004–2005, 88% of high school students had soft drinks available to them through vending machines.56 The effect of prices in vending machines is less clear, but for marketing, there is no question that vending machines provide a critical opportunity for branding young people at an impressionable age, in the hope that they remain loyal for life.
Step five
Step 5 is to identify what incentives could be levered for change. The approaches implemented thus far are the state laws and school beverage guidelines. Since these measures have come into place, the American Beverage Association report that calories from all beverages shipped to schools nationwide declined by 58% between 2004 and 2007–2008 and shipments of full-calorie soft drinks fell by 65% in all schools.57
This analysis shows that these consumer-end policies, as well as other interventions that aim to dampen consumer demand directly, could be reinforced by supply chain approaches; they may be less obvious than school-end policies, but could nevertheless have powerful effects. Examples identified here include negotiating Company-bottler, school-bottler contracts to allow the bottlers to generate greater profits from water-only vending (organizational/financial); encouraging consolidation among schools when negotiating contracts to increase their power (organizational); investing in technologies that permit sale of very small packages, at greater profit than larger containers (technological); and looking again— as the Federal Trade Commission has done already58—at the nature of competition policy to see how it could be leveraged to create disincentives in the chain.
POTENTIAL APPLICATIONS OF CONSUMPTION-ORIENTED FOOD SUPPLY CHAIN ANALYSIS
This article has exemplified a potential application of consumer-oriented food supply chain analysis to a supply chain into a discrete setting—in the context of the availability of foods in those settings. There are many more potential applications of the analysis (Box 1). Supply chain analysis could be used to examine the supply of fatty, sugary, salty foods into other discrete settings like worksites and restaurants. It could be used to examine how consumer-oriented policies, such as regulations on food marketing to children, nutrition labeling, or food taxes, affect the earlier components of the food supply chain. This could help identify bottlenecks to successful implementation of the regulations (aspects that undermine their implementation), and the broader advantages and disadvantages throughout the chain of implementing such regulations. One example would be to examine the effect of voluntary initiatives—such as the school beverage guidelines—on the supply chain relative to legal approaches. In the other direction, the analysis could be used to examine how regulations in the food supply chain affect consumption. For example, how do food quality (e.g., cosmetic) standards affect what foods are available in the marketplace? How would changing environmental or sustainability criteria for food products affect consumption? Supply chain analysis could also be built into studies that involve identifying the barriers to promoting healthy eating, such as problem and solution trees. A recent example shows how these approaches can be useful in identifying supply chain barriers to healthy eating.59
Box 1: Examples of potential applications of consumption-oriented food supply chain analysis.
Understanding supply chains into discrete settings, such as schools, worksites, restaurants
Analyzing the impact of consumer-oriented nutrition policies on the supply chain
Examining how regulations in the food supply chain affect consumption
Used as part of established analyses that aim to identify problems and solutions to healthy eating
Removing disincentives to fruit and vegetable supply chains into under-served areas
Levering local food supply chains for healthy eating
Analyzing the influence of agricultural practices and policies on diets
Comparing the supply chain of similar but different products such as:
light” versions of full-calorie products
similar products that have undergone differing degrees of processing
similar products that have been produced by chains of differing scales (global, local)
identifying financial incentives and disincentives to levering the supply chain
newly emerging and/or little-studied problems in the food environment
analyzing consumption-oriented supply chain issues in the context of economic, environmental, labor, and/or safety concerns
Another potential application are fruit and vegetable supply chain. As the ultimately “healthy” food, much attention has focused on making fruits and vegetables available, affordable, and desirable. Supply chain analysis could play a role by identifying the supply-side bottlenecks to achieving these goals and by providing insights into how to increase supply into underserved areas (or into discrete settings like schools). Experience of developing local food supply chains to encourage fruit and vegetable consumption while delivering value to producers shows that logistical supply chain management is often the key disincentive to such efforts. Supply chain analysis could be used at a local level to identify bottlenecks in the chain from, say, farm to school, or farm to low-income neighborhood. The analysis could also be used more broadly to examine whether different scales of chain (e.g., local versus national or global provision of fresh fruits and vegetables) are more conducive to healthy eating.
Another potential application is the influence of agriculture in healthy eating. The role of agricultural producers is explicit in local food supply chains, but there has been debate as to the role of agricultural policies in influencing the healthiness of the food supply in general.60 Supply chain analysis could be used to examine more systematically the role of agricultural policies and programs in influencing the food environment in particular settings. For example, the consumption of pulses (legumes) is declining in many developing countries. Is this simply because of changes in consumer preferences, or are there explanations in the agricultural sector?
Comparison of chains for similar but different products could also be instructive in providing insights into how the supply of more health-promoting product could be encouraged. Examples might be a comparison of the chain of milk into schools compared with the chain for sweetened milk, or between “healthier” versions of products from the same food company, such as unsweetened breakfast cereal and a high-sugar product, or a high-fat snack with a lower-fat version. This could help identify what changes are needed to help the healthier chain outcompete the less healthy product, as well as the supply-side incentives food companies need to produce healthier versions of their products. Likewise, a comparison could be done between products that are similar but that have undergone differing degrees of processing, such as a bread made with three ingredients relative to a bread with a long list of ingredients and additives.
Another possibility is to identify financial incentives and disincentives to leveraging the supply chain. Supply chain analysis could help identify what financial incentives and disincentives could be implemented in the food supply chain to create a healthier food environment, rather than limiting such approaches to the consumer end of the chain.61 There is also particular potential to use the analysis to study newly emerging and/or little studied problems in the food environment; to illustrate, it is possible that taking a supply chain approach to the problem of soft drinks in schools at an earlier stage would have led to solutions being identified earlier.
CONCLUDING REMARKS
It was noted in the introduction to this article that the supply chain approaches taken to food issues thus far have typically focused on business management, the environment, labor, and safety. As a counter balance, the method developed in this article has deliberately focused on consumption. This stress that leveraging the food supply chain is an underused policy response to the growing problem of unhealthy eating. Ideally, however, all aspects of the food supply chain that affect human health and well-being—whether it be economic concerns, working conditions, climate change, unsafe food, or healthy diets—should be considered as part of one system and thus in one analytical framework. Further discussion and debate are needed to merge the different approaches to create a new paradigm for the modern food system.
Acknowledgments
This article is based on a paper commissioned by the Healthy Eating Research Program of the RWJF. The authors would like to thank the RWJF, particularly Mary Story, for their support. The ideas presented were originally stimulated by the work of Tim Lang and colleagues at City University. The author thanks Francesco Branca and Laurette Dubé for inviting me to present versions of these ideas at conferences in 2006 and 2007. The author also thanks Deborah Pinkas for her insights into soft-drink contracts with schools.
REFERENCES
- 1.Ogden CL, Carroll MD, Curtin LR, McDowell MA, Tabak CJ, Flegal KM. Prevalence of overweight and obesity in the United States, 1999–2004. JAMA. 2006;295:1549, 1555. doi: 10.1001/jama.295.13.1549. [DOI] [PubMed] [Google Scholar]
- 2.Levi J, Vinter S, Richardson K, St Laurent R, Segal LM. F as in fat: how obesity policies are failing in America 2009. Available at: http://healthyamericans.org/reports/obesity2009/ Accessed July 2, 2009.
- 3.James PT, Leach R, Kalamara E, Shaveghi M. The worldwide obesity epidemic. Obes Rev. 2001;9(suppl 4):228S–233S. doi: 10.1038/oby.2001.123. [DOI] [PubMed] [Google Scholar]
- 4.Martin C. Logistics and Supply Chain Management: Strategies for Reducing Cost and Improving Service. 3rd ed. Harlow, Essex: Pearson Education Ltd; 2005. [Google Scholar]
- 5.Hawkes C. Dietary implications of supermarket development: a global perspective. Dev Policy Rev. 2008;26(6):657, 692. [Google Scholar]
- 6.Porter M. Competitive Advantage: Creating and Sustaining Superior Performance. New York, NY: The Free Press; 1985. [Google Scholar]
- 7.Gereffi G, Korzeniewicz M. Commodity Chains and Global Capitalism. Westport, Conn: Praeger; 1984. [Google Scholar]
- 8.Global Value Chains. Global Value Chains Web site. Available at: http://www.globalvaluechains.org/ Accessed June 29, 2009.
- 9.Gereffi G, Lee J, Christian M. US-based food and agricultural value chains and their relevance to healthy diets. J. Hunger Environ Nutr. 2009;4:357, 392. doi: 10.1080/19320240903321276. [DOI] [PMC free article] [PubMed] [Google Scholar]
- 10.Dolan C, Humphrey J. Governance and trade in fresh vegetables: the impact of UK supermarkets on the African horticulture industry. J Dev Stud. 2000;37(2):147–176. [Google Scholar]
- 11.Value Chain Partnerships. Available at: http://www.valuechains.org/ Accessed October, 2009.
- 12.Dept of Environment, Food and Rural Affairs, UK. Comparative life-cycle assessment of food commodities procured for UK consumption through a diversity of supply chains—FO0103. Available at: http://randd.defra.gov.uk/Default.aspx?Menu=Menu&Module=More&Location=None&Completed=0&ProjectID=15001. Accessed June 29, 2009.
- 13.Walkers Snacks Ltd. Taking steps to reduce our carbon footprint. Available at: http://www.walkerscarbonfootprint.co.uk/ Accessed June 29, 2009.
- 14.Sustainable Development Commission, UK. You are what you sell. Product roadmapping: driving sustainability. Available at: http://www.sd-commission.org.uk/publications/downloads/roadmap_booklet_es%20(2).pdf. Accessed June 29, 2009.
- 15.Deloitte MCS Limited. Public sector food procurement initiative: an evaluation. Available at: http://www.defra.gov.uk/farm/policy/sustain/procurement/pdf/090311-PSFPI-%20evaluation.pdf Accessed July 2, 2009.
- 16.United States Dept of Agriculture Food Safety Research Information Office. A focus on hazard analysis and critical control points. Available at: http://fsrio.nal.usda.gov/document_fsheet.php?product_id=155 Accessed June 29, 2009.
- 17.Meadows D. Leverage Points: Places to Intervene in a System. Hartland, Vt: The Sustainability Institute; 1999. [Google Scholar]
- 18.Young CE, Kantor LS. A Comparison of the US Food Supply With the Food Guide Pyramid Recommendations. Washington, DC: United States Department of Agriculture; 1999. [Google Scholar]
- 19.Srinivasan CS, Irz X, Shankar B. An assessment of the potential consumption impacts of WHO dietary norms in OECD countries. Food Policy. 2006;31:53–77. [Google Scholar]
- 20.Gerbens-Leenes PW, Nonhebel S. Consumption patterns and their effects on land required for food. Ecol Econ. 2002;42(1-2):185, 199. [Google Scholar]
- 21.Lang T, Heasman M. Food Wars. The Global Battle for Mouths, Minds and Markets. London: Earthscan; 2004. [Google Scholar]
- 22.Barling D. Food supply chain governance and public health externalities: upstream policy initiatives and the UK State. J Agric Environ Ethics. 2007;20(3):285–300. [Google Scholar]
- 23.Lyson T. From plant to plow: the transformation of New York's food system and agricultural system since 1910. In: Hirschl TA, Heaton TB, editors. New York State in the 21st Century. Santa Barbara, CA: Praeger; 1999. pp. 157–168. [Google Scholar]
- 24.Smith AF, editor. The Oxford Companion to American Food and Drink. New York, NY: Oxford University Press; 2007. [Google Scholar]
- 25.Levenstein H. Revolution at the Table. New York, NY: Oxford University Press; 1988. [Google Scholar]
- 26.Heffernan WD. Agriculture and monopoly capital. Mon Rev. 1998;50:46, 59. [Google Scholar]
- 27.Hendrickson MK, Heffernan WD, Howard PH, Heffernan JB. Consolidation in Food Retailing and Dairy: Implications for Farmers and Consumers in a Global Food System. Washington, D.C.: National Farmers Union; 2001. [Google Scholar]
- 28.Hendrickson MK, Heffernan WD. Opening spaces for relocalization: locating potential resistance in the weakneses in the global food system. Sociol Ruralis. 2002;42:347, 369. [Google Scholar]
- 29.United States Dept of Agriculture Economic Research Service. Farm structure: questions and answers. Available at: http://www.ers.usda.gov/Briefing/FarmStructure/Questions/farmstruct.htm Accessed July 3, 2009.
- 30.MacDonald J, Hoppe R, Banker D. Growing farm size and the distribution of farm payments. Economic Brief Number 6. Available at: http://www.ers.usda.gov/publications/EB6/EB6.pdf Accessed July 3, 2009.
- 31.Elitzak H. Food marketing costs: a 1990s retrospective. FoodReview [serial online] 23:27–30. Accessed September 2, 2009. September-December, 2000. Available at: http://www.ers.usda.gov/publications/foodreview/septdec00/FRsept00e.pdf. [Google Scholar]
- 32.United States Dept of Agriculture Economic Research Service. Food marketing system in the US price spreads from farmer to consumer. Available at: http://www.ers.usda.gov/Briefing/FoodMarketingSystem/pricespreads.htm Accessed September 2, 2009.
- 33.Leibtag E. Market dynamics keep food prices steady. Amber Waves. February 2003. Available at: http://www.ers.usda.gov/AmberWaves/feb03/Findings/marketdynamics.htm Accessed July 6, 2009.
- 34.Price CC. The US foodservice industry looks abroad. Food Rev. May 1996. pp. 13–17.
- 35.US Dept of Agriculture. Food and Agricultural Policy: Taking Stock for a New Century. Washington, DC: US Dept of Agriculture; 2001. [Google Scholar]
- 36.Jerado A. What Share of US Consumed Food Is Imported? Amber Waves. 2008;6:36, 38. [Google Scholar]
- 37.Hawkes C. Uneven dietary development: linking the policies and processes of globalization with the nutrition transition, obesity and diet-related chronic diseases. Global. Health. 2006;2:4. doi: 10.1186/1744-8603-2-4. Available at: http://www.globalizationandhealth.com/content/2/1/4 Accessed July 3, 2009. [DOI] [PMC free article] [PubMed] [Google Scholar]
- 38.Mentzer Morrison R, editor. FoodReview: consumer-driven agriculture. FoodReview [serial online] 2002;25 Available at: http://www.ers.usda.gov/publications/FoodReview/May2002/ Accessed September 2, 2009. [Google Scholar]
- 39.Mello MM, Pomeranz J, Moran P. The interplay of public health law and industry self-regulation: the case of sugar-sweetened beverage sales in schools. Am J Public Health. 2008;98(4):595, 604. doi: 10.2105/AJPH.2006.107680. [DOI] [PMC free article] [PubMed] [Google Scholar]
- 40.The Coca-Cola Company. Annual Report 2007. Atlanta, Ga: Coca-Cola Company; 2007. [Google Scholar]
- 41.Coca-Cola Enterprises Inc “About Us” Web site. Available at: http://www.cokecce.com/pages/allContent.asp?page_id=88 Accessed September 2, 2009.
- 42.Coca-Cola Enterprises, Inc. “The Coca-Cola System” “Value Chain” and “Sustainable Agriculture.”. Available at: http://www.thecoca-colacompany.com.
- 43.Coca-Cola Enterprises Inc. Corporate Social Responsibility Report. Atlanta, Ga: Coca-Cola Enterprises Inc; 2006. Accessed September 2, 2009. [Google Scholar]
- 44.Coca-Cola Enterprises Inc. 2006 Annual Report. Atlanta, Ga: Coca-Cola Enterprises Inc; 2006. [Google Scholar]
- 45.Coca-Cola Enterprises Inc. 2007 Annual Report. Atlanta, Ga: Coca-Cola Enterprises Inc; 2007. [Google Scholar]
- 46.Fuhrman E. The 2006 soft drink report. Beverage Industry. March 2006. pp. 16–22.
- 47.Business Week. Best global brands 2008. Available at: http://bwnt.businessweek.com/interactive_reports/global_brand_2008/ Accessed September 3, 2009.
- 48.The Coca-Cola Company. Product descriptions. Available at: http://www.virtualvender coca-cola.com/ft/index.jsp. Accessed September 3, 2009.
- 49.Advertising Age. Marketer trees 2008. Available at: http://adage.com/marketertrees08update/ Accessed September 3, 2009.
- 50.The Coca-Cola Company. FORM 10-K For the fiscal year ended December 31, 2008. Available at: http://www.thecoca-colacompany.com/investors/pdfs/form_10K_2008.pdf Accessed September 2, 2009.
- 51.CCE Form 10K and Annual Report 2008. Available at: http://files.shareholder.com/downloads/CCE/716951617x0x279036/BA72537B-37DE-4177-BDD6-11F6ECC123EA/CCE-137_2008_AR_Final_Printed.pdf Accessed September 2, 2009.
- 52.Fried E, Simon M. The competitive food conundrum: can government regulations improve school food? Duke Law J. 2007;56:1491, 539. [PubMed] [Google Scholar]
- 53.Hawkes C. Regulations, Guidelines and Voluntary Initiatives on Soft Drink Availability in Schools Around the World. Geneva: Prepared for the World Heart Federation; Available at: http://www.dumpsoda.org/hawkeswhffinaldec2008.pdf Accessed September 8, 2009. [Google Scholar]
- 54.American Beverage Association. School beverage guidelines. Available at: http://www.ameribev.org/nutrition-science/school-beverage-guidelines/ Accessed July 7, 2009.
- 55.McGinnis JM, Gootman JA, Kraak VI. Food Marketing to Children and Youth: Threat or Opportunity? Washington, DC: National Academies Press; 2006. [Google Scholar]
- 56.Johnston LD, Delva J, O'Malley PM. Soft drink availability, contracts, and revenues in American secondary schools. Am J Prev Med. 2007;33:S209–S225. doi: 10.1016/j.amepre.2007.07.006. [DOI] [PubMed] [Google Scholar]
- 57.American Beverage Association. School Beverage Guidelines Progress Report 2007–2008. Available at: http://www.schoolbeverages.com/download.aspx?id=111. Accessed September 8, 2009.
- 58.Saltzman H, Levy R, Hilke JC. Transformation and Continuity: The US Carbonated Soft Drink Bottling Industry and Antitrust Policy Since 1980. Washington, DC: Federal Trade Commission; 1999. Bureau of Economics Staff Report. [Google Scholar]
- 59.Snowdon W, Schultz J, Swinburn B. Problem and solution trees: a practical approach for identifying potential interventions to improve population nutrition. Health Promot Int. 2008;23:345, 353. doi: 10.1093/heapro/dan027. [DOI] [PubMed] [Google Scholar]
- 60.Hawkes C. Promoting healthy diets and tackling obesity and diet-related chronic diseases: what are the agricultural policy levers? Food Nutr Bull. 2007;20:S312–S322. doi: 10.1177/15648265070282S210. [DOI] [PubMed] [Google Scholar]
- 61.Hawkes C. Financial Incentives and Disincentives to Encourage Healthy Eating. London: Which?; 2009. [Google Scholar]