

Abstract
C1 domains are independently folded modules that are responsible for targeting their parent proteins to lipid membranes containing diacylglycerol (DAG), a ubiquitous second messenger. The DAG-binding affinities of C1 domains determine the threshold concentration of DAG required for the propagation of the signaling response and the selectivity of this response among the DAG receptors in the cell. The structural information currently available for C1 domains offers little insight into the molecular basis of their differential DAG-binding affinities. In this work, we characterized the C1B domain of Protein Kinase Cα (C1Bα) and its diagnostic mutant, Y123W, using solution NMR methods and molecular dynamics simulations. The mutation did not perturb the C1Bα structure or sub-nanosecond dynamics of the protein backbone, but resulted in a >100-fold increase of DAG binding affinity and substantial change in μs-timescale conformational dynamics, as quantified by NMR rotating-frame relaxation-dispersion methods. The differences in the conformational exchange behavior between the wild-type and Y123W C1Bα were localized to the hinge regions of ligand-binding loops. Molecular dynamics simulations provided insight into the identity of the exchanging conformers and revealed the significance of a particular residue, Gln128, in modulating the geometry of the ligand-binding site. Taken together with the results of binding studies, our findings suggest that the conformational dynamics and preferential partitioning of the tryptophan sidechain into the water-lipid interface are important factors that modulate the DAG-binding properties of C1 domains.
Keywords: protein-lipid interactions, NMR spectroscopy, protein dynamics, peripheral membrane protein, conformational exchange
INTRODUCTION
“Typical” C1 domains1 are independently folded modules of ~50 amino acids that regulate the function of at least seven families of signaling proteins. These proteins, collectively referred to as DAG/phorbol ester (PE) receptors, include novel and conventional protein kinase C isoenzymes (PKCs), protein kinase D, chimaerins, RasGRPs, Unc-13/Munc-13 proteins, DAG kinases, and myotonic dystrophy kinase-related Cdc42-binding kinases (reviewed in2–4). The function of typical C1 domains within their parent proteins is to associate with lipid membranes in response to binding DAG, their natural agonist, or phorbol esters. Phorbol esters are naturally occurring tetracyclic diterpenoids with known tumor-promoter activity.5 They have found widespread application as pharmacological and research tools for studying the function of PKCs and their role in carcinogenesis.6,7
PKC was identified as the first DAG/PE receptor by Nishizuka’s laboratory in 1982.8 In conventional and novel PKCs, two C1 domains are found as a tandem and are designated C1A and C1B.9,10 The membrane-binding event mediated by C1 domains releases the auto-inhibitory interaction between the N-terminal pseudo-substrate region and the kinase active site11, thereby activating the enzyme. In conventional PKCs comprising α, βI, βII, and γ isoforms, the membrane recruitment step also involves the C2 domain,12,13 which undergoes membrane insertion in response to binding Ca2+ and phosphatidylserine (PtdSer). Both C1 and C2 domains preserve their ligand-binding properties in their respective isolated forms.
Despite their high sequence identity, C1A and C1B domains within the same PKC isoenzyme have different intrinsic affinities to DAG and PEs with a notable exception of PKCγ. This was demonstrated for both isolated domains14,15 and full-length PKC.16 Distinct DAG and PE affinities of C1 domains directly translate into their individual functional roles within the parent PKC isoenzyme. In a series of elegant experiments, Medkova et al. showed that mutations of essential hydrophobic residues in the C1A but not the C1B domain dramatically reduced the binding of full-length PKCα to DAG-containing vesicles, its enzymatic activity, and the depth of monolayer penetration.17 A similar pattern was observed for PKCδ, where C1A and C1B domains were shown to have non-equivalent roles in mediating the kinase activation response to DAG18 and PE.19 Taken together, these findings indicate that the C1A and C1B domains are responsible for the DAG- and PE-induced activation of PKCs, respectively. Ligand preferences of C1 domains also play a major role in determining the sub-cellular localization of PKC activity and may control the isoform-specific response in case of overlapping PKC functions. In addition, C1 domains have been identified as targets for designing therapeutic agents that selectively inhibit or activate PKCs.3,4 Despite the significance of C1 domains as regulatory modules, the determinants of their ligand specificities and binding affinities are poorly understood.
The available structural information about C1 domains reveals little about the molecular basis of their ligand preferences. All domains share the basic elements that include two structural Zn2+ ions20, a hydrophobic ridge surrounding the DAG-binding site, and a belt of basic residues across the middle part of the protein. A comparison of primary structures for several C1 domains is shown in Figure 1. The residues involved in Zn2+ coordination are highlighted in blue and include three cysteines and one histidine per Zn2+ site. The ligand, DAG or PE, binds between the loops β12 and β34. In addition to Zn2+-binding residues, Pro112, Gly124, and the Gln128-Gly129 motif constitute the consensus sequence for the typical C1 domains.
Figure 1.

(a) Comparison of the primary structures of DAG/PE-responsive (1 through 6) and “atypical” (7 and 8) C1 domains. C1Bα numbering is used to indicate the amino acid position in the primary structure. Consensus sequence for DAG/PE-responsive C1 domains, shown in red, comprises residues involved in coordinating two structural Zn2+ ions (highlighted in blue), Pro112, Gly124, and the Gln128-Gly129 motif. DAG-binding loops β12 and β34 are underlined in C1Bα. Loop β34 in atypical C1 domains from KSR-1 and Raf-1 has a four amino-acid deletion.25,26 A conserved Tyr at position 123 is highlighted in yellow. All C1 sequences are from Mus musculus except for Raf1, which is from Homo sapiens. (b) Ribbon representation of the ensemble-averaged NMR structure of C1Bα.23 The coordinates were kindly provided by Dr. Ulrich Hommel. β2 and β3 segments are identified as 3-amino acid β-strands by Hommel et al.,23 and will be referred to as such in the remainder of the paper.
A search of the Protein Data Bank yielded 14 unique structures of isolated C1 domains, of which one was determined by X-ray crystallography and thirteen by solution NMR methods.21–27 For the seven structures corresponding to C1 domains of PKCs, the backbone of the protein core is super-imposable but substantial structural variability is observed in the ligand-binding loops, especially loop β34. The origin of this structural heterogeneity is attributed to the motional processes and/or insufficient number of structural restraints due to the solvent exposure of the loops.23,28 In contrast, in atypical C1 domains that do not bind DAG only loop β12 is flexible while loop β34, which has a 4 amino-acid deletion, is rigid.25,26
The prevalent model states that the membrane-binding event is mostly driven by the hydrophobic effect, with some contribution of electrostatic interactions between the positively charged C1 side-chains and the acidic lipid head groups.10 A membrane-bound ligand, DAG or PE, binds inside the cleft formed by the β12 and β34 loops, thereby increasing the hydrophobicity of the C1 domain and facilitating its insertion into the membrane. The differences in ligand-binding affinities between the C1 domains are difficult to explain based purely on structural considerations. The only available crystal structure of a C1-ligand complex is that of the C1B domain from PKCδ bound to a water-soluble PE.21 In that structure, the ligand does not have any sidechain-specific contacts with the protein and does not appear to change the conformation of the ligand-binding loops.
To gain insight into the determinants of DAG affinity, Newton’s group constructed a Y123W mutant of the C1B domain from PKCβII/βI and characterized its in-vitro binding affinities to DAG- and PE-containing lipid vesicles, translocation efficiency to the plasma membrane in response to stimulated DAG production, and sub-cellular localization patterns.29 Tyrosine at position 123 is invariant in C1B domains of conventional PKCs (Figure 1), and is located at the N-terminal hinge of loop β34. The Y123W mutation converted the C1B from a low- to high-affinity DAG-binding module by increasing its DAG affinity 33-fold compared to the wild-type (wt). In addition, the Y123W mutation made C1B more responsive to DAG in vivo, as indicated by its localization to juxtanuclear region and ready translocation to the DAG-enriched plasma membrane. These results indicate that the identity of an aromatic residue at position 123 is extremely important in determining the DAG-binding properties of C1 domains.
The objective of this work was to determine the molecular basis of DAG affinity in C1 domains using the C1B domain of Protein Kinase Cα (C1Bα) as a paradigm. Toward this objective, we characterized the wt C1Bα and its diagnostic mutant Y123W using solution NMR methods and molecular dynamics (MD) simulations. Similar to the C1B domain from PKCβII/βI, the mutation of Tyr to Trp substantially increased the affinity of C1Bα to DAG. We found that the mutation did not perturb the C1Bα structure or the sub-nanosecond dynamics of the protein backbone, but resulted in significant changes in conformational dynamics, as measured by rotating-frame relaxation-dispersion NMR methods. Our data suggest that conformational dynamics in C1 domains play an important role in the mechanism of DAG recognition and binding. In addition, the surface area of C1Bα involved in the interactions with DAG-free detergent micelles is substantially larger in the Y123W mutant compared to the wt protein. Preferential partitioning of Trp sidechain into the headgroup region of membranes during the first step of non-specific C1Bα-membrane association30 is another factor that may contribute to the increased DAG affinity of the Y123W mutant.
RESULTS
Y123W mutation increases the affinity of C1Bα to DAG
To determine the lipid cofactor binding affinities of wt and Y123W C1Bα, we carried out diacylglycerol binding assays in micellar environment. 15N-1H HSQC spectra of 100 μM uniformly 15N-enriched C1Bα in the presence of DPC/DPS micelles were recorded as a function of increasing concentration of DOG, a short-chain DAG analog. The micelles contained 30% PtdSer and 70% phosphatidylcholine head-group components, to mimic the composition of plasma membrane where the PtdSer content is 25–35%.31 The overlay of the 15N-1H HSQC spectra color-coded according to the DOG concentration is shown in Figure 2. For the wt C1Bα, the binding regime is intermediate-to-fast on the chemical-shift time scale, which is reflected in the smooth trajectories of the cross-peaks in response to increasing DOG concentration. In the Y123W C1Bα, the binding regime is slow-to-intermediate. The differences in the DOG titration behavior between the wt and mutant proteins are illustrated in the insets of Figure 2 using Leu122 as an example. Leu122 is located at the N-terminal hinge of loop β34 and is one of the residues that show strong response to ligand binding. According to the chemical shift perturbation analysis, the residues involved in DOG binding belong to the ligand-binding loops β12 and β34 and their respective hinge regions (Figure S1 and vide infra).
Figure 2.

NMR-detected titration of the wt (a) and Y123W C1Bα (b) with DOG in the presence of DPC/DPS micelles. The binding process is intermediate-to-fast and slow-to-intermediate on the chemical-shift timescale for the wt and Y123W C1Bα, respectively. The insets show the differences in the binding regimes for the wt and mutant proteins using Leu122 as an example. Large chemical shift perturbations are observed in the ligand-bound versus apo-spectra.
For all wt C1Bα residues that show strong response to DOG in the HSQC spectra, we constructed binding curves by plotting the absolute change in 1H and/or 15N chemical shifts as a function of DOG concentration. The curves were fit using Eq. (1), with ΔδPL and Kd treated as local and global parameters, respectively. Representative 1H and 15N binding curves for several residues are shown in Figures 3(a) and (b). The dissociation constant Kd for the DOG in the presence of micelles was determined to be 24.2 ± 2 μM.
Figure 3.

DOG binding curves for the wt and Y123W C1Bα detected by NMR and fluorescence spectroscopy. In (a) and (b), the absolute values of the 1H and 15N chemical shift changes, Δ1H and Δ15N, are plotted as a function of DOG concentration for several representative residues. The binding curves were fit with Eq. (1) using the dissociation constant Kd as a global parameter. (c) Normalized change in the fluorescence of Y123W C1Bα plotted as a function of DOG concentration. The error bars represent the standard deviation between three experiments. Fitting the binding curve with Eq. (8) produced P0 of 0.23 ± 0.07 μM and Kd of 6.7 ± 16.4 nM. Large errors in Kd indicate that, in this protein concentration range, the binding is still tight, and we can only put an upper limit of 0.23 μM onto the Kd value.
In the mutant, the slow-to-intermediate regime of the DOG binding process has precluded the determination of Kd by NMR methods. While there are no Trp residues in the primary structure of wt C1Bα, the Y123W mutation enables us to use the fluorescence of Trp at position 123 as a probe of protein-DOG interactions. Using fluorescence spectroscopy, we measured the quenching of Trp fluorescence in Y123W C1Bα in response to DOG binding in the presence of DPC/DPS micelles. The normalized change of fluorescence intensity as a function of DOG concentration is shown in Figure 3(c). Fitting the curve of Figure 3(c) with Eq. (8) revealed that even at the total protein concentration in the low μM range the protein-DOG interaction still remains in the tight binding regime. Further decrease in the total protein concentration was not a viable option due to the high background fluorescence of detergent micelles and the low efficiency of chemical quenching of Trp fluorescence by DOG.30 Using the data presented in Figure 3(c), we were able to put an upper limit of 0.23 μM onto the value of Kd.
The results of our DOG-binding experiments demonstrate that the Y123W mutation increases the affinity of C1Bα to diacylglycerol at least 100-fold, from 24.2 μM to <0.23 μM. These findings are in good agreement with the data obtained for the C1B domain from PKCβI/βII, where a 33-fold increase in DOG binding affinity was detected using ultracentrifugation lipid-binding assays.29 The next step was to understand the molecular basis of this drastic change in the DOG-binding affinity. We investigated the effect of the Y123W mutation on both the structure and dynamics of C1Bα using NMR techniques.
The structures of wt and Y123W C1Bα are similar in both apo- and ligand-bound forms
We assessed the structural perturbation imposed on C1Bα by the Y123W mutation using the chemical shift perturbation analysis and RDCs measured for all spectrally resolved 15N-1H groups. The results for the apo-forms of wt and Y123W C1Bα are shown in Figures 4(a) and (b). Site-specific chemical shift perturbations Δ between Y123W and wt C1Bα were calculated using the 15N-1H HSQC spectra of Figure S2. In Figure 4(a), Δ values are color-coded and mapped onto the NMR structure of wt C1Bα. Only the site of the mutation experiences a noticeable change in the electronic environment, whereas other parts of the protein, including ligand-binding loops β12 and β34, are essentially unperturbed. In addition to chemical shifts, RDCs between the 15N and 1H spins of amide groups, 1DNH, are exquisitely sensitive to the changes of the backbone conformation and have been previously used to evaluate structural perturbations in point mutants.32,33 1DNH were measured for the apo-forms of both wt and Y123W C1Bα weakly aligned in 6% stretched polyacrylamide gels. Figure 4(b) shows the correlation between the 1DNH values in Y123W and wt C1Bα. Data points corresponding to the loop residues are shown with empty circles. Fitting the data with an unconstrained linear function produces an intercept of 0 and a slope of 1 within experimental error. Based on the results of chemical shift perturbation analysis and good correlation between the 1DNH values, we concluded that the mutation at position 123 does not impose any significant perturbation on the conformation of the C1Bα backbone.
Figure 4.

Assessment of structural differences between wt and Y123W C1Bα using chemical shift perturbation analysis and RDCs. Structural Zn2+ ions are shown as black spheres in (a), (c), and (d). Prolines and residues that are missing from the 15N-1H HSQC spectra are shown in grey. In (a), Δ was calculated between the apo-forms of Y123W and wt C1Bα, color-coded and mapped onto the ensemble-averaged NMR structure of C1Bα.23 The only significant perturbation is observed at the mutation site. (b) Comparison of the 1DNH RDCs between the Y123W and wt C1Bα. Empty circles correspond to the β12 and β34 loop residues. Fitting the data with a linear function produces a slope of 1.0 within experimental error, suggesting that minimum perturbations are imposed on the backbone of C1Bα by the Y123W mutation. In (c) and (d), Δ was calculated between the DOG-bound and apo forms of wt (c) and Y123W C1Bα (d). In both proteins, the regions involved in interactions with ligand are the β12 and β34 loops and their hinges. In (d), the Tyr at position 123 was replaced with Trp in the ensemble-averaged NMR structure of C1Bα using WHATIF.79
The DOG titration data were used to generate Figures 4(c) and 4(d), where the chemical shift perturbations Δ were calculated between the DOG-bound and apo-forms of wt (c) and Y123W C1Bα (d). The regions affected by DOG binding in the presence of DPC/DPS micelles are essentially the same in the wt and mutant proteins and include the following structural elements: the C-terminal half of loop β12 (residues Tyr109 and Ser111); the C-terminal hinge of β12 (Thr113, Phe114, and Cys115); the N-terminal hinge of β34 (Leu121 and Leu122); and the entire loop β34 comprising the stretch of residues from Tyr123 to Gln128, with the only exception of Gly129. Thus, our data suggest that the wt and Y123W C1Bα interact with micelle-embedded DOG using the same structural segments that include the β12 and β34 loops and their hinges. The similarities between the DOG-bound wt and mutant are also evident from the small residue-specific differences in 1H and 15N chemical shifts plotted in Figure S1. Given the similarities in the patterns of chemical shift perturbations and site-specific 1DNH values, we concluded that in both apo- and DOG-bound forms the structure of C1Bα is not substantially affected by the mutation.
In addition to DOG-binding studies, we carried out NMR titrations of C1Bα with PDBu, a short-chain phorbol ester. Overlays of the titration spectra for wt and Y123W C1Bα are presented in Figure S3. In both proteins, the binding regime is slow-to-intermediate, indicating the formation of high-affinity complexes. This result is in complete agreement with previous studies of C1B from PKCβI/βII, where the affinities of wt and mutant proteins to the phorbol ester were similar, and comparable to the affinity of the Y123W mutant to DAG.29 A comparison of the titration spectra of Figures 2 and S3 indicates that binding of PDBu and DOG affects the same set of residues in C1Bα. One feature that is common to all three high-affinity complexes (wt-PDBu, Y123W-DOG, and Y123W-PDBu) is the appearance of the Gly110 resonance under conditions close to ligand saturation. Gly110 is located at the tip of loop β12 and is the only residue that is broadened beyond detection in the spectra of apo-forms. Overall, our DOG and PDBu titration data suggest that (i) C1Bα interacts with both ligands using the same structural segments, and (ii) formation of high-affinity protein-ligand complexes is accompanied by the structural rearrangement of the β12 and β34 loops and the changes in their mobility. The evidence for altered loop dynamics is supported by our observation that several residues, such as Gly110, Leu125, His127, and Gln128 in the Y123W mutant, and G110 and Leu125 in the wt C1Bα, give rise to severely broadened cross-peaks in the apo-form spectra. The cross-peaks increase in intensity upon binding high-affinity ligands in the presence of micelles.
Y123W C1Bα has an extensive interaction surface with ligand-free micelles
According to the current model30, the association of C1Bα with DAG- and PE-containing membranes occurs via a two-step mechanism. The first step is a non-specific association of the protein with membranes followed by a two-dimensional search for the membrane-embedded ligand in the second step. To investigate the effect of the mutation on the initial membrane-binding event, 15N-enriched wt and Y123W C1Bα were incubated with ligand-free DPC/DPS micelles. The 15N -1H HSQC spectra of the two proteins in the presence of micelles were collected and compared with those of the corresponding apo-forms. In both wt and Y123W C1Bα, the intensities of several cross-peaks are substantially attenuated in the presence of micelles, sometimes leading to complete peak disappearance. This indicates that the kinetics of the binding process is intermediate on the chemical-shift timescale. In addition, several cross-peaks are shifted in the micelle-containing sample of Y123W C1Bα compared to the apo-form.
The perturbed residues mapped onto the structure of C1Bα are shown in Figure 5 for the wt (a) and Y123W C1Bα (b). In wt C1Bα, the intensities of cross-peaks corresponding to Tyr109 of loop β12 and the entire β34 loop comprising the Tyr123-Gly129 stretch are severely attenuated as a result of interactions with micelles. Compared to the wt C1Bα, many more residues in Y123W respond to the presence of detergent micelles, as shown in Figure 5(b). They include the entire loop and hinge regions of β12 (Lys105-Cys115) and β34 (Ser120-Gly129). In addition, residues Cys118, Asp136, Asn138, Lys141, Gln142, Cys143, and Val147 are also affected by interactions with micelles, as manifested in the changes of their chemical shifts. It is evident from Figure 5(b) that, when mapped onto the C1Bα structure, the perturbed regions in the Y123W mutant form a surface that encompasses almost the entire top half of the domain. Our results suggest that Trp at position 123 facilitates the interactions of C1Bα with DPC/DPS micelles. 25 residues out of the total 53 are affected by these interactions in the mutant, as opposed to just 8 in the wt C1Bα. This difference in interaction modes disappears when the specific binding to DOG takes place, as shown in Figures 4(b) and 4(c). Thus, the Y123W mutation most likely affects the kinetics of the association of C1Bα with lipid membranes in the two-step binding mechanism.30 To establish if dynamics play a role in DOG recognition and binding, we quantified the sub-nanosecond (sub-ns) and microsecond-to-millisecond (μs-ms) dynamics of wt and Y123W C1Bα.
Figure 5.
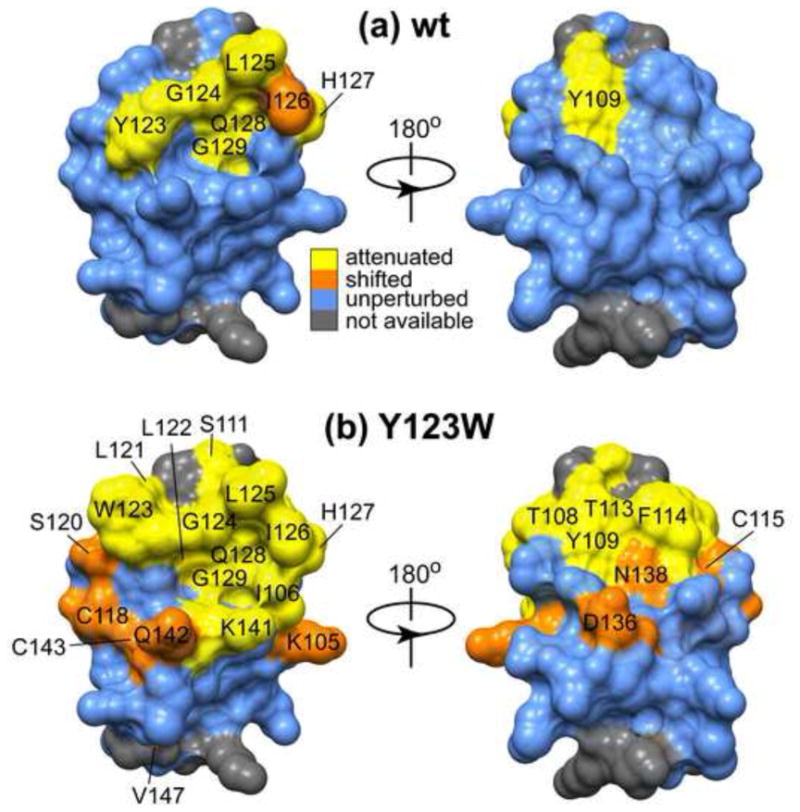
Mapping of the interaction surface of wt (a) and Y123W C1Bα (b) with ligand-free micelles. The cross-peaks of residues that interact with DPC/DPS micelles are either significantly attenuated (yellow) or shifted (orange) compared to their positions in the micelle-free spectra. (a) In wt C1Bα, the entire loop β34, comprising residues Tyr123-Gly129, and Tyr109 of loop β12 are involved in the interactions with micelles. (b) In Y123W C1Bα, both β12 and β34 loops and several adjacent residues are involved in the interactions with micelles. In (b), the Tyr at position 123 was replaced with Trp in the ensemble-averaged NMR structure of C1Bα23 using WHATIF.79 Overall, the total surface area involved in the interaction with micelles is larger in the mutant than in the wt C1Bα.
Sub-nanosecond dynamics of C1Bα backbone is not affected by the Y123W mutation
Relaxation parameter sets comprising R1, R2, and {1H}-15N nOe were measured for all spectrally resolved 15N-1H groups in wt and Y123W C1Bα at two static magnetic fields, 11.7 and 14.1 T. We used the generalized order parameters, S2NH, generated by the model-free analysis of the relaxation data to assess the effect of the mutation on the sub-ns dynamics of C1Bα backbone. S2NH report on the spatial restriction of the motions of 15N-1H vectors, with 1 and 0 corresponding to completely restricted and unrestricted motions, respectively.
Model-free treatment requires an estimate of the rotational diffusion properties of C1Bα. HYDRONMR calculations were carried out on an ensemble-averaged C1Bα NMR structure with two values of a, 2.5 and 2.8 Å, as described in Materials and Methods. For a = 2.5 (2.8) Å, we obtained the overall rotational correlation time τm of 3.13 (3.40) ns and the following eigenvalues of the diffusion tensor: Dz=6.41 (5.88) s−1, Dy=4.67 (4.33) s−1, and Dx=4.88 (4.51) s−1. Because the difference between Dx and Dy is small (4% for both values of a), the diffusion tensor can be treated as axially symmetric with D||/D⊥=1.34 (1.33). The analysis of R2/R1 ratios for C1Bα produced τm=3.28 ns and D||/D⊥=1.30, which is in good agreement with HYDRONMR results. Since the R1 and R2 values are essentially identical between wt and Y123W C1Bα for all 15N spins not subject to conformational exchange, the conclusion about the axial symmetry of the rotational diffusion tensor holds for the Y123W C1Bα as well. The values of τm and D||/D⊥ obtained from the R2/R1 analysis were used as an initial input for the first round of model selection.
A comparison of the calculated S2NH for the wt and Y123W C1Bα, along with the diagram of secondary structure elements and ligand-binding loop regions β12 and β34, is shown in Figure 6(a). In wt C1Bα, the mean S2NH for the secondary structure elements and β12/β34 loop regions is 0.852 ± 0.031 and 0.813 ± 0.074, respectively. For the Y123W mutant, the values are quite similar to those of the wt C1Bα, 0.856 ± 0.031 and 0.826 ± 0.069. Thus, the differences in the mobility between the loop regions and the secondary structure elements are subtle. However, in both proteins the two most dynamic non-terminal residues belong to the loop regions. Ser111, with S2NH of 0.729 ± 0.018 (0.750 ± 0.019) in the wt (Y123W) C1Bα, is located in the middle of loop β12. Residue 123, with S2NH of 0.653 ± 0.020 (0.687 ± 0.024) in the wt (Y123W) C1Bα, is the mutation site located at the N-terminal hinge of the loop β34.
Figure 6.

(a) Comparison of the sub-ns dynamics of 15N-1H backbone groups in the wt and Y123W C1Bα. The generalized order parameters, S2NH, are plotted as a function of primary structure. Shaded areas correspond to β12 and β34 loops, and the mutation site is indicated with an arrow. It is evident from the plot that sub-nanosecond dynamics of the protein backbone are not perturbed by the Y123W mutation. (b) Comparison of the R2CPMG values for the wt and Y123W C1Bα. Elevated R2CPMG values indicate the presence of conformational exchange on the μs-ms timescale. In wt C1Bα, the most dynamic region is the C-terminal hinge of loop β34, while in the Y123W mutant it is both hinges of β34 and the C-terminal hinge of β12.
Another noteworthy feature of the S2NH profile of Figure 6(a) is the mobility of the N- and C-termini. In C1Bα, His102, Cys132, Cys135 and Cys151 coordinate one of the two structural Zn2+ ions (Figure 1). His102 is the third and Cys151 is the next-to-last residue of the N- and C-termini, respectively. The S2NH of His102 is 0.798 ± 0.021 in the wt C1Bα (unresolved in Y123W), indicating that the coordination bond with Zn2+ restricts the motion of His102. S2NH values for Cys151 and Gly152 are not available, since neither residue could be adequately fit with any of the five models. However, their R2 values are substantially reduced compared to the mean values for non-exchanging residues, indicating increased flexibility. Leu150 immediately precedes Cys151 and is highly dynamic with S2NH of 0.403 ± 0.077 (0.455 ± 0.075) in the wt (Y123W) C1Bα. We attributed this increase in the flexibility of the Leu150-Gly152 stretch to the loss of the coordination bond between Cys151 and structural Zn2+. We have since confirmed this conclusion using other methods (manuscript in preparation).
While the sub-ns dynamics of wt and Y123W C1Bα are very similar, we observed significant differences in their conformational exchange behavior. Conformational exchange refers to the processes that occur on the μs-ms timescale and manifest themselves in the elevated R2 values for all 15N spins whose magnetic environment changes as a result of the exchange process. R2 values measured in a Carr-Purcell-Meiboom-Gill (CPMG)-type experiment, R2CPMG, are shown in Figure 6(b). In wt C1Bα, the most dynamic region is the C-terminal hinge of loop β34, comprising residues Gln128 and Gly129. In Y123W C1Bα, there are two additional regions that are affected by the exchange process, the C-terminal hinge of the β12 loop and the N-terminal region of the β34 loop. The implication of these findings for the model-free analysis of sub-nanosecond dynamics is that the subset of residues fit by Models 3 and 4 in the Y123W mutant is significantly larger than that in the wt C1Bα (Figure S4). As a next step, we sought to determine how the kinetics of the exchange process is altered in the Y123W mutant and evaluate the relevance of these changes to the observed DAG binding affinities.
Conformational dynamics of C1Bα is altered by the Y123W mutation
The conformational dynamics of the C1Bα backbone was characterized using relaxation dispersion analysis of 15N rotating-frame relaxation rate constants, R1ρ. R1ρ experiments are sensitive to the exchange processes that occur on the timescale of microseconds. The relaxation dispersion data for the wt and Y123W C1Bα were fit with a two-state model for the exchange process that is fast on the chemical-shift timescale. The parameters of the model describe the exchange between two conformers A and B, A⇔B, in terms of the exchange rates kex and a composite parameter Φex (Eq. (7)). The latter contains information on the structural differences between the conformers (ΔωN2) and the thermodynamics of the process (pApB). The conformers A and B will be referred to as the ground and excited states, respectively.
Table 1 summarizes the results of the global fit for all exchange-broadened residues whose Rex > 0.5 s−1 at 11.7 Tesla. kex decreased significantly, from 15400 to 9600 s−1, in the Y123W C1Bα mutant. The “Group” column in Table 1 indicates the location of the residues inrelation to the ligand-binding loops. β12N, β12C, β34N, and β34C refer to the N- and C-terminal hinges of the β12 and β34 loops. It is evident from Table 1 that all residues for which quantifiable dispersion was detected are located in the hinge regions of β12 and β34. In addition, four residues in Y123W (Gly111, Leu125, His127, and Gln128) and two in the wt C1Bα (Gly111 and Leu125) are broadened by the exchange process, but the low intensity of their cross-peaks precluded the measurement of relaxation dispersion curves.
Table 1.
Summary of the conformational exchange parameters in wt and Y123W C1Bα.
| Residue | R20 (s−1), 14.1 T | R20 (s−1), 11.7 T | Φex × 103 (s−2)a | kex (s−1) | Groupb |
|---|---|---|---|---|---|
| Wild-type C1Bα | |||||
| Tyr109 | 4.87 ± 0.12 | 4.65 ± 0.11 | 21.6 ± 3.0 | 15400 ± 400 | β12N |
| Tyr123 | 4.17 ± 0.07 | 4.00 ± 0.05 | 31.5 ± 1.7 | β34N | |
| Gln128 | 5.52 ± 0.17 | 5.06 ± 0.13 | 115.9 ± 5.0 | β34C | |
| Gly129 | 5.48 ± 0.22 | 5.10 ± 0.15 | 164.8 ± 7.0 | β34C | |
| Met130 | 4.80 ± 0.06 | 4.79 ± 0.04 | 13.8 ± 1.1 | β34C | |
| Other dynamic residues: G111 (β12) and Leu125 (β34) | |||||
| Y123W C1Bα | |||||
| Ile106 | 4.84 ± 0.05 | 4.59 ± 0.04 | 10.5 ± 0.8 | 9600 ± 200 | β12N |
| Thr108 | 4.74 ± 0.07 | 4.60 ± 0.07 | 8.2 ± 1.3 | β12N | |
| Thr113 | 4.52 ± 0.21 | 4.27 ± 0.19 | 99.1 ± 4.5 | β12C | |
| Phe114 | 4.84 ± 0.06 | 4.63 ± 0.05 | 17.8 ± 1.1 | β12C | |
| Leu122 | 5.26 ± 0.17 | 4.91 ± 0.14 | 138.5 ± 4.0 | β34N | |
| Trp123 | 4.18 ± 0.08 | 3.70 ± 0.07 | 58.3 ± 1.8 | β34N | |
| Gly124 | 5.58 ± 0.10 | 5.16 ± 0.08 | 37.5 ± 1.9 | β34N | |
| Gly129 | 6.10 ± 0.41 | 5.48 ± 0.25 | 284.0 ± 8.1 | β34C | |
| Met130 | 4.82 ± 0.06 | 4.74 ± 0.06 | 29.6 ± 1.3 | β34C | |
| Other dynamic residues: Gly111 (β12), Leu125 (β34), His127 (β34), and Gln128 (β34C) | |||||
Φ ex is given for 14.1 T.
β12N, β12C, β34N, and β34C refer to the N- and C-terminal hinges of the β12 and β34 loops.
Residue-specific relaxation dispersion curves showing the dependence of R2 values on the spin-lock amplitude are presented in Figure 7(a). The residues of β12N show very small dispersion amplitudes in both proteins. The β12C hinge comprising residues T113 and F114 does not undergo conformational exchange in wt C1Bα. In contrast, these two residues show significant dispersion in the mutant (Figure 7(a), first column). The same pattern is observed for the β34N, which includes Leu122, the mutation site Tyr/Trp123, and Gly124 (Figure 7(a), second column). While Tyr123 shows small but non-negligible dispersion in the wt, the profiles are flat for Leu122 and Gly124. In the Y123W mutant, the dispersion for all three residues of the β34N hinge is prominent. The β34C region comprising Gln128, Gly129, and M130 is dynamic in both proteins, but the dispersion amplitude in the mutant is substantially increased for Gly129 and M130 compared to the wt (Figure 7(a), third column). To summarize, the Y123W mutation in C1Bα leads to a significant increase in conformational flexibility of C1Bα on the μs timescale, especially in the β12C and β34N regions.
Figure 7.

Comparison of conformational dynamics in wt and Y123W C1Bα. (a) Comparison of relaxation dispersion curves for individual residues in wt (solid circles) and Y123W C1Bα (empty circles). For clarity, only the 14.1 Tesla data are shown. The solid lines correspond to the global fits with parameters summarized in Table 1. Residue groups are defined in Table 1. (b) Intra- and inter-loop hydrogen bonds that stabilize β12 and β34. Because the loop region in the NMR ensemble of C1Bα is poorly defined, we used a homology model of C1Bα that is based on the structure of C1Bδ (1PTQ). Five residues that show quantifiable dispersion amplitudes in either wt or mutant C1Bα, Thr113, Leu122, Gly124, Gln128, and Gly129, are involved in those hydrogen bonds. (c) Conformational dynamics of loop hinges in β12 and β34. Residues that have quantifiable dispersion in both wt and mutant are underlined. Residues with quantifiable dispersion in either wt or mutant are shown with regular and bold fonts, respectively.
Figure 7(b) highlights several residues that are involved in the formation of hydrogen bonds that stabilize both intra- and inter-loop structure. Because the loops are poorly defined in the NMR ensemble of C1Bα, we used a homology model generated using the crystal structure of C1Bδ.21 This hydrogen-bonding pattern is also shared by C1Bγ22,34 that has a 75.5% sequence identity with C1Bα. The C=O group of Gln128 sidechain serves as a hydrogen bond acceptor for its own backbone N-H group and the N-H of Tyr109. In addition, the NH2 group of Gln128 sidechain is a hydrogen-bond donor to Gly124, located on the same loop β34, and Tyr109 located on loop β12. The N-H of Gly129, which shows the largest dispersion amplitude in both wt and Y123W C1Bα, is involved in the hydrogen-bonding interaction with the C=O of H107. Finally, Leu122 N-H and Thr113 C=O form a donor-acceptor pair that stabilizes the inter-loop structure. These hydrogen bonds are essential to maintaining the integrity of the anti-parallel β-sheets formed by strands β1/β4 and β2/β3, as shown in Figure 7(c).
Three residues that have measurable dispersion in both wt and Y123W C1Bα are Tyr/Trp123, Gly129, and Met130. The cross-peak positions of Met130 and Gly129 are essentially coincident in the wt and Y123W C1Bα HSQC spectra, yet their Φex values are drastically different. The implications are that (i) in both proteins, the population of the excited state is fairly small and the major contribution to the observed population-averaged chemical shift comes from the ground state; and (ii) the conformational equilibrium between the ground and excited states in the Y123W mutant is altered compared to that in wt C1Bα. The kex value in the mutant is 9600 s−1 compared to 15400 s−1 in the wt C1Bα. This means that either k1 or k−1 or both decrease as a result of the mutation. A simultaneous increase of the activation energies in forward (Ea,1) and reverse (Ea,−1) directions is unlikely because that would imply a substantial increase in the energy of the transition state due to mutation. Because the excited state populations are small, k1 ≪ k−1 and Ea,1 ≫ Ea,−1 for both proteins. The change in the energy of the excited state brought about by the mutation would contribute significantly to Ea,−1 and negligibly to Ea,1. Then, k1wt k1Y123W and the ratio of the fractional populations of the excited states in the mutant and wt C1Bα can be estimated as: pBY123W/pBwt = kexwt/kexY123W = 1.60. In addition, the plot of Φex values in the mutant versus wt C1Bα for Tyr/Trp123, Gly129, and Met130 shows a linear correlation with a slope of 1.73 (Figure S5). If we assume that ΔωN is similar for these three residues in wt and Y123W C1Bα, then the linear correlation implies a 1.73-fold population shift in the mutant. We conclude that the mutation alters the conformational exchange equilibrium, thereby increasing the population of the excited state by 60–70%.
In addition to the population shift, some structural features of the excited state in the Y123W mutant are likely to be different from those of the wt C1Bα. This conclusion is based on the observation that residues Thr113, Phe114, Leu122, Trp123, and Gly124 have substantial dispersion amplitudes in Y123W C1Bα but show either very little (Tyr123) or no (all others) dispersion in the wt C1Bα. These regions correspond to the C- and N-terminal hinges of β12 and β34 loops that stabilize the structure of the β2/β3 anti-parallel beta-sheet, as shown in Figure 7(c).
Based on the identity of the residues affected by the conformational exchange and their position in the three-dimensional structure of C1Bα, the process that we detect in the relaxation dispersion experiments may involve transient breaking and formation of hydrogen bonds between the anti-parallel β1/β4 strands in wt C1Bα, and both β1/β4 and β2/β3 strands in the Y123W mutant (see Figure 7(c)). This process may also be accompanied by the opening and closing of ligand-binding loops. To understand the dynamic behavior of intra- and inter-loop hydrogen bonds and its implications for the structural rearrangement of β12 and β34 loops, we carried out MD simulations of the wt and Y123W C1Bα.
Molecular dynamics simulations provide insight on the conformation of ligand-binding loops
Loop tip distances in the C1Bα NMR ensemble of structures range from 3.8 Å to 11.3 Å, as measured between the Cα atoms of Ser111 and Leu125. This observation has led to a hypothesis that the process that we detect in relaxation dispersion experiments is the conformational exchange between the conformers with open and closed ligand-binding loops. To explore this possibility we performed MD simulations of wt and Y123W mutant of C1Bα. Model 1 from the NMR ensemble of structures of Hommel et al.23 was used as the starting structure for both wt and Y123W C1Bα. In this structure, the β12 and β34 loops are in a closed conformation with the tip distance of 5.7 Å. The loop tip distance along the MD trajectories was monitored to determine if the ligand binding loops transition to an open conformation.
A histogram of the distances between the loop tips for the wt C1Bα (yellow bars) and Y123W (empty bars) is shown in Figure 8(a). Wt C1Bα undergoes the closed-to-open loop transition early in the equilibration, and never populates the fully closed loop state during the equilibrium trajectories. In contrast, the loops of Y123W C1Bα are still found in the closed conformation after a 2 ns equilibration, with a loop tip distance centered at ~5 Å. After the 2 ns equilibration period, but at different points in the three trajectories of Y123W C1Bα (between 2 ns and 10 ns of simulation time) the loops transition to the open state. Because Y123W C1Bα reaches structural equilibration only after 10 ns, we collected an additional 8 ns of the trajectories of Y123W C1Bα, from 10 to 18 ns, and analyzed them separately from the initial 2–10 ns trajectories where the loop conformation is not yet equilibrated.
Figure 8.

Distribution of open and closed loop conformations in C1Bα. (a) Histogram of the distances between the loop tips for the wt (yellow bars) and Y123W C1Bα (empty bars) observed during the interval between 2 and 10 ns of the MD trajectories. The distance between the loop tips is measured every 200 fs. Wt C1Bα shows a broad bimodal distribution centered at 12.5 Å and 9.5 Å, respectively. Y123W C1Bα has two preferred conformations: the open and closed, which are centered at 12.5 Å and 5 Å. (b) Histogram of the distances between the loop tips for the Y123W C1Bα (empty bars) observed during the trajectory interval between 10 and 18 ns, after the opening of the binding loops. The distance between the loop tips is measured every 200 fs. For comparison, the histogram generated using the three original 8 ns long trajectories of wt C1Bα is shown on the same plot (yellow bars). Both wt and Y123W C1Bα sample open or partially open conformations that show a bimodal distribution. Frequent transitions between open and partially open conformations are observed along the trajectories. Snapshots of the structures with closed and open loop conformations are shown in (c) and (d), respectively. Loop regions are highlighted in purple.
The histogram of distances between the loop tips in the extended 10–18 ns trajectories is compared with the wt C1Bα data in Figure 8(b). Similar to the wt, once the binding loops of Y123W C1Bα reach the open conformation, they remain in the open conformation for the rest of the simulated trajectory. The distribution of the loop tip distances in both wt and Y123W C1Bα is bimodal and covers a similar range. Along with the open loop conformation at 12.5 Å, the wt protein also populates the state with a shorter distance between the loop tips, as illustrated by the small peak centered at 9.5 Å in Figure 8(b). This state is very rarely populated by Y123W C1Bα. Two snapshots of C1Bα structures with closed and open loop conformations, captured in the MD simulations, are presented in Figures 8(c) and (d). It is evident that the transition of loops β12 and β34 from the closed to open state has profound consequences for the geometry and size of the ligand-binding site.
The presence of hydrogen bonds was monitored during the simulation to identify those that stabilize the closed/open states of the binding loops. Six hydrogen bonds that correlate with the closed-to-open loop transition in Y123W C1Bα are listed in Table S1. Three of them, identified as primary bonds, are present in the closed state but are lost upon transition to the open state: Gln128-Pro112, Ser111-Gln128, and Thr108-Leu125. All of these bonds are inter-loop and involve side chains atoms (italicized) as one partner. The probabilities of the primary hydrogen bonds are correlated with the fraction of the trajectory corresponding to the closed loop conformation. These hydrogen bonds are never observed in the 8 ns trajectories collected for wt, where the loops are always in an open conformation. The correlation between the tip distance and the presence or absence of each of the three hydrogen bonds is evident in the trajectory of Figure S6, where the transition from the closed to open state occurs at ~4.2 ns. Three other hydrogen bonds that show weak but non-negligible correlation with the closed-to-open transition are Gln128-Leu122, Gly129-His107, and Tyr109-Gln128. These bonds are identified as secondary because, although their presence may promote the formation of the primary hydrogen bonds, they are not alone sufficient to facilitate the transition from the open to closed state.
The extensive involvement of Gln128 in inter- and intra-loop interactions has led us to examine this residue in more detail. Our NMR experiments indicate that Gln128, which is located at the C-terminal hinge of the β34 loop, undergoes conformational exchange in the wt and Y123W C1Bα. The sidechain of Gln128 is very dynamic in the MD trajectories of both proteins, as illustrated by the many transitions of the side chain dihedral angles χ1, χ2, and χ3 in Figure S7. For both wt and Y123W C1Bα, the χ3 angle samples a wide range of values, sometimes rotating by 360°. These sidechain dihedral transitions are often associated with the rearrangement of the Gln128 hydrogen-bonding network.
An example is given in Figure 9 that shows the time dependence of the dihedral angle, χ2, of Gln128 for one of the wt C1Bα trajectories. In this trajectory, the χ2 angle of Gln128 sidechain undergoes two transitions that are marked with dashed vertical lines. The changes in χ2 occur concomitantly with the rearrangement of the hydrogen-bonding network of Gln128, as shown in Figure 9(b). From 2 to 4 ns, transient hydrogen bonds form with other β34 loop residues (Gly124, Leu125, and Ile 126) and with two β12 residues (His107 and Thr108). Upon the first transition at ~4.3 ns, only intra-loop hydrogen bonds of β34 persist. The loss of inter-loop hydrogen bonds is not accompanied by a large change in the loop tip distance in wt C1Bα, as is evident from the histogram of Figure 8. Upon the second transition at ~6.5 ns, the only two hydrogen bonds that occur with high probability involve the sidechain and backbone atoms of Lys141.
Figure 9.

χ2 transitions and hydrogen bonds of Gln128 sidechain in wt C1Bα. (a) χ2 dihedral angle of Gln128 shown as a function of time for one of the wt C1Bα trajectories. (b) Hydrogen bonds formed by Gln128 for the same trajectory. The presence of a given hydrogen bond at any time point in the trajectory is indicated with a vertical line. The residues shown in italics have their sidechain atoms involved in the formation of hydrogen bonds. The residues shown in bold are involved in the formation of inter-loop hydrogen bonds. The χ2 transitions that occur at 4.4 and 6.5 ns correlate with the rearrangement of the hydrogen-bonding network of Gln128.
To summarize, our computational results indicate that, for both wt and Y123W C1Bα, the conformation with open ligand-binding loops is likely to represent the ground state that we detect by NMR spectroscopy. This conclusion is in general agreement with the NMR data that are available for other C1 domains. In the C1B domain from PKCγ, another conventional PKC isoform, the distances range from 10.5 to 12.5 Å in the NMR ensemble.22 In addition, our data support the central role of the Gln128 sidechain in modulating the structure and dynamics of loops β12 and β34 through the formation of transient hydrogen bonds.
DISCUSSION
The objective of this work was to understand the determinants of the C1 domain binding affinity to DAG, a membrane-localized second messenger. This question is significant because of the functional roles of C1 domains as membrane-targeting modules within their parent proteins. The intrinsic affinity of C1 domains to DAG determines the cellular concentration of the second messenger that is required for the propagation of the signaling response, and has important implications for the selectivity of that response. In the specific case of PKCs, their DAG-binding affinities determine which isoform gets preferentially activated and its localization in the cell.35 To date, only one ligand-bound structure of C1 domain has been determined.21 The structure belongs to the C1B domain from PKCδ, a high-affinity DAG-binding module in complex with a water-soluble phorbol ester. Two features of the apo-and ligand-bound C1Bδ structures are pertinent to this discussion. First, the complex is stabilized by five hydrogen bonds, which involve two oxygen-containing groups of the phorbol ester and the backbone amide and carbonyl groups of C1Bδ.21 Second, the sidechain of the residue at position 252 (123 if we use the PKCα numbering scheme) is not involved in any specific interactions with the ligand.
It is the position 123 in PKCβII, a conventional PKC isoform that proved to be essential to tuning the C1 affinity to DAG. Newton’s laboratory at UCSD found that the mutation of Tyr123, which is conserved in all three conventional isoforms (Figure 1), to Trp increases the in-vitro DAG affinity 33-fold. The mutation also made the C1BβII domain more responsive to DAG in vivo by altering the protein localization pattern from cytosol to juxtanuclear region under conditions of stimulated DAG production. Following the PKCβII lead, we introduced the same mutation into the C1B domain from PKCα and determined its binding affinity to DOG, a short-chain DAG analog, using solution NMR and fluorescence spectroscopy. The NMR and fluorescence titrations were carried out in the presence of DPC/DPS micelles for the dual purpose of keeping the protein-ligand complexes soluble and providing them with a membrane-mimicking environment. The binding curves of Figure 3 show that the Y123W mutation increases the DOG affinity of C1Bα at least 100-fold. Our data indicate that the mutation of Tyr123 to Trp converts C1Bα from low- to high-affinity DOG-binding module and that this property is shared by PKCα and PKCβ isoforms.
Having established a functional signature of the Y123W mutation in the form of altered DOG binding affinity, we characterized its effect on the structure and dynamics of C1Bα. The results of the chemical shift perturbation analysis and 1DNH measurements indicate that the mutation imposes a minimum structural perturbation on C1Bα in both apo- and DOG-bound forms. In the DOG-bound forms, we found that the C1Bα regions that are affected by ligand binding encompass the entire β12 and β34 loops (Figures 4(c) and (d)). Our data on the regions affected by ligand binding are in general agreement with the results of NMR binding studies on related DAG-responsive C1 domains in detergents.22,24 The favorable DOG-binding regime of C1Bα has enabled us to follow the titration behavior of individual residues and determine the dissociation constant.
In the absence of ligand, the interaction surface of Y123W C1Bα with detergent micelles is considerably larger than that of the wt. This surface includes the entire top half of the mutant protein as compared with only loop β34 in the wt (Figure 5). A plausible explanation is that Y123W C1Bα has higher affinity to ligand-free micelles than the wt because of the well-documented propensity of Trp to partition readily into the interfacial membrane regions.36,37 The pivotal role of position 123 (or equivalent) in protein-membrane interactions is corroborated by the mutagenesis studies of a related C1Bδ domain. The Trp to Gly mutant of C1Bδ was unable to interact with PDBu-containing phospholipid vesicles, while its binding affinity to PDBu in the absence of bilayers remained fairly high with a Kd of 25 nM.38 A recent stopped-flow study of C1BβII association with lipid membranes led to the proposal of the two-step binding mechanism, in which the first step involves the formation of the low-affinity protein-lipid complex.30 The binding of C1Bα to detergent micelles is intermediate on the chemical-shift timescale, which precludes the determination of Kd values by NMR. It has been reported that the Kd for the C1-lipid interactions in the absence of DAG and phorbol esters is on the order of 100 mM.9 Trp at position 123 can potentially increase the protein residency time at the membrane by decreasing the off-rate and thus facilitate the two-dimensional search for DAG that occurs in the second step of the binding process. Thus, we speculate that the preferential partitioning of Trp into the headgroup region of detergent micelles (and bilayers) can in part be responsible for the increased DAG affinity of the Y123W mutant.
It has been suggested for several protein systems that the sub-ns dynamics of protein backbone may play a role in the thermodynamics of ligand binding via the entropic contribution to free energy (reviewed in39). To determine if Y123W mutation alters the flexibility of C1Bα, we characterized the sub-ns dynamics of N-H groups. The comparison of order parameters for the wt and Y123W C1Bα shown in Figure 6 revealed no substantial differences between the two proteins. The loop residue with the lowest value of SNH2 is the mutation site. The order parameter of residue 123 is virtually identical for the wt and mutant C1Bα, despite having a different amino acid at this position. Our data also revealed reduced R2 values for the C-terminal region comprising residues Leu150-Cys151-Gly152. This implies that the coordination site of the second Zn2+ ion, which holds together the N- and C-termini through the coordination of His102 and Cys151 side-chains, is dynamic.
In contrast to the sub-ns dynamics, the conformational dynamics of C1Bα on the μs timescale differed significantly between the wt and mutant. In both cases however, our relaxation dispersion data are consistent with the two-site exchange process between the ground and excited states. The process is fast on the chemical-shift timescale. In the wt C1Bα, among the five residues that undergo conformational exchange with a global kex of 15400 s−1, the largest dispersion amplitudes were observed for the Gln128-Gly129 pair. This QG motif, which is located at the C-terminal hinge of loop β34, is part of the consensus sequence in DAG-binding C1 domains.1 Mutation of Gln128 to Gly or Trp abolishes PDBu binding in the C1Bδ domain.38 A conservative mutation of Gln128 to Glu preserved the ability of C1Bα to bind PDBu but completely abolished DOG binding (M. Stewart and T. Igumenova, unpublished data).
The results of our MD simulations support the conclusion about the pivotal role of Gln128 in controlling the geometry and dynamics of the ligand-binding site. For example, in the Y123W mutant, two primary hydrogen bonds that stabilize the closed loop conformation involve the Gln128 sidechain. In both wt and Y123W C1Bα, the sidechain of Gln128 executes frequent rotameric hops often accompanied by the formation of transient hydrogen bonds (Figure S7 and Figure 9). Atypical C1 domains that are not capable of binding DAG have a four amino acid deletion in the β34 loop, and the requirement for Gln at position 128 is relaxed. Moreover, the β34 loop was reported to be rigid in the NMR studies of an atypical C1 domain.25,26 Thus, the observed conformational flexibility of the QG motif may be an important functional feature that is shared by all DAG-responsive C1 domains.
In the Y123W mutant, nine residues that belong to the N- and C-terminal hinges of β12 and β34 loops show quantifiable dispersion with a kex of 9600 s−1. The most prominent differences between the wt and Y123W C1Bα are in the β34N and β12C regions (Figure 7(a)). For residues that show non-negligible dispersion in both proteins, we interpreted the differences between their kex and Φex values as being indicative of the change in the conformational equilibrium between their respective ground and excited states. According to our estimates, the population of the excited state in the mutant increases 1.6–1.7 fold compared to the wt protein.
To evaluate the role of conformational dynamics in the DAG ligand recognition and binding, we have to consider the nature of the excited state. Based on the position of the exchanging residues in the three-dimensional structure of C1Bα, we speculate that the process detected in NMR relaxation dispersion experiments involves the transient breaking and formation of hydrogen bonds at the hinges of the ligand-binding loops. The most likely NH···O=C donor-acceptor pairs involved in this process are Gly129-His107 in the wt, and Gly129-His107 and Leu122-Thr113 in the Y123W C1Bα (Figure 7(c)).
Related to the hydrogen bond dynamics is the question of the closed-to-open loop transition. According to the results of our MD simulations, the closed loop conformation is never repopulated once the transition to the open state occurs during the 0–2 ns equilibration period (wt) or the 2–10 ns trajectories (Y123W). The open-loop conformations appear to be more energetically favorable than the closed-loop ones and therefore are likely to represent the ground states of wt and Y123W C1Bα. The differences between the loop tip distance distributions for the two proteins shown in Figure 8(a) suggest that the closed-to-open loop transition occurs on a slower timescale in the mutant than in the wt, which is in general agreement with our k−1 estimates.
The MD simulations identify three hydrogen bonds (Thr108-Leu125, Ser111-Gln128, and Gln128-Pro112) whose presence stabilizes the closed state of the ligand-binding loops. These bonds are always absent in both wt and Y123W C1Bα when the loops are in the open state. The Gly129-His107 hydrogen bond is weakly correlated with the closed state of the Y123W mutant and is rarely formed in the open state of the wt C1Bα (Table S1). The Leu122-Thr113 hydrogen bond has a probability of 0.87 ± 0.22 and 0.90 ± 0.16 in the mutant and wt, respectively. Thus, the correlation between the status of the Gly129-His107 and Leu122-Thr113 hydrogen bonds and the presence of the fully closed form with the loop tip distance of 5 Å is rather weak.
Based on the results of our MD simulations and the structure of C1Bδ in complex with phorbol ester21, it is likely that the ground and excited states correspond to the open and partially closed conformations of the ligand-binding loops, respectively. The partially closed form may have a higher DAG affinity than the ground state with the open-loop conformation. DAG is a smaller ligand compared to the phorbol ester that has bulky polycyclic groups, and would be accommodated more effectively in a smaller inter-loop space. The secondary hydrogen bonds that involve the conserved QG motif (Gly129-His107, Gln128-Leu122, and Tyr109-Gln128, Table S1) stabilize the loop conformations observed in the MD simulations, and are also likely to stabilize the excited partially closed state.
The nominal time scale of the MD simulation is shorter than the time scale of the conformational transitions that determine the chemical exchange line-broadening; nonetheless, the results of the simulation suggests that the opening and closing of the ligand binding loops may provide the mechanism for the experimentally observed chemical exchange process. Further mutagenesis studies are required to more definitively determine the nature of these motional processes. In further support of our hypotheses about the excited state, we observed that the destabilization of the closed and partially closed conformation by introducing the Q128E mutation into C1Bα (and thus eliminating hydrogen bonds in which the Gln128 sidechain serves as a hydrogen-bond donor) preserved PDBu binding but completely abolished DOG binding (M. Stewart and T. Igumenova, unpublished data).
The main differences between the excited states in the Y123W and wt C1Bα are in the β12C and β34N regions. Thr113 (β12C) and Leu122 (β34N) are involved in hydrogen-bonding interactions between the β2 and β3 strands (Figure 7(c)), and show significant dispersion in the mutant but none in the wt. According to the crystal structure of the C1Bδ-phorbol ester complex21, the C20 O-H group of the phorbol ester, which mimics the O-H group of DAG, serves as an acceptor for the N-H of Thr113 and a donor to C=O of both Leu122 and Thr113. Transient breaking of the Leu122-Thr113 hydrogen bond can facilitate the entry of DAG into the binding site through the partial “unzipping” of the β2/β3 strands. Through this mechanism, the excited state of the Y123W mutant can potentially have higher DAG binding affinity than the excited state of the wt, where the exchange process affecting Thr113 and Leu122 is absent. The DAG binding event would then shift the conformational equilibrium between the ground and excited states towards the high-affinity excited state. This mechanism of ligand binding has been referred to as “pre-equilibrium” or selected-fit, with the implication being that the ligand selects a high-affinity conformer from an ensemble of two or more pre-existing conformers with comparable energy.40
Conformational plasticity of ligand-binding sites has been observed in other lipid-binding proteins. For example, it has been suggested that the conformational dynamics of sterol-binding protein 2 facilitates the access of ligands to the binding site and may be required for accommodating structurally diverse ligands.41 Conformational dynamics of intestinal fatty acid-binding protein have led to the “dynamic portal” hypothesis for ligand entry42,43 that has been tested recently using relaxation-dispersion experiments.44 Along with the structural features, conformational plasticity of lipid-binding proteins may be required to ensure their ligand promiscuity. For C1 domains, their ability to bind ligands other than DAG has been used to great advantage for designing inhibitors and activators.4
To conclude, structural considerations alone cannot fully explain a 100-fold change in the C1Bα affinity to DAG brought about by the Y123W mutation. Our data indicate that there are three factors that may lead to the enhancement of DAG-binding affinity in Y123W C1Bα: (1) the increased affinity of the mutant to ligand-free membranes; (2) the existence of the excited state that is capable of more efficiently capturing DAG; and (3) the increase in the population of this excited state compared to that of the wt protein. Understanding the origins of ligand binding affinity and specificity in C1 domains is important for developing ways to modulate the activity of PKCs for therapeutic and research applications. Full understanding of the molecular details of C1-DAG interactions will have to await the determination of the C1 structure in complex with DAG in the presence of a membrane mimic.
MATERIALS AND METHODS
Protein Overexpression and Purification
The DNA sequence of C1Bα domain from Mus musculus was amplified by PCR using the PKCα cDNA clone (Open Biosystems) as a template. A 53-residue construct of C1Bα, comprising residues S100 through G152 of PKCα, was subsequently cloned into a pET-SUMO expression vector (Invitrogen) as a C-terminal fusion with histidine-tagged SUMO, a small ubiquitin-like protein.45 Mutagenic DNA for the Y123W C1Bα mutant was constructed from the wt C1Bα gene using a Stratagene QuickChange™ site-directed mutagenesis kit and suitable PCR primers. Purified wt and mutagenic plasmids were transformed into BL21(DE3) E. coli cells. The proteins were over-expressed and purified as described in the Supplementary Material. For NMR experiments, the proteins were concentrated to 0.3–0.5 mM, and exchanged in the buffer containing 10 mM [2H-4]-imidazole at pH 6.5 (Cambridge Isotopes), 150 mM KCl, 8% 2H2O, 1 mM tris(2-carboxyethyl)phosphine (TCEP), and 0.02% NaN3. The purity of wt and Y123W C1Bα was assessed using SDS-PAGE. Molecular weight of the proteins was verified by MALDI TOF mass-spectrometry.
NMR Spectroscopy and Data Analysis
All NMR experiments were carried out at 25 °C on Varian Inova and VNMRS spectrometers operating at 1H Larmor frequencies of 500 (11.7 Tesla) and 600 MHz (14.1 Tesla). The temperature was calibrated using methanol. Sequential assignments of the backbone 1H, 13Cα, 13Cβ, and 15N resonances for the wt C1Bα were obtained using gradient-enhanced CBCA(CO)NH and HNCACB experiments.46 NMR data were processed with nmrPipe47 and assigned with Sparky.48
DAG- and PE-binding assays
2-dihexanoyl-sn-glycero-3-[phospho-L-serine] (DPS) and 1,2-dioctanoyl-sn-glycerol (DOG) were purchased from Avanti Polar Lipids. [2H38]-dodecylphosphocholine (DPC) and [2H6]-DMSO were from Cambridge Isotopes, and phorbol 12,13-dibutyrate (PDBu) was from Sigma-Aldrich. A stock solution of mixed micelles was prepared by combining chloroform solutions of DPS and DPC with a molar ratio of 3:7. Chloroform was removed under a stream of nitrogen gas, and then under vacuum for two hours. The detergent film was re-suspended in the NMR buffer and vortexed for one minute to form a clear micellar solution. The NMR titration samples contained DPC/DPS micelles with a total detergent concentration of 10 mM and 0.1 mM U-15N-enriched C1Bα. DOG or PDBu dissolved in [2H6]-DMSO was added stepwise directly to the NMR sample. The concentration of DMSO at the titration endpoint was 8% (v/v). The binding was monitored as a ligand concentration-dependent change of the cross-peak positions in a series of two-dimensional 15N-1H HSQC spectra. Residue-specific binding curves were constructed by plotting the absolute value of the change in 1H or 15N chemical shift, whichever is larger, as a function of the total ligand concentration, L0. The dissociation constant, KD, was determined by globally fitting the binding curves using the following equation:
| (1) |
where Δδ is the absolute value of the observed change in the chemical shift for 15N or 1H at a total ligand concentration L0, ΔδPL is the absolute value of the residue-specific chemical shift difference between bound and apo-forms of the protein, and P0 is the total protein concentration.49
Chemical shift perturbation analysis for PDBu and DOG binding
For all protein residues that responded to the addition of ligand, the normalized change in the chemical shift was determined according to the following equation:
| (2) |
where ΔδH and ΔδN are the chemical shift changes, and γH and γN are the gyromagnetic ratios of 1H and 15N nuclei, respectively. To confirm the C1Bα assignments in the ligand-bound form, we carried out a three-dimensional HN(CA)CB50 experiment on a sample containing 0.4 mM [U-13C,15N; 55%-2H] C1Bα, 0.5 mM PDBu, and 40 mM DPC/DPS micelles.
Measurements of 15N-1H residual dipolar couplings (RDCs)
Weakly aligned samples of wt and Y123W C1Bα were prepared in stretched polyacrylamide gels.51,52 6% gels were prepared using the appropriate dilution of 40% acrylamide and bis-acrylamide solution, 37.5:1 (Bio-Rad), 0.1% w/v ammonium persulfate (Fisher Scientific), and 0.08% v/v N,N,N′,N′-tetramethylethylenediamine (Fisher Scientific), and cast at a diameter of 6 mm. The gel was soaked overnight with 0.5 mM wt or Y123W C1Bα and then axially stretched into a 4.2 mm NMR tube using the apparatus obtained from New Era Enterprises.53 Site-specific residual dipolar couplings, 1DNH, were calculated from the in-phase anti-phase (IPAP)54 spectra as the difference between the splittings of the 15N doublet components in the aligned and isotropic spectra.
NMR relaxation experiments for probing sub-nanosecond motions
Longitudinal relaxation rate constant (R1), transverse relaxation rate constants (R2), and {1H}-15N nuclear Overhauser enhancement (nOe) were measured for all spectrally resolved N-H groups of protein backbone using standard methods.55 The measurements were carried out for both wt and Y123W C1Bα at two magnetic field strengths, 11.7 and 14.1 T. Nine time points ranging from 0.012 to 0.180 s (R2) and 0.031 and 0.600 s (R1) were collected, three of which were duplicates. The nOe data were acquired in an interleaved manner, with a 3 s saturation period and a 5 s recycle delay. Cross-peak intensities were used to quantify relaxation, and the uncertainties of these intensities were estimated either from the root-mean-square noise level of the base plane (nOe) or from duplicate measurements (R1 and R2).
The rotational diffusion properties of C1Bα were evaluated with HYDRONMR56 and R2/R1 ratios,57 using the ensemble-averaged NMR structure of C1Bα23 kindly provided by Dr. Ulrich Hommel. HYDRONMR calculations were carried out with atomic element radii a of 2.5 Å (minimum) and 2.8 Å (maximum). The a values in this range were shown previously to provide the best agreement with experimental data for proteins with intermediate anisotropy.58 Estimation of the rotational diffusion tensor based on the R2/R1 ratios was done using the program R2R1_diffusion (available from the laboratory of Dr. Arthur G. Palmer, III at Columbia University). Residues that are exchange-broadened and/or have nOe values less than 0.65 were eliminated from the analysis using the criteria outlined in Tjandra et al.57 and the results of the rotating-frame relaxation dispersion experiments (vide infra).
Relaxation data sets were analyzed using Lipari-Szabo model-free formalism59 for the case of axially symmetric rotational diffusion, as implemented in the program ModelFree4.20.60 The formalism relies on the explicit separation of timescales for local and overall rotational motions. The information on the internal motions of 15N-1H vectors is obtained in the form of generalized order parameters, S2, which report on spatial restriction of motion, and effective correlation times, τe, which report on the rate of motion. Five different models having the following parameterization are implemented in ModelFree4.20 to facilitate the relaxation data analysis: (1) S2; (2) S2, τe; (3) S2, Rex; (4) S2, τe, Rex; and (5) S2f, S2s, τs. Rex is the contribution of conformational exchange to the R2; S2f and S2s are the generalized order parameters for the fast and slow internal motions; and τs is the time constant for the slow internal motion.
The Fast-Modelfree program61 was used to generate the input files and carry out the model selection according to Mandel et al.60 ModelFree4.20 was used for the simultaneous optimization of the rotational diffusion tensor and motional parameters for the 15N spins assigned to Models 1 and 2. Model selection and rotational diffusion tensor optimization were iterated until no changes were detected in the model assignment and tensor parameters. The optimized values of the axially symmetric rotational diffusion tensor were τm=3.19 ± 0.03 (3.07 ± 0.03) ns, D||/D⊥=1.36 ± 0.08 (1.37 ± 0.08), Ω=92.1 ± 7.1° (94.7 ± 7.6°), and Φ=267.8 ± 9.4° (275.9 ± 9.2°) for the wt (Y123W) C1Bα, respectively. Ω and Φ are the Euler angles relating the principle Z axis of the diffusion tensor to the Z axis of the molecular frame of the ensemble-averaged NMR structure of C1Bα. The final calculation was carried out for all spins using the optimized parameters for the rotational diffusion tensor.
Rotating-frame (R1ρ) relaxation dispersion measurements and data analysis
Rotating-frame relaxation rate constants, R1ρ, were measured for all resolved amide groups at two static magnetic fields, 11.7 and 14.1 T. R1ρ values depend on R1, R2, and the angle θ between the effective radiofrequency field ωe and the direction of the static magnetic field as follows:
| (3) |
| (4) |
| (5) |
where ω1 is the amplitude of the applied radiofrequency field and Ω is the resonance offset. In the presence of conformational exchange, R2 can be expressed as a sum of two terms:
| (6) |
where R20 is the free-of-exchange transverse relaxation rate constant. For a two-state conformational exchange A ⇔ B that is fast on the chemical-shift timescale, the dependence of Rex on the parameters of the exchange process is described by the following equation:
| (7) |
in which and kex =k1+ k−1. k1 and k−1 are the forward and reverse rate constants; pA and pB are the populations; and ΔωN is the residue-specific 15N chemical shift difference for the conformers A and B.
Off-62 and near-resonance63 R1ρ measurements were carried out with a maximum relaxation delay of 160 ms using established pulse sequences.64 The alignment of 15N magnetization with the effective field ωe was accomplished with a 90°x-delay-90°y element in the near-resonance65, and a tan/tanh adiabatic ramp66 in the off-resonance R1ρ experiments. The duration of the adiabatic ramp was 6 ms with a frequency sweep starting at −15,000 Hz from the carrier frequency. Radio-frequency amplitudes ω1 were calibrated using the scaling of 1JNH coupling constant by the off-resonance decoupling as described by Palmer et al.67 In the off-resonance R1ρ experiments, ω1/2π ranged from 1030 to 1950 Hz, and the carrier offset was varied to produce θ in the range of 25–68° for the residues of interest. In the near-resonance R1ρ experiments, the minimum value of ω1/2π was 480 Hz, and the θ values were in the range of 68–90°. R2 values were obtained from Eq. (3) for each effective field ωe using the experimentally measured R1, R1ρ, and calculated tilt angles θ.
Residue-specific relaxation dispersion curves R2(ωe2) were fit with Eq. (6) and (7) using R20, Φex, and kex as adjustable parameters. Where possible, the initial values of R20 were estimated and constrained during the fit using 1H-15N dipole-dipole (DD)/15N chemical shielding anisotropy (CSA) cross-correlated relaxation rate constants ηxy. In brief, auto- and cross-relaxation spectra for the ηxy measurements68,69 were collected in an interleaved manner at two static magnetic fields, 11.7 and 14.1 T, for both wt and Y123W C1Bα. The relaxation delays were 0.0430, 0.0645, 0.0860, 0.1075, and 0.1290 s. ηxy was determined by fitting the ratios of peak intensities in cross- and auto-relaxation experiments with a tanh(−ηxyt) function. Parameter κ was calculated as the mean of the R20/ηxy ratios70 for all non-exchanging residues. The R20 values for the exchanging residues were estimated as κηxy71. Fitting of the relaxation dispersion curves was carried out using Igor Pro (WaveMetrics, Lake Oswego, OR). The fitting procedure was implemented individually for each exchanging residue using a two-state exchange model described by Eq (7). The use of a three-state exchange model did not produce a statistically significant improvement of the fit. Because individual kex values were tightly clustered ((1.29−2.25)×104 and (0.78−1.68)×104 s−1 in the wt and Y123W C1Bα, respectively), the exchanging residues were fit with a global kex value.
Fluorescence Spectroscopy
The Y123W C1Bα sample in DPC/DPS micelles was prepared identically to the NMR titration sample, except the protein concentration was 0.5 μM and the buffer contained 10 mM 2-(N-morpholino) ethanesulfonic acid (MES) (Fisher Scientific) instead of imidazole. The buffer solution was treated with Chelex 100 resin (Sigma) to remove divalent metal ions. DOG dissolved in [2H6]-DMSO was titrated simultaneously into the Y123W C1Bα sample and the “blank” sample containing all other components but the protein. Total signal intensity was recorded with a 335 nm cut-off filter on an ISS Koala fluorimeter (ISS, Champaign, IL) with the excitation wavelength of 295 nm. The fraction of DOG-bound Y123W C1Bα was calculated as ΔF/F0, where ΔF is the absolute value of the intensity change corrected for protein dilution during the titration, and F0 is the fluorescence intensity in the absence of DOG. The data were fitted using the following equation:
| (8) |
where the parameters are identical to those of Eq. (1). The binding experiment was repeated three times and normalized individually to the 0.7 μM DOG concentration point. Using SDS-PAGE combined with silver staining, we established that about ~50% of Y123W C1Bα adsorbs on the quartz cuvette walls. This behavior was not alleviated by coating the cuvette with Sigmacote (Sigma-Aldrich). Therefore, we used total protein concentration as an adjustable parameter when fitting the binding data with Eq. (8).
Molecular Dynamics Simulations and Data Analysis
Model 1 from the ensemble of NMR structures of C1Bα23 served as the starting configuration of the MD simulation. Mutation of Tyr123 to Trp was performed with the Mutator plug-in of Visual Molecular Dynamics (VMD) program.72 The initial structures of wt C1Bα and mutant were solvated in a TIP3P water box and neutralized using VMD. Structural optimization and MD simulations were carried out with the NAMD 2.7 molecular dynamics package73 and the CHARMM27 force field.74 A nonbonded model that included charge transfer and local polarization effects75 was used to model the zinc interactions. The systems were first minimized using a conjugate gradient algorithm and then equilibrated in the isothermal-isobaric ensemble using Langevin dynamics and the Nosé-Hoover Langevin piston method. Electrostatics were treated with the particle mesh Ewald algorithm with periodic boundary conditions to avoid edge effects. The SHAKE constraint algorithm76 was used with a 2 fs time step. Subsequently, equilibration was performed in the microcanonical ensemble with velocity reassignment to ensure the stability of the temperature. Three independent trajectories of wt C1Bα were simulated in the microcanonical ensemble for 10 ns, while three independent 18 ns trajectories were collected for Y123W C1Bα. In each case, the final 8 ns and 16 ns for the wt and mutant, respectively, were used for the subsequent analyses.
The following definitions were used when analyzing the trajectories. A hydrogen bond is defined by a donor-acceptor distance of less than 4.0 Å and an angle in the range of 113–180°.77 Three dihedral angles, χ1 through χ3, were used to quantify the side chain rotations of Gln128. The angles are defined by the following heavy atoms: (N, Cα, Cβ, Cγ), (Cα, Cβ, Cγ, Cδ), and (Cβ, Cγ, Cδ, Nε). Dihedral angles are typically restricted to −180° < θ < 180°. In this work, the range was expanded to −360° < θ < 360° for both the side chain dihedral angles of Gln128 and the ϕ dihedral angles of the protein backbone. This expansion enabled us to sample the full range of motions in the highly dynamic β12/β34 loop region of C1Bα without introducing a discontinuity when the dihedral angles are plotted as a function of time. The distance between the loop tips was defined as the distance between the Cα atoms of Ser111 and Leu125.
In one trajectory of C1Bα, Cys151 Sγ becomes uncoordinated from its zinc ion. Instead, a water molecule forms a bridge between Cys151 and the zinc ion, although once Cys151 displaces the water and regains its coordination transiently. Two other water molecules are coordinated to this zinc ion when the coordination with Cys151 is disrupted. The zinc ion closer to the loops remains coordinated to all of its atoms in C1Bα, but a water molecule often becomes coordinated next to His140 Nδ, which distorts the tetrahedral geometry. This loss of Zn2+ coordination by Cys151 has been also observed experimentally (manuscript in preparation). In one of the trajectories of Y123W C1Bα, the coordination of Cys132 is lost after approximately 16 ns. The distortion of the tetrahedral geometry near His140 due to the presence of a water molecule can also occur in Y123W C1Bα. This distortion of the tetrahedral geometry of the zinc ion is not an artifact of the particular Zn2+ model used in the MD simulations. Simulations of proteins that used this polarizable model for Zn2+ maintain the tetrahedral coordination geometry of the zinc ions observed in all X-ray and NMR structures of zinc finger proteins and of most enzymes.75,78
Supplementary Material
Acknowledgments
The authors thank Dr. Mark Rance (University of Cincinnati) for the ηxy pulse sequence; Dr. James Kempf (Rensselaer Polytechnic Institute) for the program to generate adiabatic ramps; and Dr. Mauricio Lasagna (Texas A&M University) for help with fluorescence experiments. This work was supported by startup funds from Texas A&M University and Ralph E. Powe junior faculty enhancement award from Oak Ridge Associated Universities (T.I.I.); Worcester Foundation For Biomedical Research Scholar Award (F.M.); and NIH Training Grant 5-T32GM065088 (M.D.S).
Abbreviations used
- PKCs
protein kinase C isoenzymes
- wt
wild-type
- C1Bα
C1B domain of protein kinase Cα
- DAG
diacylglycerol
- PE
phorbol ester
- HSQC
heteronuclear single quantum coherence
- PDBu
phorbol 12,13-dibutyrate
- DPS
2-dihexanoyl-sn-glycero-3-[phospho-L-serine]
- DOG
1,2-dioctanoyl-sn-glycerol
- PtdSer
phosphatidylserine
- PC
phosphatidylcholine
- RDC
residual dipolar coupling
- MD
molecular dynamics
Footnotes
Publisher's Disclaimer: This is a PDF file of an unedited manuscript that has been accepted for publication. As a service to our customers we are providing this early version of the manuscript. The manuscript will undergo copyediting, typesetting, and review of the resulting proof before it is published in its final citable form. Please note that during the production process errors may be discovered which could affect the content, and all legal disclaimers that apply to the journal pertain.
References
- 1.Hurley JH, Newton AC, Parker PJ, Blumberg PM, Nishizuka Y. Taxonomy and function of C1 protein kinase C homology domains. Protein Sci. 1997;6:477–480. doi: 10.1002/pro.5560060228. [DOI] [PMC free article] [PubMed] [Google Scholar]
- 2.Brose N, Rosenmund C. Move over protein kinase C, you’ve got company: alternative cellular effectors of diacylglycerol and phorbol esters. J Cell Sci. 2002;115:4399–4411. doi: 10.1242/jcs.00122. [DOI] [PubMed] [Google Scholar]
- 3.Kazanietz MG. Targeting protein kinase C and “non-kinase” phorbol ester receptors: emerging concepts and therapeutic implications. Biochim Biophys Acta. 2005;1754:296–304. doi: 10.1016/j.bbapap.2005.07.034. [DOI] [PubMed] [Google Scholar]
- 4.Blumberg PM, Kedei N, Lewin NE, Yang D, Czifra G, Pu Y, Peach ML, Marquez VE. Wealth of opportunity - the C1 domain as a target for drug development. Curr Drug Targets. 2008;9:641–652. doi: 10.2174/138945008785132376. [DOI] [PMC free article] [PubMed] [Google Scholar]
- 5.Goel G, Makkar HP, Francis G, Becker K. Phorbol esters: structure, biological activity, and toxicity in animals. Int J Toxicol. 2007;26:279–288. doi: 10.1080/10915810701464641. [DOI] [PubMed] [Google Scholar]
- 6.Kazanietz MG, Lorenzo PS. Phorbol esters as probes for the study of protein kinase C function. In: Newton AC, editor. Protein Kinase C Protocols. Vol. 233. 2003. pp. 423–429. [DOI] [PubMed] [Google Scholar]
- 7.Griner EM, Kazanietz MG. Protein kinase C and other diacylglycerol effectors in cancer. Nat Rev Cancer. 2007;7:281–294. doi: 10.1038/nrc2110. [DOI] [PubMed] [Google Scholar]
- 8.Castagna M, Takai Y, Kaibuchi K, Sano K, Kikkawa U, Nishizuka Y. Direct activation of calcium-activated, phospholipid-dependent protein kinase by tumor-promoting phorbol esters. J Biol Chem. 1982;257:7847–7851. [PubMed] [Google Scholar]
- 9.Newton AC. Protein kinase C: structural and spatial regulation by phosphorylation, cofactors, and macromolecular interactions. Chem Rev. 2001;101:2353–2364. doi: 10.1021/cr0002801. [DOI] [PubMed] [Google Scholar]
- 10.Steinberg SF. Structural basis of protein kinase C isoform function. Physiol Rev. 2008;88:1341–1378. doi: 10.1152/physrev.00034.2007. [DOI] [PMC free article] [PubMed] [Google Scholar]
- 11.House C, Kemp BE. Protein kinase C contains a pseudosubstrate prototype in its regulatory domain. Science. 1987;238:1726–1728. doi: 10.1126/science.3686012. [DOI] [PubMed] [Google Scholar]
- 12.Shao XG, Davletov BA, Sutton RB, Sudhof TC, Rizo J. Bipartite Ca2+-binding motif in C2 domains of synaptotagmin and protein kinase C. Science. 1996;273:248–251. doi: 10.1126/science.273.5272.248. [DOI] [PubMed] [Google Scholar]
- 13.Cho W, Stahelin RV. Membrane binding and subcellular targeting of C2 domains. Biochim Biophys Acta. 2006;1761:838–849. doi: 10.1016/j.bbalip.2006.06.014. [DOI] [PubMed] [Google Scholar]
- 14.Irie K, Oie K, Nakahara A, Yanai Y, Ohigashi H, Wender PA, Fukuda H, Konishi H, Kikkawa U. Molecular basis for protein kinase C isozyme-selective binding: the synthesis, folding, and phorbol ester binding of the cysteine-rich domains of all protein kinase C isozymes. J Am Chem Soc. 1998;120:9159–9167. [Google Scholar]
- 15.Ananthanarayanan B, Stahelin RV, Digman MA, Cho WH. Activation mechanisms of conventional protein kinase C isoforms are determined by the ligand affinity and conformational flexibility of their C1 domains. J Biol Chem. 2003;278:46886–46894. doi: 10.1074/jbc.M307853200. [DOI] [PubMed] [Google Scholar]
- 16.Slater SJ, Ho C, Kelly MB, Larkin JD, Taddeo FJ, Yeager MD, Stubbs CD. Protein kinase C α contains two activator binding sites that bind phorbol esters and diacylglycerols with opposite affinities. J Biol Chem. 1996;271:4627–4631. doi: 10.1074/jbc.271.9.4627. [DOI] [PubMed] [Google Scholar]
- 17.Medkova M, Cho WH. Interplay of C1 and C2 domains of protein kinase C-α in its membrane binding and activation. J Biol Chem. 1999;274:19852–19861. doi: 10.1074/jbc.274.28.19852. [DOI] [PubMed] [Google Scholar]
- 18.Stahelin RV, Digman MA, Medkova M, Ananthanarayanan B, Rafter JD, Melowic HR, Cho WH. Mechanism of diacylglycerol-induced membrane targeting and activation of protein kinase C δ. J Biol Chem. 2004;279:29501–29512. doi: 10.1074/jbc.M403191200. [DOI] [PubMed] [Google Scholar]
- 19.Szallasi Z, Bogi K, Gohari S, Biro T, Acs P, Blumberg PM. Non-equivalent roles for the first and second zinc fingers of protein kinase C δ. Effect of their mutation on phorbol ester-induced translocation in NIH 3T3 cells. J Biol Chem. 1996;271:18299–18301. doi: 10.1074/jbc.271.31.18299. [DOI] [PubMed] [Google Scholar]
- 20.Grishin NV. Treble clef finger - a functionally diverse zinc-binding structural motif. Nucleic Acids Res. 2001;29:1703–1714. doi: 10.1093/nar/29.8.1703. [DOI] [PMC free article] [PubMed] [Google Scholar]
- 21.Zhang GG, Kazanietz MG, Blumberg PM, Hurley JH. Crystal-structure of the Cys2 activator-binding domain of protein kinase C-δ in complex with phorbol ester. Cell. 1995;81:917–924. doi: 10.1016/0092-8674(95)90011-x. [DOI] [PubMed] [Google Scholar]
- 22.Xu RX, Pawelczyk T, Xia TH, Brown SC. NMR structure of a protein kinase C-γ phorbol-binding domain and study of protein-lipid micelle interactions. Biochemistry. 1997;36:10709–10717. doi: 10.1021/bi970833a. [DOI] [PubMed] [Google Scholar]
- 23.Hommel U, Zurini M, Luyten M. Solution structure of a cysteine-rich domain of rat protein kinase C. Nat Struct Biol. 1994;1:383–387. doi: 10.1038/nsb0694-383. [DOI] [PubMed] [Google Scholar]
- 24.Shen N, Guryev O, Rizo J. Intramolecular occlusion of the diacylglycerol-binding site in the C1 domain of munc13-1. Biochemistry. 2005;44:1089–1096. doi: 10.1021/bi0476127. [DOI] [PubMed] [Google Scholar]
- 25.Mott HR, Carpenter JW, Zhong S, Ghosh S, Bell RM, Campbell SL. The solution structure of the Raf-1 cysteine-rich domain: a novel Ras and phospholipid binding site. Proc Natl Acad Sci U S A. 1996;93:8312–8317. doi: 10.1073/pnas.93.16.8312. [DOI] [PMC free article] [PubMed] [Google Scholar]
- 26.Zhou M, Horita DA, Waugh DS, Byrd RA, Morrison DK. Solution structure and functional analysis of the cysteine-rich C1 domain of kinase suppressor of Ras (KSR) J Mol Biol. 2002;315:435–446. doi: 10.1006/jmbi.2001.5263. [DOI] [PubMed] [Google Scholar]
- 27.Harjes E, Harjes S, Wohlgemuth S, Muller KH, Krieger E, Herrmann C, Bayer P. GTP-Ras disrupts the intramolecular complex of C1 and RA domains of Nore1. Structure. 2006;14:881–888. doi: 10.1016/j.str.2006.03.008. [DOI] [PubMed] [Google Scholar]
- 28.Xu GY, McDonagh T, Yu HA, Nalefski EA, Clark JD, Cumming DA. Solution structure and membrane interactions of the C2 domain of cytosolic phospholipase A(2) J Mol Biol. 1998;280:485–500. doi: 10.1006/jmbi.1998.1874. [DOI] [PubMed] [Google Scholar]
- 29.Dries DR, Gallegos LL, Newton AC. A single residue in the C1 domain sensitizes novel protein kinase C isoforms to cellular diacylglycerol production. J Biol Chem. 2007;282:826–830. doi: 10.1074/jbc.C600268200. [DOI] [PubMed] [Google Scholar]
- 30.Dries DR, Newton AC. Kinetic analysis of the interaction of the C1 domain of protein kinase C with lipid membranes by stopped-flow spectroscopy. J Biol Chem. 2008;283:7885–7893. doi: 10.1074/jbc.M709943200. [DOI] [PubMed] [Google Scholar]
- 31.Lemmon MA. Membrane recognition by phospholipid-binding domains. Nat Rev Mol Cell Biol. 2008;9:99–111. doi: 10.1038/nrm2328. [DOI] [PubMed] [Google Scholar]
- 32.Millet O, Mittermaier A, Baker D, Kay LE. The effects of mutations on motions of side-chains in protein L studied by 2H NMR dynamics and scalar couplings. J Mol Biol. 2003;329:551–563. doi: 10.1016/s0022-2836(03)00471-6. [DOI] [PubMed] [Google Scholar]
- 33.Oxenoid K, Rice AJ, Chou JJ. Comparing the structure and dynamics of phospholamban pentamer in its unphosphorylated and pseudo-phosphorylated states. Protein Sci. 2007;16:1977–1983. doi: 10.1110/ps.072975107. [DOI] [PMC free article] [PubMed] [Google Scholar]
- 34.Hritz J, Ulicny J, Laaksonen A, Jancura D, Miskovsky P. Molecular interaction model for the C1B domain of protein kinase C-γ in the complex with its activator phorbol-12-myristate-13-acetate in water solution and lipid bilayer. J Med Chem. 2004;47:6547–55. doi: 10.1021/jm049786s. [DOI] [PubMed] [Google Scholar]
- 35.Gallegos LL, Newton AC. Spatiotemporal dynamics of lipid signaling: protein kinase C as a paradigm. IUBMB Life. 2008;60:782–789. doi: 10.1002/iub.122. [DOI] [PMC free article] [PubMed] [Google Scholar]
- 36.Yau WM, Wimley WC, Gawrisch K, White SH. The preference of tryptophan for membrane interfaces. Biochemistry. 1998;37:14713–14718. doi: 10.1021/bi980809c. [DOI] [PubMed] [Google Scholar]
- 37.Killian JA, von Heijne G. How proteins adapt to a membrane-water interface. Trends Biochem Sci. 2000;25:429–434. doi: 10.1016/s0968-0004(00)01626-1. [DOI] [PubMed] [Google Scholar]
- 38.Kazanietz MG, Wang S, Milne GWA, Lewin NE, Liu HL, Blumberg PM. Residues in the second cysteine-rich region of protein kinase C-δ relevant to phorbol ester binding as revealed by site-directed mutagenesis. J Biol Chem. 1995;270:21852–21859. doi: 10.1074/jbc.270.37.21852. [DOI] [PubMed] [Google Scholar]
- 39.Jarymowycz VA, Stone MJ. Fast time scale dynamics of protein backbones: NMR relaxation methods, applications, and functional consequences. Chem Rev. 2006;106:1624–1671. doi: 10.1021/cr040421p. [DOI] [PubMed] [Google Scholar]
- 40.James LC, Tawfik DS. Conformational diversity and protein evolution - a 60-year-old hypothesis revisited. Trends Biochem Sci. 2003;28:361–368. doi: 10.1016/S0968-0004(03)00135-X. [DOI] [PubMed] [Google Scholar]
- 41.Filipp FV, Sattler M. Conformational plasticity of the lipid transfer protein SCP2. Biochemistry. 2007;46:7980–7991. doi: 10.1021/bi6025616. [DOI] [PMC free article] [PubMed] [Google Scholar]
- 42.Hodsdon ME, Cistola DP. Ligand binding alters the backbone mobility of intestinal fatty acid-binding protein as monitored by 15N NMR relaxation and 1H exchange. Biochemistry. 1997;36:2278–2290. doi: 10.1021/bi962018l. [DOI] [PubMed] [Google Scholar]
- 43.Hodsdon ME, Cistola DP. Discrete backbone disorder in the nuclear magnetic resonance structure of apo intestinal fatty acid-binding protein: implications for the mechanism of ligand entry. Biochemistry. 1997;36:1450–1460. doi: 10.1021/bi961890r. [DOI] [PubMed] [Google Scholar]
- 44.Long D, Yang D. Millisecond timescale dynamics of human liver fatty acid binding protein: testing of its relevance to the ligand entry process. Biophys J. 2010;98:3054–3061. doi: 10.1016/j.bpj.2010.03.047. [DOI] [PMC free article] [PubMed] [Google Scholar]
- 45.Butt TR, Edavettal SC, Hall JP, Mattern MR. SUMO fusion technology for difficult-to-express proteins. Protein Expression Purif. 2005;43:1–9. doi: 10.1016/j.pep.2005.03.016. [DOI] [PMC free article] [PubMed] [Google Scholar]
- 46.Muhandiram DR, Kay LE. Gradient-enhanced triple-resonance three-dimensional NMR experiments with improved sensitivity. J Magn Reson, Ser B. 1994;103:203–216. [Google Scholar]
- 47.Delaglio F, Grzesiek S, Vuister GW, Zhu G, Pfeifer J, Bax A. NMRPipe - a multidimensional spectral processing system based on unix pipes. J Biomol NMR. 1995;6:277–293. doi: 10.1007/BF00197809. [DOI] [PubMed] [Google Scholar]
- 48.Goddard TD, Kneller DG. SPARKY. Vol. 3. University of California; San Francisco: [Google Scholar]
- 49.Wilcox CS. Design, synthesis, and evaluation of an efficacious functional group dyad. Methods and limitations in the use of NMR for measuring host-guest interactions. In: Schneider HJ, Dürr H, editors. Frontiers in Supramolecular Organic Chemistry and Photochemistry. Wiley-VCH; Weinheim: 1991. pp. 123–143. [Google Scholar]
- 50.Yamazaki T, Lee W, Arrowsmith CH, Muhandiram DR, Kay LE. A suite of triple-resonance NMR experiments for the backbone assignment of 15N, 13C, 2H labeled proteins with high-sensitivity. J Am Chem Soc. 1994;116:11655–11666. [Google Scholar]
- 51.Sass HJ, Musco G, Stahl SJ, Wingfield PT, Grzesiek S. Solution NMR of proteins within polyacrylamide gels: diffusional properties and residual alignment by mechanical stress or embedding of oriented purple membranes. J Biomol NMR. 2000;18:303–309. doi: 10.1023/a:1026703605147. [DOI] [PubMed] [Google Scholar]
- 52.Tycko R, Blanco FJ, Ishii Y. Alignment of biopolymers in strained gels: a new way to create detectable dipole-dipole couplings in high-resolution biomolecular NMR. J Am Chem Soc. 2000;122:9340–9341. [Google Scholar]
- 53.Chou JJ, Gaemers S, Howder B, Louis JM, Bax A. A simple apparatus for generating stretched polyacrylamide gels, yielding uniform alignment of proteins and detergent micelles. J Biomol NMR. 2001;21:377–382. doi: 10.1023/a:1013336502594. [DOI] [PubMed] [Google Scholar]
- 54.Ottiger M, Delaglio F, Bax A. Measurement of J and dipolar couplings from simplified two-dimensional NMR spectra. J Magn Reson. 1998;131:373–378. doi: 10.1006/jmre.1998.1361. [DOI] [PubMed] [Google Scholar]
- 55.Farrow NA, Muhandiram R, Singer AU, Pascal SM, Kay CM, Gish G, Shoelson SE, Pawson T, Formankay JD, Kay LE. Backbone dynamics of a free and a phosphopeptide-complexed Src homology-2 domain studied by 15N NMR relaxation. Biochemistry. 1994;33:5984–6003. doi: 10.1021/bi00185a040. [DOI] [PubMed] [Google Scholar]
- 56.de la Torre JG, Huertas ML, Carrasco B. HYDRONMR: Prediction of NMR relaxation of globular proteins from atomic-level structures and hydrodynamic calculations. J Magn Reson. 2000;147:138–146. doi: 10.1006/jmre.2000.2170. [DOI] [PubMed] [Google Scholar]
- 57.Tjandra N, Feller SE, Pastor RW, Bax A. Rotational diffusion anisotropy of human ubiquitin from 15N NMR relaxation. J Am Chem Soc. 1995;117:12562–12566. [Google Scholar]
- 58.Hall JB, Fushman D. Characterization of the overall and local dynamics of a protein with intermediate rotational anisotropy: differentiating between conformational exchange and anisotropic diffusion in the B3 domain of protein G. J Biomol NMR. 2003;27:261–275. doi: 10.1023/a:1025467918856. [DOI] [PubMed] [Google Scholar]
- 59.Lipari G, Szabo A. Model-free approach to the interpretation of nuclear magnetic-resonance relaxation in macromolecules. 1 Theory and range of validity. J Am Chem Soc. 1982;104:4546–4559. [Google Scholar]
- 60.Mandel AM, Akke M, Palmer AG. Backbone dynamics of Escherichia coli ribonuclease HI: correlations with structure and function in an active enzyme. J Mol Biol. 1995;246:144–163. doi: 10.1006/jmbi.1994.0073. [DOI] [PubMed] [Google Scholar]
- 61.Cole R, Loria JP. FAST-Modelfree: a program for rapid automated analysis of solution NMR spin-relaxation data. J Biomol NMR. 2003;26:203–213. doi: 10.1023/a:1023808801134. [DOI] [PubMed] [Google Scholar]
- 62.Akke M, Palmer AG. Monitoring macromolecular motions on microsecond to millisecond time scales by R1ρ-R1 constant relaxation time NMR spectroscopy. J Am Chem Soc. 1996;118:911–912. [Google Scholar]
- 63.Szyperski T, Luginbuhl P, Otting G, Guntert P, Wuthrich K. Protein dynamics studied by rotating frame 15N spin relaxation-times. J Biomol NMR. 1993;3:151–164. doi: 10.1007/BF00178259. [DOI] [PubMed] [Google Scholar]
- 64.Palmer AG, Massi F. Characterization of the dynamics of biomacromolecules using rotating-frame spin relaxation NMR spectroscopy. Chem Rev. 2006;106:1700–1719. doi: 10.1021/cr0404287. [DOI] [PubMed] [Google Scholar]
- 65.Yamazaki T, Muhandiram R, Kay LE. NMR experiments for the measurement of carbon relaxation properties in highly enriched, uniformly 13C, 15N-labeled proteins - application to 13Cα carbons. J Am Chem Soc. 1994;116:8266–8278. [Google Scholar]
- 66.Mulder FAA, de Graaf RA, Kaptein R, Boelens R. An off-resonance rotating frame relaxation experiment for the investigation of macromolecular dynamics using adiabatic rotations. J Magn Reson. 1998;131:351–357. doi: 10.1006/jmre.1998.1380. [DOI] [PubMed] [Google Scholar]
- 67.Palmer AG, Kroenke CD, Loria JP. Nuclear magnetic resonance methods for quantifying microsecond- to-millisecond motions in biological macromolecules. Methods Enzymol. 2001;339:204–238. doi: 10.1016/s0076-6879(01)39315-1. [DOI] [PubMed] [Google Scholar]
- 68.Tjandra N, Szabo A, Bax A. Protein backbone dynamics and 15N chemical shift anisotropy from quantitative measurement of relaxation interference effects. J Am Chem Soc. 1996;118:6986–6991. [Google Scholar]
- 69.Kroenke CD, Loria JP, Lee LK, Rance M, Palmer AG. Longitudinal and transverse 1H-15N dipolar/15N chemical shift anisotropy relaxation interference: unambiguous determination of rotational diffusion tensors and chemical exchange effects in biological macromolecules. J Am Chem Soc. 1998;120:7905–7915. [Google Scholar]
- 70.Fushman D, Cowburn D. Model-independent analysis of 15N chemical shift anisotropy from NMR relaxation data. Ubiquitin as a test example. J Am Chem Soc. 1998;120:7109–7110. [Google Scholar]
- 71.Wang CY, Rance M, Palmer AG. Mapping chemical exchange in proteins with MW > 50 kD. J Am Chem Soc. 2003;125:8968–8969. doi: 10.1021/ja035139z. [DOI] [PubMed] [Google Scholar]
- 72.Humphrey W, Dalke A, Schulten K. VMD - Visual Molecular Dynamics. J Mol Graphics. 1996;14:33–38. doi: 10.1016/0263-7855(96)00018-5. [DOI] [PubMed] [Google Scholar]
- 73.Phillips JC, Braun R, Wang W, Gumbart J, Tajkhorshid E, Villa E, Chipot C, Skeel RD, Kale L, Schulten K. Scalable molecular dynamics with NAMD. J Comput Chem. 2005;26:1781–1802. doi: 10.1002/jcc.20289. [DOI] [PMC free article] [PubMed] [Google Scholar]
- 74.MacKerell AD, Bashford D, Bellott M, Dunbrack RL, Evanseck JD, Field MJ, Fischer S, Gao J, Guo H, Ha S, Joseph-McCarthy D, Kuchnir L, Kuczera K, Lau FTK, Mattos C, Michnick S, Ngo T, Nguyen DT, Prodhom B, Reiher WE, Roux B, Schlenkrich M, Smith JC, Stote R, Straub J, Watanabe M, Wiorkiewicz-Kuczera J, Yin D, Karplus M. All-atom empirical potential for molecular modeling and dynamics studies of proteins. J Phys Chem B. 1998;102:3586–3616. doi: 10.1021/jp973084f. [DOI] [PubMed] [Google Scholar]
- 75.Sakharov DV, Lim C. Zn protein simulations including charge transfer and local polarization effects. J Am Chem Soc. 2005;127:4921–4929. doi: 10.1021/ja0429115. [DOI] [PubMed] [Google Scholar]
- 76.Ryckaert JP, Ciccotti G, Berendsen HJC. Numerical-integration of cartesian equations of motion of a system with constraints - molecular-dynamics of n-alkanes. J Comput Phys. 1977;23:327–341. [Google Scholar]
- 77.Simmerling C, Elber R, Zhang J. MOIL-View - a program for visualization of structure and dynamics of biomolecules and STO - a program for computing stochastic paths. Jerus Sym Q: Modelling of Biomolecular Structures and Mechanisms. 1995;27:241–265. [Google Scholar]
- 78.Morgan BR, Massi F. A computational study of RNA binding and specificity in the tandem zinc finger domain of TIS11d. Protein Sci. 2010;19:1222–34. doi: 10.1002/pro.401. [DOI] [PMC free article] [PubMed] [Google Scholar]
- 79.Vriend G. WHAT IF - a molecular modeling and drug design program. J Mol Graphics. 1990;8:52–56. doi: 10.1016/0263-7855(90)80070-v. [DOI] [PubMed] [Google Scholar]
Associated Data
This section collects any data citations, data availability statements, or supplementary materials included in this article.