Abstract
Brushite (dicalcium phosphate dihydrate, DCPD) cement, owing to its high solubility in physiological condition and ability to guide new bone formation, is widely used to treat bone defects. In the present study, we have evaluated the effects of poly ethylene glycol (PEG) addition on the setting time, compressive strength and in vitro biocompatibility of brushite cement. The brushite cements were prepared by mixing β-tricalcium phosphate [β-TCP, Ca3(PO4)2] and monocalcium phosphate monohydrate [MCPM, Ca(H2PO4)2. H2O]. PEG was introduced at 2.0 and 5.0 wt% with the liquid. Introduction of PEG resulted in marginal increase in both initial and final setting time; however, significantly affected the compressive strength. Effects of PEG incorporation on in vitro biocompatibility of brushite cements were studied by using human fetal osteoblast cells (hFOB) cells. Field emission scanning electron microscope (FESEM) images and immunohistochemical analysis indicated that pure and PEG incorporated brushite cement facilitates cell adhesion, proliferation and differentiation. Fewer cells expressed vinculin protein with increased PEG content in the cement. Cell proliferation was found to decrease with increased PEG concentration while the cell differentiation increased with PEG content. Our results provide a better understanding of in vitro biocompatibility of PEG added brushite cements that can be used to customize the cement compositions based on application need.
Keywords: Brushite cement, PEG, Setting time, Cell adhesion, ALP activity
1. Introduction
Calcium phosphate cements (CPCs) are widely used for treating cancellous bone defects, vertebral body fracture, craniomaxillofacial surgery, stabilizing hip implants, ligament anchor, reinforcement of ostesynthesis screws and as biosensor, and drug delivery [1][2]. These cements are also used in reinforcing osteoporotic bone [3]. The wide acceptance of CPCs as bone graft material is due to their chemical similarity to bone, injectability and self-setting at the defect site, low setting temperature, and easy deformability to complex geometry [4,5]. Several in vivo studies have indicated that CPCs can have extensive resorption within first few months of surgery that lead to new bone formation [1,6].
Over the years many different forms and compositions of CPCs have been formulated and commercialized [2,7]. However, based on the final product of the formulation reactions, CPCs are classified in two broad categories; a) apatite cement and b) brushite cement. Apatite cements are formulated from either tetracalcium phosphate (TTCP, Ca4(PO4)2O) or α-tricalcium phosphate (α-TCP, Ca3(PO4)2) and is the most widely studied CPC [3][8]. The primary reasons for widespread acceptance of apatite cements are; i) end product is apatite which is the natural mineral phase found in bone, ii) setting reactions does not increase the local pH at application, and iii) favorable mechanical properties [1,3]. However, apatite cements have limited solubility which leads to a growing interest in highly soluble brushite cements [1]. Brushite is generally prepared by reacting β-TCP and MCPM and is a metastable phase in physiological condition [3]. Another approach for preparing brushite cement is mixing β-TCP with phosphoric acid [9]. Although, local decrease in pH while setting is one of the limitations of the brushite cement, several in vivo studies have indicated that brushite cement has higher solubility than apatite cement leading to rapid new bone formation. However, brushite cements have relatively shorter setting time (≥ 10s) which makes it difficult to be used by surgeons [3]. Setting time modifiers, such as sodium hydrogen phosphate is often used with the liquid medium to increase the setting time to a workable range [7].
Biocompatibility of brushite cements have been proven by extensive in vitro and in vivo studies [1,10]. Aplet et al. have reported that 90% of the brushite cement can be resorbed in vivo (mainly by macrophages) within 6 months and replaced by new bone [1]. However, several attempts have been made to control the setting time, mechanical properties, degradation rate, cellular activity of brushite cements [4,11,12]. Pina et al. have reported that zinc (Zn) and strontium (Sr) co substitution in brushite cement can reduce the setting time while improving the compressive strength and pre-osteoblast proliferation and maturation [4,11]. Magnesium (Mg) substituted brushite cement showed not only improvement in mechanical properties but also increased setting time, osteoblast cell proliferation and differentiation [12]. Along with controlling the setting time, mechanical and biological properties of cements, different additives have been used to control the injectability of brushite cement. It has been reported that addition of glycerin [13], gelatin [14], derivatives of cellulose, PEG [8,11] can significantly alter the rheological properties along with mechanical properties of the cements. Among this group of materials, PEG is an attractive choice as it is widely used in biomedical field due to water solubility, flexibility in preparation and anticoagulative property [8,11]. Addition of PEG found to have a negative effect on osteoblast adhesion and proliferation, however significantly enhances osteoblast differentiation [15,16].
In view of the beneficial properties of PEG, the physical-mechanical-biological properties of brushite cement doped with different metal ion along with PEG has been studied [4] [8]. However, the role of PEG on the cement properties was rarely studied. Considering the role of PEG on cell-material interactions, it is important to distinguish the effects of metal ion dopants and PEG separately when they are intended to use together. Therefore, the objectives of the present study are to understand the role of PEG incorporation in brushite cement on the physical, mechanical and in vitro biocompatibility. Setting time and compressive strength of the brushite cement was determined as a function of PEG content. In vitro biocompatibility was studied using human fetal osteoblast (hFOB) cells. Phenotypic expression of the hFOB cells was also determined by vinculin adhesive protein and alkaline phosphatase (ALP) activity.
2. Materials and methods
2.1. Cement preparation
The brushite cement was prepared by mixing β-TCP and MCPM (Sigma Aldrich, USA) [8]. The cement formation reaction can be represented as below [3]:
Ca3(PO4)2 + Ca(H2PO4)2 . H2O + 7H2O → 4CaHPO4 . 2H2O
β-TCP powder was prepared in the laboratory by reacting dicalcium phosphate anhydrous (DCPA) and calcium carbonate in a weight ratio of 2.71 [17]. All the chemicals were purchased from Sigma-Aldrich and were reagent grade. The reactants were ball milled for 30 min and calcined at 1050° C for 24 h. The powder was confirmed to be β-TCP as characterized by XRD. The calcined product was then ball milled for 4 h in anhydrous ethanol with zirconia milling media. The ball milled β-TCP was named as fine fraction where the particle size was determined by dynamic light scattering. The just calcined β-TCP powder was designated as coarse fraction. The cement precursor consists of 42 wt% β-TCP powder, 21 wt% MCPM, 31 wt% β-TCPgranules, 5 wt% magnesium hydrogen phosphate trihydrate [1,18]. Small amounts of sodium hydrogen phosphate and magnesium sulphate was also used to modify the setting time [18].
The cement paste was prepared by mixing the powder and deionized water at powder to liquid ratio (P/L) of 3.33:1. The P/L ratio was selected based on workable consistency after a series of optimization study. PEG was added to the water at 0, 0.5, 1.0, 2.0, and 5.0 wt% of the liquid amount. The appropriate amount of powder and liquid was mixed and kneaded on a glass plate using a spatula for 30 s to form the cement paste. From now on brushite cement, 2.0 wt% and 5.0 wt% PEG added brushite cements will be denoted as BrC, BrC-2PEG, and BrC-5PEG.
2.2. Setting time
Initial and final setting time of the cements was measured by Gillmore needle (ASTM C266). The cement paste was poured in a split steel mold of 6 mm diameter and 12 mm height. In this method, a needle of 2.12 mm diameter and 113.4g was placed on the cement sample. Initial set time was recorded when the needle could not leave an impression on the surface of the cement paste. Similarly a needle of 1.06 mm diameter and 453.6g was used to determine the final setting time. The set time value was an average of 5 measurements. The results are presented as mean ± standard deviation.
2.3. Mechanical property
Samples for compressive strength were prepared by mixing cement powder with appropriate amount of liquid on a glass plate. Immediately after mixing the paste is poured in a split steel mold of 6 mm diameter and 12 mm height and covered with a glass slide and kept at 37 °C for 1h at 100% relative humidity. After an hour, samples were removed from the mold and kept in phosphate buffered saline (PBS) at 37 °C for 1, 3 and 7 days [8]. Samples were dried overnight at room temperature before subjected to uniaxial loading. The compressive strengths of the cement samples were determined using a screw-driven universal testing machine (AGIS, Shimadzu, Japan) with a constant cross-head speed of 0.33 mm min−1. Compressive strength was calculated using maximum load recorded and sample dimensions, where three samples of each composition were used.
2.4. Phase and microstructural analysis
Phases present in the cement was characterized by Siemens D500 Krystalloflex X-ray diffractometer using Cu Kα radiation at 35 kV and 30 mA at room temperature equipped with a Ni-filter over the 2θ range between 10° and 40°, at a step size of 0.02° and a count time of 0.5 sec per step. The quantitative phase analysis was performed using relative intensity ration (RIR) method [19]. As described in section 2.3, cylindrical cement samples were prepared and kept in PBS at 37 °C for 1, 3 and 7 days. After the specific time points, cylindrical samples were crushed to powder for XRD analysis. The fractured samples from the compressive strength experiments were collected and imaged using FESEM (FEI 200F, FEI, OR) for microstructural study.
2.5. In vitro biocompatibility
In vitro biocompatibility of pure, 2 wt% PEG and 5 wt% PEG incorporated cements were determined by culturing hFOB cells. For cell culture, 6 mm diameters × 2 mm height cylindrical samples were prepared. All samples were sterilized by submerging in 70% ethanol for 30 min followed by 30 min exposure to ultraviolet (UV) light. In this study established human osteoblast cell line hFOB 1.19 (ATCC, Manassas, VA) was used. Cells were seeded onto the samples placed in 24-well plates. The base medium for this cell line was a 1:1 mixture of Ham's F12 Medium and Dulbecco's Modified Eagle's Medium (DMEM/F12, Sigma, St. Louis, MO), with 2.5 mM L-glutamine (without phenol red). The medium was supplemented with 10% fetal bovine serum (HyClone, Logan, UT) and 0.3 mg/ml G418 (Sigma, St. Louis, MO). Cultures were maintained at 34 °C under an atmosphere of 5% CO2 as recommended by ATCC for this particular cell line. Medium was changed every 2 days for the duration of the experiment [20].
2.4.1 MTT assay
MTT (3-(4,5-dimethylthiazol-2-yl)-2,5-diphenyl tetrazolium bromide) assay was used to evaluate cell proliferation. The MTT (Sigma, St. Louis, MO) solution of 5 mg/ml was prepared by dissolving MTT in sterile filtered PBS. 10% MTT solution was then added to each sample in 24-well plates. After 2 h of incubation, 500 µl of solubilization solution made up of 10% Triton X-100, 0.1N HCl and isopropanol was added to dissolve the formazan crystals. 100 µl of the resulting supernatant was transferred into a 96-well plate, and read by a plate reader at 570 nm. Statistical analysis was performed using Student’s t-test and p<0.05 was considered statistically significant. Triplicate samples were used in MTT assay experiments to insure reproducibility. Data are presented as mean ± standard deviation.
2.4.2. Cell morphology
Samples for testing were removed from culture at 3 and 7 days of incubation. All samples for SEM observation were fixed with 2% paraformaldehyde/2% glutaraldehyde in 0.1M phosphate buffer overnight at 4 °C. Post-fixation was performed with 1% osmium tetroxide (OsO4) at overnight at 4 °C. The fixed samples were then dehydrated in an ethanol series (30%, 50%, 70%, 95% and 100% three times), followed by a hexamethyldisilane (HMDS) drying procedure. After gold coating, the samples were observed under FESEM for cell morphologies.
2.4.3 Immunohistochemistry and confocal microscopy
Vinculin is a protein expressed by osteoblast cells and normally found in the focal adhesion sites. This protein is involved in adhesion of osteoblasts to the materials surface. For this reason, vinculin protein expression in the hFOB cells after 3 days of culture was determined by immunochemical analysis using confocal imaging. Similarly, alkaline phosphatase is considered as a differentiation marker for osteoblast cells. For this reason, we have evaluated the ALP expression in the hFOB cells after 5 and 11 days of culture and studied the effects of PEG content.
After specific culture days, osteoblast cells were fixed in 3.7% paraformaldehyde/ phosphate buffered solution, pH 7.4 and at room temperature for 10 min. After washing with PBS for 3 times (5 min each), the samples were permeabilized with 0.1% Triton X-100 (in PBS) for 10 min at room temperature. Samples were then washed with PBS and incubated in TBSTBSA (Tris-buffered saline with 1% bovine serum albumin, 250 mM NaCl, pH 8.3) blocking solution for 1h at room temperature. Primary antibody against alkaline phosphate (ALP) (Sigma, St. Louis, MO) or vinculin was added at a 1:100 dilution and incubated at room temperature for 2 h and kept at 4 °C overnight. Samples were then washed with TBS for 10 min @ 3 times. The secondary antibody, goat anti-mouse (GAM) Oregon green (Molecular Probes, Eugene, OR), was diluted 1:100 in TBST and was used to incubate the cells for 1h. After 2 × 5 min washing with TBST followed by 5 min washing with PBS, the samples were then mounted on glass coverslips with Vectashield mounting medium (Vector Labs, Burlingame, CA) with propidium iodide (PI) and kept at 4 °C for future CLSM imaging. The microscopical examinations were performed on a Zeiss 510 laser scanning microscope (LSM 510 META, Carl Zeiss MicroImaging, Inc., NY, USA) [21].
3. Results
3.1. Setting time and compressive strength
During our initial work, the optimum P/L ratio was found to be 3.33:1 with 1 w% sodium pyrophosphate considering workable setting time and high compressive strength. Therefore, our further studies were based on these optimized conditions. Table 1 shows the effects of PEG incorporation in the BrC cement on the setting time and compressive strength. Introduction of PEG resulted in marginal increase in both initial and final setting time. However, the compressive strength was significantly affected by PEG incorporation. Compressive strength initially decreased with 0.5 and 1.0 wt% PEG incorporation that increased with 2.0 and 5.0 wt% PEG addition. For this reason, 2.0 and 5.0 w % PEG added CPC cements were chosen for an in depth mechanical and in vitro cell-materials interactions study.
Table 1.
Properties of PEG added brushite cements as a function of PEG content. Compressive strength was measured after 1 day incubation in PBS at 37 °C.
| Sample | Composition | Initial Set Time (min) |
Final Set Time (min) |
Compressive Stength (MPa) |
|---|---|---|---|---|
| BrC | BrC+ 0.0 w % PEG | 4 | 9 | 7.32 ± 0.8 |
| BrC-0.5PEG | BrC+ 0.5 w % PEG | 4 | 9 | 5.99 ± 0.35 |
| BrC-1PEG | BrC+ 1.0 w % PEG | 4 | 9 | 6.07 ± 0.01 |
| BrC-2PEG | BrC+ 2.0 w % PEG | 5 | 11 | 10.25 ± 0.70 |
| BrC-5PEG | BrC+ 5.0 w % PEG | 5 | 12 | 8.63 ± 0.50 |
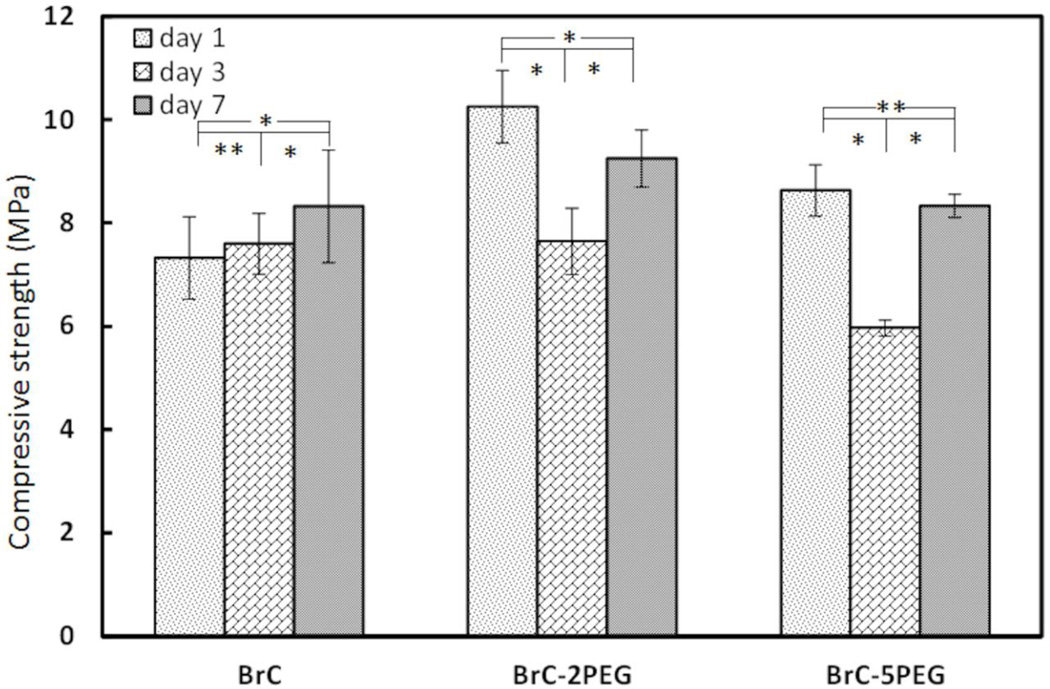
Figure 1 shows the compressive strength of BrC, BrC-2PEG, and BrC-5PEG samples after soaking in PBS for 1, 3 and 7 days at 37 °C. Initial compressive strength of the cement samples varied between 7–11 MPa which is in good agreement for the brushite cements [8,13]. Although, high initial compressive strength was noticed for PEG incorporated BrC-2PEG, and BrC-5PEG samples, the strength dropped significantly after 3 days of immersion in PBS for these samples. No significant difference in strength was observed for BrC cement samples. Interestingly, the compressive strength of all of the samples after soaking for 7 days in PBS although was not statistically significant for BrC cement.
Figure 1.
Compressive strength of cement samples after incubation in PBS for day 1, 3 and 7. (*p < 0.05 and ** p>0.05, n = 3)
3.2. Phase analysis
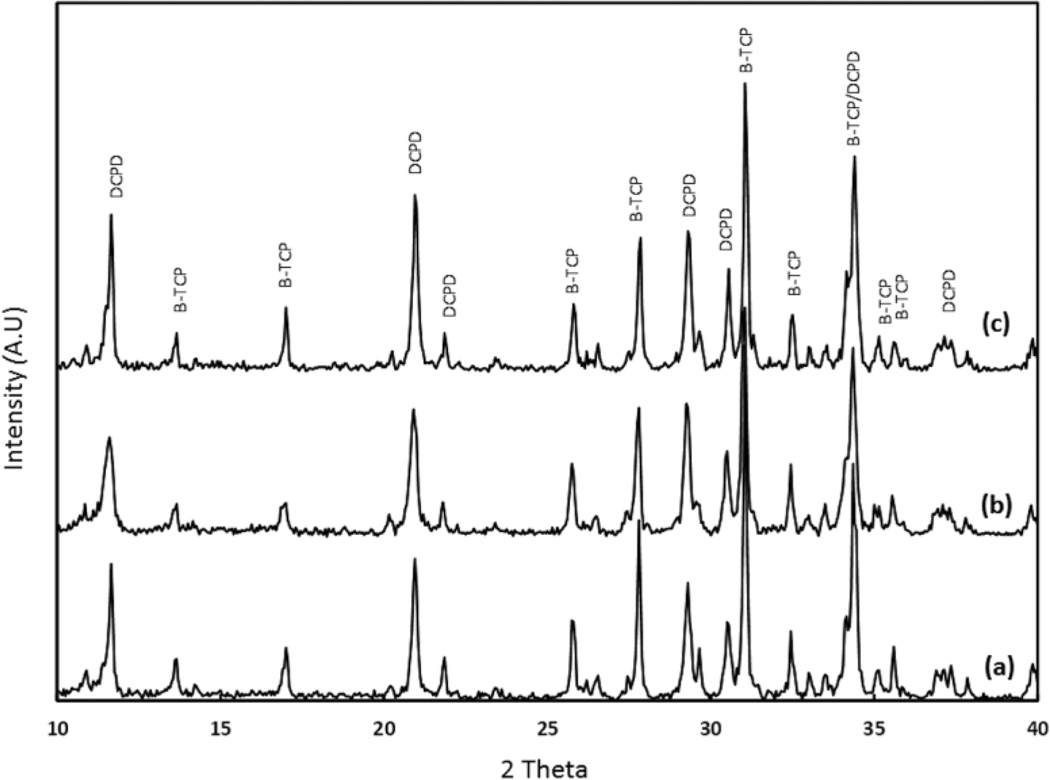
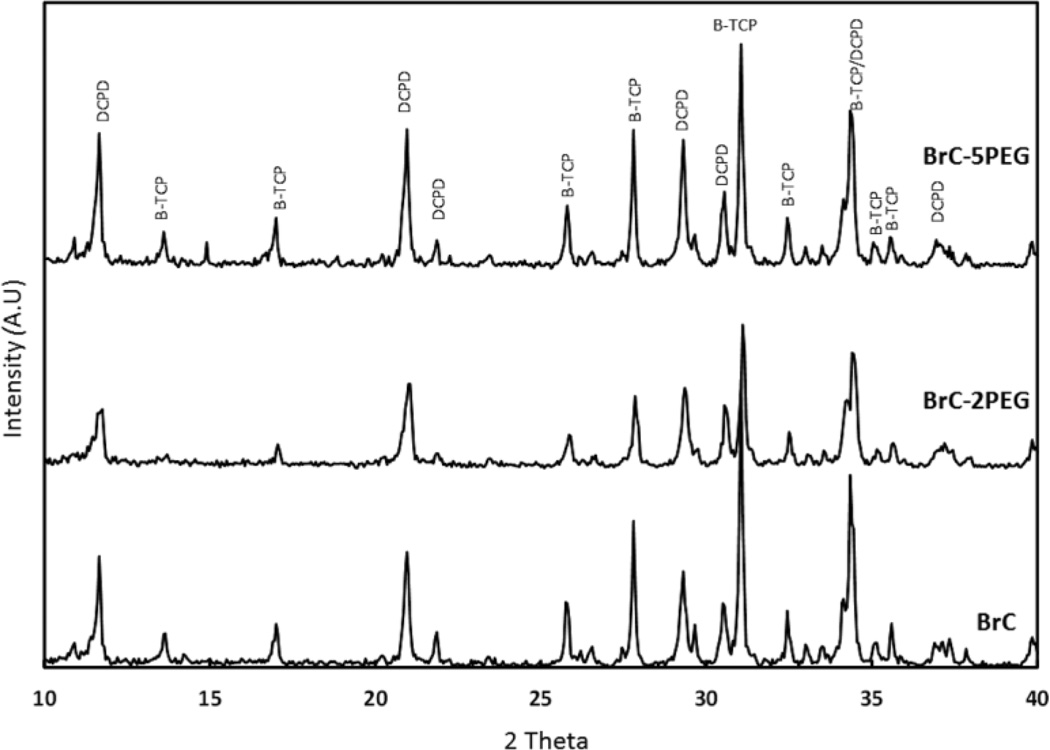
Figure 2 shows the X-ray diffraction patterns of BrC, BrC-2PEG, and BrC-5PEG samples after 1 day incubation in PBS. The significant peaks were identified as β-TCP (JCPDS # 09-0169) and DCPD (JCPDS # 09-0077). The cement formed by reacting β-TCP and MCPM was mainly composed of large amount of β-TCP and DCPD. No other impurity phases were found in the cement samples. Addition of PEG did not alter the phase formation. The phase change as a function of aging time for BrC cement is shown in Figure 3. Table 2 shows the change in phase composition of brushite cement as a function of PEG and soaking time. The highest initial brushite phase was noticed for BrC-2PEG which decreased after 3 day of soaking and increased at day 7. Similar pattern was also noticed for BrC-5PEG.
Figure 2.
XRD results BrC cement incubated in PBS for (a) 1 day, (b) 3 day and (c) 7 day.
Figure 3.
XRD results for different cement samples incubated in PBS for day 1.
Table 2.
Quatitative phase analysis of brushite cement as a function of PEG content and incubation time in PBS.
| Day 1 | Day 3 | Day 7 | ||||
|---|---|---|---|---|---|---|
| Brushite | β-TCP | Brushite | β-TCP | Brushite | β-TCP | |
| BrC | 27 | 73 | 27 | 73 | 37 | 63 |
| BrC-2PEG | 45 | 55 | 33 | 67 | 38 | 62 |
| BrC-5PEG | 33 | 67 | 27 | 73 | 37 | 63 |
3.3. Microstructural analysis
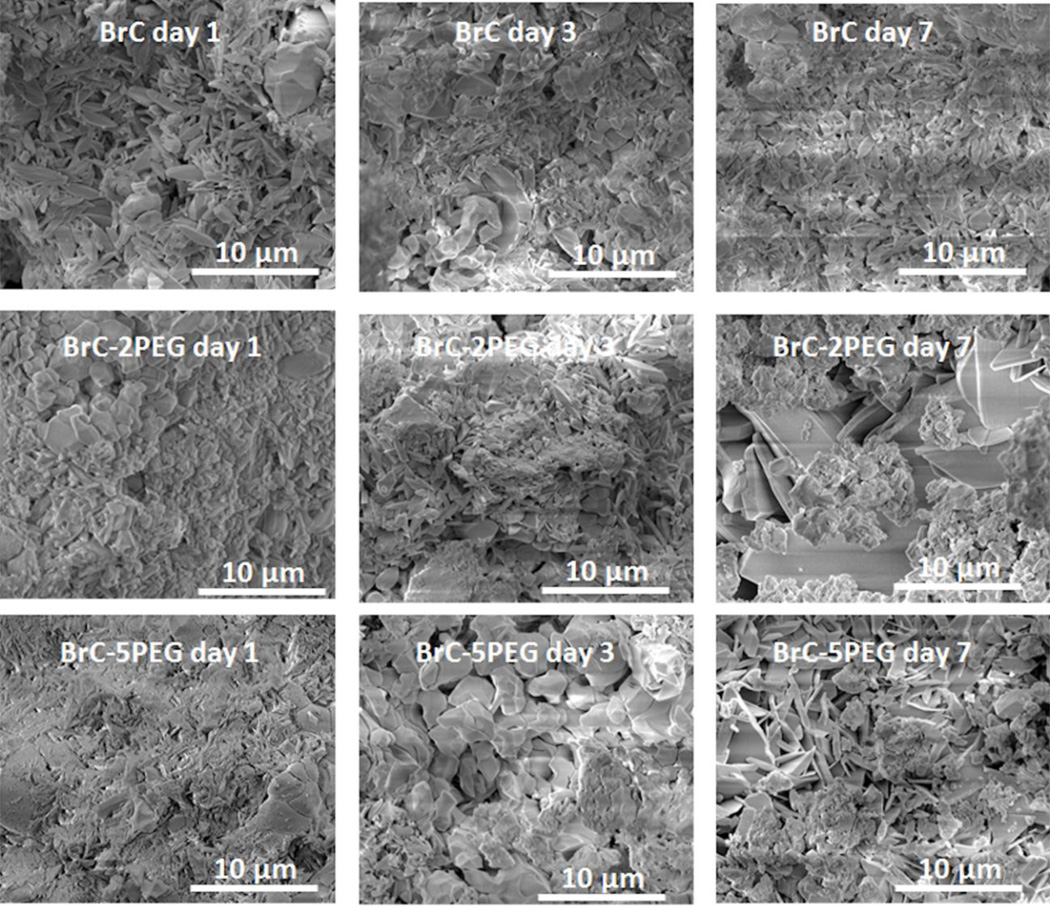
FESEM micrographs of the fracture surfaces of the cement samples are shown in Figure 4 as a function of aging time and composition. BrC samples after day 1 incubation showed unreacted β-TCP granules in the matrix of needle like DCPD crystals. Needle like DCPD crystals were noticed on the granules of β-TCP in BrC-5PEG after 1 day incubation in PBS. With increase in incubation time, needle shaped DCPD crystal increased in the BrC samples. At day 7, a compact structure of DCPD was noticed with fewer β-TCP granules than that was found at day 1. In comparison to BrC, needle shaped DCPD crystals were found in abundance in BrC- 2PEG and BrC-5PEG after incubating the samples in PBS for 1 day. At day 3, fewer DCPD crystals were noticed in BrC-2PEG compared to day 1, which indicated dissolution of DCPD. Inter-granular dissolution of β-TCP was also noticed after 3 days of incubation in BrC-2PEG samples. After 7 days of incubation, new DCPD crystals appeared to fill the pores and resulted in a compact microstructure. Similar to BrC-2PEG samples, BrC-5PEG samples were also characterized by porous microstructure after 3 days of incubation in PBS. A markedly different coating microstructure, characterized by compact and well developed DCPD crystals, was found in BrC-5PEG cements after 7 days of incubation.
Figure 4.
FESEM micrographs of three different cement samples after incubation in PBS for day 1, 3 and 7.
3.4. In vitro biocompatibility
3.4.1. Cell proliferation
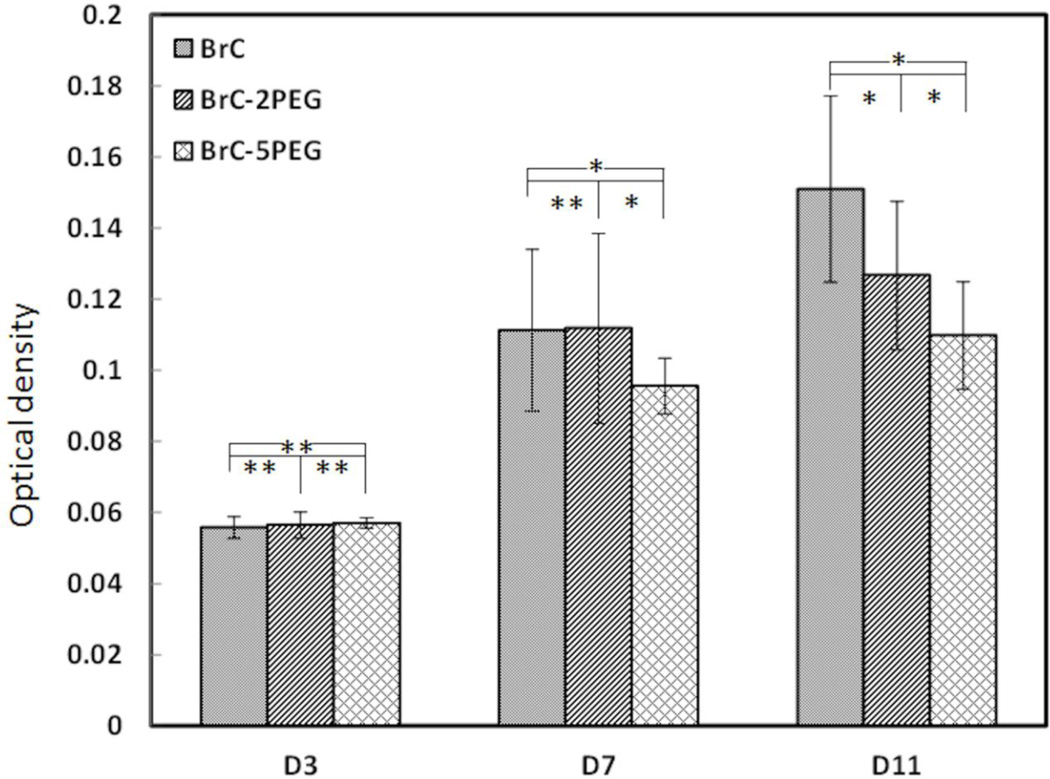
Figure 5 shows the proliferation of hFOB cells cultured on BrC, BrC-2PEG, and BrC- 5PEG at 3, 7 and 11 days. At day 3, cell density was similar in all three of the cement compositions. With increase in culture days, significant hFOB cells proliferation was noticed on all of the cement samples. Cell proliferation was more prominent on BrC and BrC-2PEG cement samples. hFOB cell density was significantly lower on BrC-5PEG at day 7 compared to BrC and BrC-2PEG cement samples, however significantly higher than day 3. By day 11, statistically significant higher cells were noticed on BrC cement samples. The cell proliferation was not significant on BrC-2PEG and BrC-5PEG samples at day 11 from day 7. Cell density on the cement samples at day 11 decreased in the following order: BrC > BrC-2PEG > BrC-5PEG.
Figure 5.
Optical density measurement illustrating hFOB cell proliferation on BrC, BrC-2PEG, and BrC-5PEG after 3, 7, and 11 days of culture. (* p < 0.05, and ** p>0.05 n = 3)
3.4.2. hFOB cellular morphology
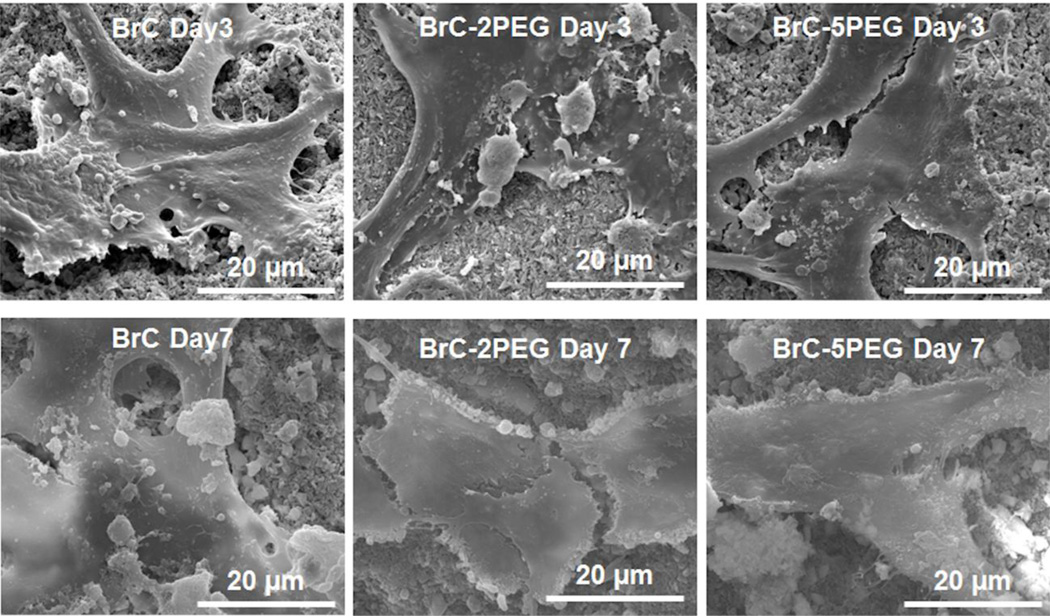
Figure 6 shows the hFOB cell morphology on BrC, BrC-2PEG, and BrC-5PEG samples after 3 and 7 days of culture. The cells were found to adhere well on all of the cement samples. At day 3, hFOB cells on all three of cement samples showed the typical osteoblast phenotype, such as flattened morphology, fillopodia extensions. There was no morphological difference in the adhered cells in any one of the cement samples. By day 7, cells spread well on BrC, BrC- 2PEG, and BrC-5PEG samples compared to day 3.
Figure 6.
FESEM micrographs illustrating the hFOB cell morphology after 3 and 7 days of culture.
3.4.3. Immunohistochemical analysis
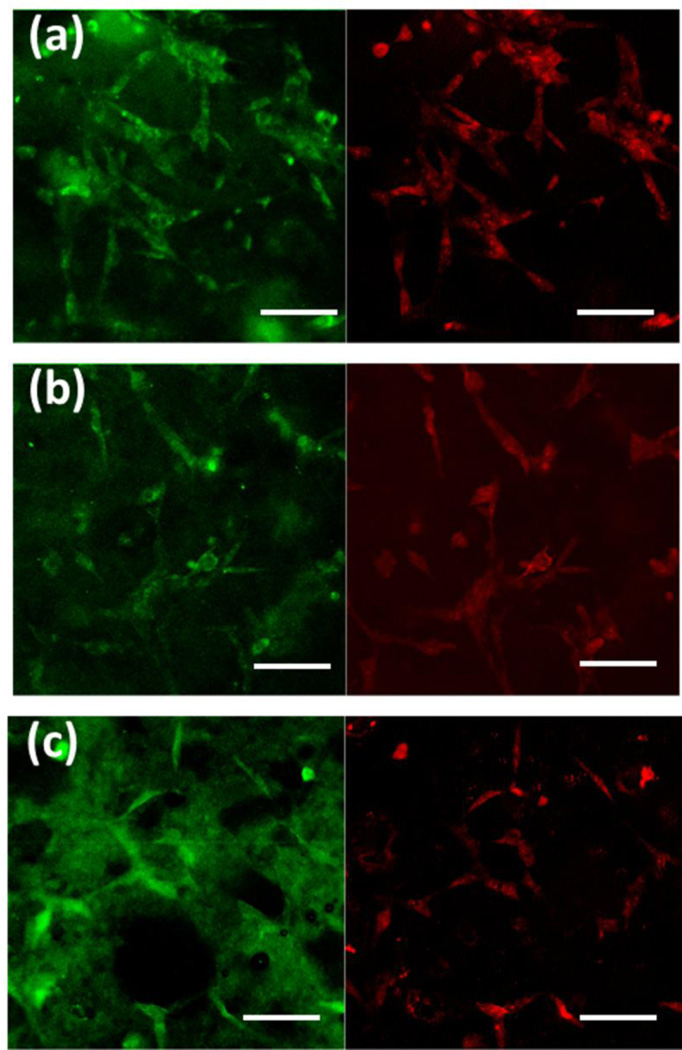
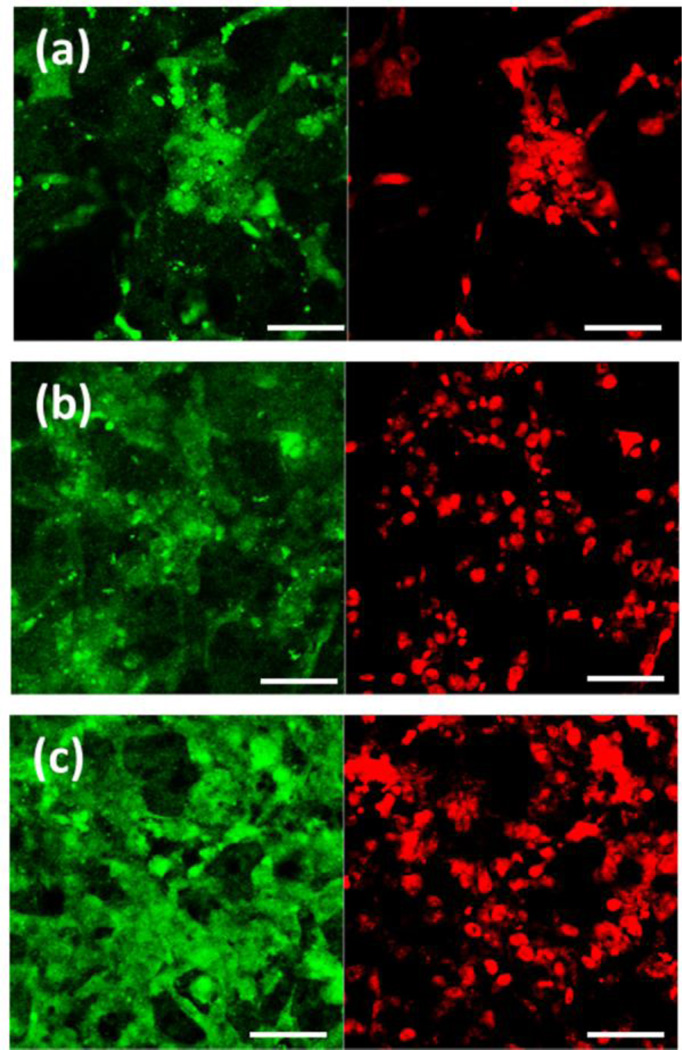
Figure 7 shows the vinculin protein expression in the cells cultured on BrC, BrC-2PEG, and BrC-5PEG samples for 3 day. Vinculin in hFOB cells was identified by the expression of the green fluorescence, and nuclei as red. Cells on all three of the sample surfaces showed positive immunostaining for vinculin. Fewer cells expressing vinculin were noticed as the content of PEG increased in the cement. One important point to notice in the immunohistochemical analysis was that the non-specific background staining was very high for all of the samples. As the cement samples were highly porous, they absorb the primary antibody solution on its surface which we could not remove even with extensive washing.
Figure 7.
Vinculin expression in hFOB cells cultured on (a) BrC (b) BrC-2PEG, and (c) BrC-5PEG at day 3. (Scale bar = 100 µm)
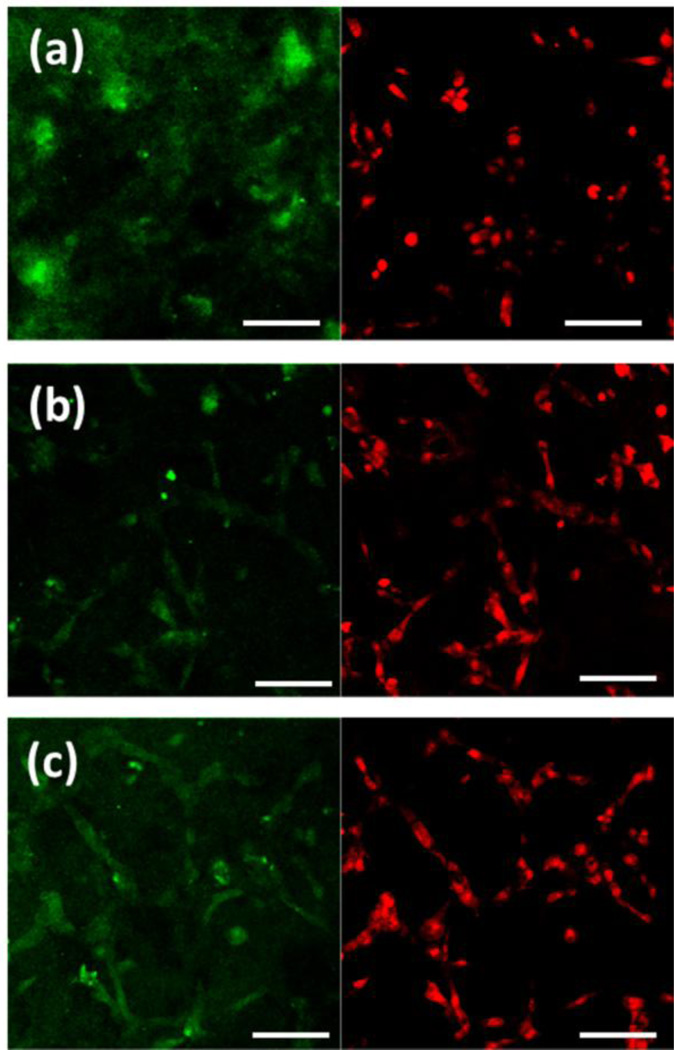
Figure 8 shows the ALP expression in the cells cultured on BrC, BrC-2PEG, and BrC- 5PEG samples for day 5. ALP in hFOB cells was identified by the expression of the green fluorescence, and nuclei as red. At day 5, large number of nucleuses was found on pure BrC cement; however, the ALP expression was scare in this sample. In comparison, cells on BrC- 2PEG showed positive immunostaining for ALP which increased even further for BrC-5PEG sample. With increase in culture days, hFOB cells showed higher ALP activity. ALP expression in the hFOB cells after 11 days of culture is shown in Figure 9. Compared to day 5, BrC cement started to show ALP activity at day 11. Relatively higher ALP activity was noticed on BrC- 5PEG cement samples compared to BrC cement. Very strong green signal of ALP expression was found on BrC-5PEG cement samples after 11 days of culture, as shown in Figure 9c.
Figure 8.
ALP expression in hFOB cells cultured on ((a) BrC (b) BrC-2PEG, and (c) BrC-5PEG at day 5. (Scale bar = 100 µm)
Figure 9.
ALP expression in hFOB cells cultured on (a) BrC (b) BrC-2PEG, and (c) BrC-5PEG at day 11.(Scale bar = 100 µm)
4. Discussion
Brushite cements are well known for its bioactivity which is proven by in vitro and in vivo studies [1,4,6,12]. There have been efforts to improve its bioactivity further by metal ion doping. Most of these metal ions doped cements used PEG as an additive. However, the role of PEG itself on the bioactivity of cements was not studied in details. Here we report a better understanding of in vitro biocompatibility of brushite cements when we use PEG as an additive.
Our initial optimization work lead to a P/L ratio of 3.33 which give a good workable cement consistency and set times which are also in line with published literature [8]. Addition of PEG slightly delayed the cement formation, possibly due to delayed nucleation and formation of DCPD crystals. As reported by Pina et al., PEG acts as a gelling agent and retards the formation of brushite phase however increases the strength [22]. Likewise, our results also indicate that PEG incorporation increases the compressive strength.
The setting reactions of this specific brushite cement results in β-TCP granules in the matrix of DCPD crystals and fine particles of β-TCP [1]. It has been reported that the presence of β-TCP granules promotes mature bone formation [1]. Moreover, the unreacted β-TCP has a profound effect on the mechanical properties of the cement. Formation of the DCPD phase contributes to the strength of cement. Therefore, the amount of β-TCP transformed to DCPD plays an important role in determining the compressive strength of brushite cement. The high initial compressive strength of BrC-2PEG can be attributed to the highest DCPD phase formation compared to BrC and Brc-5PEG. In their initial work, Mirtchi et al. have indicated that DCPD phase increases in cement mixture with longer aging time [23]. Similar finding has also been reported by Grover et al. where the brushite phase increases from 16 wt % to 38 wt% after aging in PBS for 28 days [10]. However, there is another phenomenon happen when brushite cements are aged in PBS. Owing to their high solubility, DCPD phase dissolves in the liquid medium increasing the porosity and reducing the compressive strength of the cement. In our work, the increase in compressive strength of the BrC samples with aging time is primarily due to transformation of β-TCP to DCPD which also compensates for DCPD dissolution. From the BrC cement microstructure we can also see that higher aging time makes the structure compact with higher amount of DCPD crystals. PEG addition plays a significant role in phase transformation of β-TCP to DCPD. In the day 3 microstructure, we see higher porosity in BrC-2PEG and BrC- 5PEG samples indicating that the dissolution of DCPD is predominant over β-TCP to DCPD transformation. The results are also supported by quantitative phase analysis which indicates lower amount of DCPD phase after 3 days of incubation in PBS for BrC-2PEG and BrC-5PEG. Addition of PEG most likely reduces the interaction of β-TCP and liquid medium and restricts the phase transformations. Increase in porosity significantly reduces the compressive strength of BrC-2PEG and BrC-5PEG samples at day 3. It is also noteworthy to say that higher the PEG content is, higher is the drop in compressive strength. At day 7, we see more DCPD crystal formation in PEG added cement samples and consequently increase in compressive strength. It may be possible that PEG get dissolve by day 7 and increases the β-TCP to liquid interactions resulting in DCPD formation. Similar to day 3, we also see that relative increase in compressive strength is higher for cement samples with higher PEG content thus supporting our hypothesis that presence of PEG initially reduces the transformation of β-TCP to DCPD; however, does not affect at a later stage of cement aging. Increase in compressive strength of BrC-5PEG samples is also supported by the presence of compact and well-developed DCPD crystals after 7 days of incubation in PBS.
Along with physical and mechanical properties, success of brushite cement is also dependent on its interactions with bone cells. Brushite cement-cell materials interactions are characterized by adhesion, proliferation and differentiation at various time points. Considering in vitro cellular activity, it can be confirmed that BrC, BrC-2PEG and BrC-5PEG cements are biocompatible and allow hFOB cell proliferation and differentiation. However, dose dependent effects of PEG at all stages of cellular activity are noticed. It has been shown that presence of PEG can have a negative effect on osteoblast adhesion and proliferation, however significantly enhances osteoblast differentiation [24–26]. Cellular adhesion is largely dependent on the material’s ability to adsorb protein. Lieb et al. have shown that fibronectin, an adhesive protein, adsorption is significantly reduced when the PEG content in a diblock co-polymer of poly (D, Llactic acid)- poly (ethylene glycol)-monomethyl ether is increased [26]. Similarly, a linear decrease in fibronectin adsorption from 0.4 µg/cm2 to 0.05 µg/cm2 is reported in PEG-variant biomaterials when the PEG content increased from 0% to 10 mol% [27]. It has also been reported that presence of PEG not only reduces fibronectin adsorption but also changes the protein configuration which can control the integrin binding sites that in turn control cellular binding [26,27]. Due to reduced fibronectin absorption and its change in configuration, cellular adhesion is also reduced. Similarly, our results indicate reduced vinculin expression when PEG is incorporated in the brushite cement. Along with adhesion, cellular proliferation is also effected by the amount of PEG present in the cement. The reduction in hFOB proliferation with increase in PEG content can be related to the hydorphilicity of the cement [15,16]. Göpferich et al. have reported slower marrow stromal cell proliferation with increase in hydrophilicity of poly(D,Llactic acid)-block-poly(ethylene glycol)- monomethyl ether polymer [24]. PEG is a hydrophilic polymer and can suppress unspecific absorption of proteins leading to low cell adhesion and proliferation [24,27]. Although PEG reduces hFOB cell adhesion and proliferation, increased differentiation is noticed with higher PEG incorporated cements. PEG is known to facilitate marrow stromal cell differentiation osteoblastic phenotypes in poly (D, L-lactic acid)- poly (ethylene glycol)-monomethyl ether system [24,26]. Studies have indicated that PEG variant biomaterials enhances osteocalcin and ALP expression indicating positive effects on cell differentiation [28–30]. Increased ALP expression on day 5 and day 11 in BrC-5PEG samples compared to BrC samples indicate that the PEG can induce significantly higher osteoblast differentiation.
5. Conclusions
In the present study, we have evaluated the effects of PEG addition on the setting time, mechanical and in vitro biological properties of brushite cement. Incorporation of PEG initially decreased the compressive strength at day 3 for BrC-5PEG and BrC-2PEG samples; however, increased it after 7 days of incubation. Significant effects of PEG addition was noticed in the hFOB cell-cement interactions. hFOB cell proliferation decreased with an increase in PEG content in the cement. Although, PEG decreased cell proliferation, an enhanced ALP activity was noticed with PEG added brushite cements. Overall PEG incorporation plays an important role at every stage of brushite cement biocompatibility.
Highlights.
Setting time was not altered for brushite cement with PEG addition.
hFOB cell proliferation was found to decrease with increased PEG concentration in brushite cement.
Enhanced ALP activity was noticed with addition of PEG in brushite cements.
Acknowledgements
Authors acknowledge financial support from the National Institute of Health (N1H-RO1-EB- 007351), Office of Naval Research and the W. M. Keck Foundation to establish a Biomedical Materials Research Laboratory at WSU. Authors thank Franceschi Microscopy and Imaging Center, Washington State University for helpful assistance in the immunohistochemical and FESEM analyses.
Footnotes
Publisher's Disclaimer: This is a PDF file of an unedited manuscript that has been accepted for publication. As a service to our customers we are providing this early version of the manuscript. The manuscript will undergo copyediting, typesetting, and review of the resulting proof before it is published in its final citable form. Please note that during the production process errors may be discovered which could affect the content, and all legal disclaimers that apply to the journal pertain.
References
- 1.Apelt D, Theiss F, El-Warrak AO, Zlinszky K, Bettschart-Wolfisberger R, Bohner M, Matter S, Auer JA, von Rechenberg B. Biomaterials. 2004;25:1439. doi: 10.1016/j.biomaterials.2003.08.073. [DOI] [PubMed] [Google Scholar]
- 2.Tamimi F, Sheikh Z, Barralet J. Acta Biomaterialia. 2012;8:474. doi: 10.1016/j.actbio.2011.08.005. [DOI] [PubMed] [Google Scholar]
- 3.Bohner M. Journal of Materials Chemistry. 2007;17:3980. [Google Scholar]
- 4.Pina S, Vieira SI, Rego P, Torres PMC, da Cruz e Silva OAB, da Cruz e Silva EF, Ferreira JMF. Eur Cell Mater. 2010;20:162. doi: 10.22203/ecm.v020a14. [DOI] [PubMed] [Google Scholar]
- 5.Ginebra MP, Traykova T, Planell JA. Journal of Controlled Release. 2006;113:102. doi: 10.1016/j.jconrel.2006.04.007. [DOI] [PubMed] [Google Scholar]
- 6.Ohura K, Bohner M, Hardouin P, Lemaître J, Pasquier G, Flautre B. J. Biomed. Mater. Res. 1996;30:193. doi: 10.1002/(SICI)1097-4636(199602)30:2<193::AID-JBM9>3.0.CO;2-M. [DOI] [PubMed] [Google Scholar]
- 7.Bohner M, Gbureck U, Barralet JE. Biomaterials. 2005;26:6423. doi: 10.1016/j.biomaterials.2005.03.049. [DOI] [PubMed] [Google Scholar]
- 8.Han B, Ma P-W, Zhang L-L, Yin Y-J, Yao K-D, Zhang F-J, Zhang Y-D, Li X-L, Nie W. Acta Biomaterialia. 2009;5:3165. doi: 10.1016/j.actbio.2009.04.024. [DOI] [PubMed] [Google Scholar]
- 9.Grover LM, Knowles JC, Fleming GJP, Barralet JE. Biomaterials. 2003;24:4133. doi: 10.1016/s0142-9612(03)00293-x. [DOI] [PubMed] [Google Scholar]
- 10.Grover LM, Gbureck U, Wright AJ, Tremayne M, Barralet JE. Biomaterials. 2006;27:2178. doi: 10.1016/j.biomaterials.2005.11.012. [DOI] [PubMed] [Google Scholar]
- 11.Pina S, Vieira SI, Torres PMC, Goetz-Neunhoeffer F, Neubauer J, da Cruz e Silva O a B, da Cruz e Silva EF, Ferreira JMF. Journal of Biomedical Materials Research Part B: Applied Biomaterials. 2010;94B:414. doi: 10.1002/jbm.b.31669. [DOI] [PubMed] [Google Scholar]
- 12.Klammert U, Reuther T, Blank M, Reske I, Barralet JE, Grover LM, Kübler AC, Gbureck U. Acta Biomaterialia. 2010;6:1529. doi: 10.1016/j.actbio.2009.10.021. [DOI] [PubMed] [Google Scholar]
- 13.Takagi S, Chow LC, Hirayama S, Sugawara A. Journal of Biomedical Materials Research Part B: Applied Biomaterials. 2003;67B:689. doi: 10.1002/jbm.b.10065. [DOI] [PubMed] [Google Scholar]
- 14.Bigi A, Bracci B, Panzavolta S. Biomaterials. 2004;25:2893. doi: 10.1016/j.biomaterials.2003.09.059. [DOI] [PubMed] [Google Scholar]
- 15.Briggs T, Treiser MD, Holmes PF, Kohn J, Moghe PV, Arinzeh TL. Journal of Biomedical Materials Research Part A. 2009;91A:975. doi: 10.1002/jbm.a.32310. [DOI] [PMC free article] [PubMed] [Google Scholar]
- 16.Sung H-J, Luk A, Murthy NS, Liu E, Jois M, Joy A, Bushman J, Moghe PV, Kohn J. Soft Matter. 2010;6:5196. [Google Scholar]
- 17.Gbureck U, Grolms O, Barralet JE, Grover LM, Thull R. Biomaterials. 2003;24:4123. doi: 10.1016/s0142-9612(03)00283-7. [DOI] [PubMed] [Google Scholar]
- 18.Bohner M, Lemaitre J, Ring TA. Journal of the American Ceramic Society. 1996;79:1427. [Google Scholar]
- 19.Prevéy P. Journal of Thermal Spray Technology. 2000;9:369. [Google Scholar]
- 20.Roy M, Bandyopadhyay A, Bose S. Journal of the American Ceramic Society. 2010;93:3720. [Google Scholar]
- 21.Roy M, Bandyopadhyay A, Bose S. Journal of Biomedical Materials Research Part B: Applied Biomaterials. 2011;99B:258. doi: 10.1002/jbm.b.31893. [DOI] [PubMed] [Google Scholar]
- 22.Badami AS, Kreke MR, Thompson MS, Riffle JS, Goldstein AS. Biomaterials. 2006;27:596. doi: 10.1016/j.biomaterials.2005.05.084. [DOI] [PubMed] [Google Scholar]
- 23.Mirtchi AA, Lemaitre J, Terao N. Biomaterials. 1989;10:475. doi: 10.1016/0142-9612(89)90089-6. [DOI] [PubMed] [Google Scholar]
- 24.Göpferich A, Peter SJ, Lucke A, Lu L, Mikos AG. Journal of Biomedical Materials Research. 1999;46:390. doi: 10.1002/(sici)1097-4636(19990905)46:3<390::aid-jbm12>3.0.co;2-n. [DOI] [PubMed] [Google Scholar]
- 25.Tziampazis E, Kohn J, Moghe PV. Biomaterials. 2000;21:511. doi: 10.1016/s0142-9612(99)00212-4. [DOI] [PubMed] [Google Scholar]
- 26.Lieb E, Tessmar J, Hacker M, Fischbach C, Rose D, Blunk T, Mikos AG, Göpferich A, Schulz MB. Tissue Eng. 2003;9:71. doi: 10.1089/107632703762687555. [DOI] [PubMed] [Google Scholar]
- 27.Gref R, Minamitake Y, Peracchia MT, Trubetskoy V, Torchilin V, Langer R. Science. 1994;263:1600. doi: 10.1126/science.8128245. [DOI] [PubMed] [Google Scholar]
- 28.Tosatti S, Schwartz Z, Campbell C, Cochran DL, VandeVondele S, Hubbell JA, Denzer A, Simpson J, Wieland M, Lohmann CH, Textor M, Boyan BD. Journal of Biomedical Materials Research Part A. 2004;68A:458. doi: 10.1002/jbm.a.20082. [DOI] [PubMed] [Google Scholar]
- 29.Islam MQ, da S. Meirelles L, Nardi NB, Magnusson P, Islam K. Stem Cells and Development. 2006;15:905. doi: 10.1089/scd.2006.15.905. [DOI] [PubMed] [Google Scholar]
- 30.Benoit DSW, Durney AR, Anseth KS. Biomaterials. 2007;28:66. doi: 10.1016/j.biomaterials.2006.08.033. [DOI] [PubMed] [Google Scholar]


