

Abstract
In the “flash-beep illusion,” a single light flash is perceived as multiple flashes when presented in close temporal proximity to multiple auditory beeps. Accounts of this illusion argue that temporal auditory information interferes with visual information because temporal acuity is better in audition than vision. However, it may also be that whenever there are multiple sensory inputs, the interference caused by a to-be-ignored stimulus on an attended stimulus depends on the likelihood that the stimuli are perceived as coming from a single distal source. Here we explore, in human observers, perceptual interactions between competing auditory and visual inputs while varying spatial proximity, which affects object formation. When two spatially separated streams are presented in the same (visual or auditory) modality, temporal judgments about a target stream from one direction are biased by the content of the competing distractor stream. Cross-modally, auditory streams from both target and distractor directions bias the perceived number of events in a target visual stream; however, importantly, the auditory stream from the target direction influences visual judgments more than does the auditory stream from the opposite hemifield. As in the original flash-beep illusion, visual streams weakly influence auditory judgments, regardless of spatial proximity. We also find that perceptual interference in the flash-beep illusion is similar to within-modality interference from a competing same-modality stream. Results reveal imperfect and obligatory within- and across-modality integration of information, and hint that the strength of these interactions depends on object binding.
Introduction
Our brains effortlessly integrate noisy, imperfect information to allow us to analyze objects and events, even though natural sensory stimuli are often confusing mixtures of inputs from different sources in the environment. To make sense of such mixtures, our brains group together appropriate stimulus elements, such as sound components that are harmonically related or onsets of sound and light that occur in close temporal or spatial proximity, to generate percepts of recognizable, localizable, external objects (Marr, 1982; Bregman, 1990; Shinn-Cunningham, 2008).
The process of object formation has been the focus of much research; however, most studies consider inputs from only a single sensory modality (Driver et al., 2001; Best et al., 2007). Of course, in real life, most objects are multimodal. For instance, the image of a gray-haired man articulating words and the correlated sound of a gravelly voice work together to form a percept of an elderly talker. Although few studies address cross-modal object formation, many have examined the question of how inputs in one sensory modality bias perception of inputs in another modality, creating sensory “illusions” (Gebhard and Mowbray, 1959; McGurk and MacDonald, 1976; Bertelson and Radeau, 1981). In such studies, a distractor input in one modality typically alters the perception of an otherwise easily discriminable input from another modality, even when observers are explicitly told to ignore the distractor. Such illusory percepts are frequently asymmetrical with one modality dominating, with the observed asymmetries often predicted by Bayesian analysis: competing cues are perceptually weighted according to the quality of the information they convey (Alais and Burr, 2004).
Although the cross-modal illusion literature does not generally refer to the literature on object formation, the phenomena are closely related. If information is integrated within and across modalities because the brain is trying to estimate the content of an external source, then integration (and, in conflicting cross-modal conditions, illusions) should be strongest when competing inputs are perceived as coming from a single source. Consistent with this idea, if sound elements are heard as originating from the same object, their combined spatial cues determine the perceived object's location; however, if they are heard as two distinct objects, the competing auditory object locations tend to repel one another (Best et al., 2007; Lee et al., 2009). Such thinking suggests that the strength of across-modal illusions depends on the likelihood that the different inputs are coming from the same external source.
Here, we test the hypothesis that object formation influences across-sensory illusions. We ask observers to judge the number of visual and/or auditory events from one direction in the presence of concurrent, competing visual and auditory streams from the opposite hemifield. We find that the effect of a competing within-modality stream is similar whether subjects report what they saw or what they heard, suggesting that similar object formation rules may influence both visual and auditory object formation. This within-modality integration is qualitatively similar to the effects usually described in the flash-beep illusion. Consistent with past reports, acoustic stimuli influence visual temporal perception more than the reverse. Crucially, however, an acoustic stream in the same hemifield as a visual target stream has a greater influence on visual temporal judgments than an acoustic stream in the opposite hemifield. Together, these results suggest that temporal judgments reflect the brain's best estimate of the content of sources in the external world, based on both within- and across-modality integration of noisy inputs.
Materials and Methods
Ethics
All subjects gave informed consent according to procedures approved by Massachusetts General Hospital and Boston University.
Participants
Thirteen adults (11 male, mean age 27.5 years, SD 4.4) participated in the study. All subjects had normal audiograms and normal or corrected-to-normal vision.
Stimuli
Acoustic stimuli.
Acoustic stimuli were generated in MATLAB at a sample rate of 24.414 kHz. Sound bursts were either harmonic complexes or high-pass filtered noise. The harmonic complexes consisted of the first five harmonics of 250 Hz (250, 500, … 1250 Hz), all of equal amplitude; all components had a fixed sine starting phase. The high-pass noise was generated by filtering white noise with a lowpass cutoff frequency of 1500 Hz, using MATLAB's “fir1” filter with a 100th order Hamming window, resulting in a 1500 Hz, −6 dB cutoff). The same white noise sample was used for all stimuli within one run but was generated afresh for each run. All bursts were time windowed (cosine gated, 6 ms onset/offset ramps for the harmonic complex and 3 ms for the noise bursts) and normalized by their root-mean-squared values to equate intensity. Two-event streams always consisted of two of the same type of sound (either harmonic complexes or noise bursts), with the two events separated by a 50 ms silent interval (Fig. 1C). Sounds were presented in virtual acoustic space by convolving stimuli with nonindividualized head-related transfer functions (Shinn-Cunningham et al., 2005). The two sound streams were simulated from −30° to the left and +30° to the right of the subject (relative to midline). On each trial, the directions of the two burst types (harmonic complex or noise) were randomly assigned. Testing was conducted in a single-walled, sound-treated booth. A continuous 55 dB SPL white noise (level calibrated using a Larson–Davis LXT2 sound-level meter) was presented throughout each session to ensure that environment sounds were masked. All acoustic stimuli were presented at 75 dB SPL.
Figure 1.

Task design and stimulus timing. A, Subjects were cued to report the number of events from auditory, visual, or auditory and visual streams from either the left or the right hemifield. After a short interval, either 1 or 2 flashes and/or 1 or 2 beeps were presented, simultaneously on both the left and right. Subjects were required to report how many flashes and beeps were in the stream from the attended direction while maintaining central fixation. B, Illustration of all possible trial types. The timing [i.e., whether an event occurred in Stimulus Interval (SI) 1 or 2] and direction (attended vs unattended) of all possible trial types are shown with the abbreviations used in the text to describe them. The number of stimuli (n) from the attended direction is denoted by Vn or An, whereas the number at the unattended location are denoted vn or an. In unisensory trials only auditory or visual stimuli were presented. C, Stimulus timing.
Visual stimuli.
Visual stimuli were generated in MATLAB using PsychToolBox extensions (http://psychtoolbox.org) (Brainard, 1997; Pelli, 1997). Visual stimuli were presented on a Dell Monitor Model# 2707WFPc with a refresh rate of 60 Hz.
Throughout each trial, a visual fixation point that subtended 0.3° of visual angle was presented at eye level on the midline. Flashes in the competing streams subtended 1° and were presented from −10° to the left and +10° to the right of the central fixation dot. All flashes were a single frame in duration; measurements using a photodiode and oscilloscope confirmed that each flash had a duration of 16 ms. In trials with two flashes, the interflash interval was 80 ms (Fig. 1C). The flashes were colored either pale cyan or pale yellow. Like the acoustic stimuli, colors were randomly assigned to the left and right independently on each trial. The flashes were calibrated to be equally salient, resulting in luminance values of 65 cd/m2 for the blue flash and 82 cd/m2 for the yellow flash, as measured with a photometer (Minolta LS-100). The fixation dot had a luminance of 40 cd/m2, while the background luminance was 0.1 cd/m2.
Trial structure.
Previous studies of the auditory-induced flash illusion presented observers with a single audio-visual (AV) stimulus pair comprised of some combination of 1–3 flashes and 0–3 beeps and asked observers to report the number of flashes while ignoring the beeps. In the present study observers saw two sets of spatially separated, competing stimuli, one from the left and one from the right. Observers maintained eye fixation on a central point. After a fixation period (500 ms), a 200 ms duration cue arrow indicated the side to which the subject should attend. Subjects then directed covert spatial attention to either the left or right while maintaining eye gaze on the central fixation point. After a 350 ms pause, the acoustic and/or visual stimuli were presented. Unisensory trial blocks contained either two streams of flashes or two streams of beeps, one from each hemifield (no stimuli in the other modality; Fig. 1A). In each trial, each stream contained either one or two events (flashes or beeps, depending on the block). The first events from the two hemifields always occurred simultaneously; if only one event was present, it always occurred in the first stimulus interval. In AV trial blocks, visual and auditory streams were presented from both hemifields. Each of the four streams (left/right × visual/auditory) consisted of either one or two events (Fig. 1B; i.e., there was always at least one flash and one beep from each hemifield). Circles appeared around the fixation dot 600 ms after the onset of the first stimulus, indicating the response period. In visual-only runs, a single circle appeared for 1200 ms. In auditory-only runs, a double circle appeared for 1200 ms. For AV runs, a single circle appeared for 1200 ms followed by a double circle for 1200 ms. On every trial in the AV condition, observers were asked to report both the number of flashes and, separately, the number of beeps from the attended direction. Subjects recorded their responses via button presses. We wanted to capture obligatory, cross-modal interactions; therefore, we instructed subjects to give two independent reports of the number of visual and auditory events in a given trial, which is likely to discourage perceptual binding, if anything. Pilot experiments, in which subjects reported only the number of flashes or only the number beeps (depending on trial block), thus removing the requirement to divide attention and reducing any bias toward segregating visual and auditory streams, produced judgments very similar to those in the main dual-task experiment.
To aid source separation, the simultaneous sounds from left and right differed in timbre and spectral content (Darwin and Hukin, 1997), and the competing flashes differed in color (Fox, 1998). The number of events in each stream, attended direction, attended sound timbre, and attended flash color were all counterbalanced, with trials presented in a pseudorandom order.
Testing procedure
Training.
Before each testing stage, subjects completed a pretest run with feedback. Subjects were tested on both auditory and visual unisensory conditions before completing the AV training condition. In unisensory training runs, all possible trial combinations were presented during the pretest. The color of the fixation point provided feedback; subjects had to achieve 80% correct performance before proceeding to AV training. In the AV training runs, 85% of trials were nonillusion trials that had the same number of flashes and beeps in the attended hemifield. During AV training, subjects received feedback for the number of flashes and beeps independently, with the fixation point changing color first to indicate whether the visual event count was incorrect, correct, or missing, and then a second time to provide feedback about auditory events. Subjects were required to get 80% of judgments correct on both auditory and visual judgments before proceeding to formal testing. Subjects reached this level of performance within a few (<4) training runs.
Testing.
A minimum of 30 trials per stimulus condition were presented. Unisensory testing consisted of 140 trials, separated into two blocks of 70 trials each. All subjects completed 4 AV blocks, each consisting of two runs of 120 trials, for a total of 480 trials. Within each block, all possible combinations of 1 or 2 flashes and 1 or 2 beeps in each location were presented in pseudorandom order. Thirty “catch” trials were intermingled randomly with the other trials. The catch trials always contained one flash in both visual streams and two beeps in both auditory streams; however, the visual streams' onsets were 300 ms later than the auditory streams' onsets to reduce the likelihood of the auditory and visual streams binding.
Data analysis.
Trials were classified according to the number of flashes and/or beeps at the attended and unattended locations. On each trial a response could either be “1” or “2.” We report the mean response across the 40 trials of each stimulus combination. These mean responses were compared using repeated-measure ANOVA tests.
Since subjects made a binary response (“1” or “2”), we recoded responses to “0” and “1” and performed logistic regression analysis (using MATLAB's “glmfit” function with a binomial distribution and a “logit” link) to assess the contribution of each stimulus component to the number of flashes/beeps perceived. In this analysis, our model included four predictor terms: one for each of stimuli at the attended and unattended location in each modality (with no interaction terms). We performed the regression for each subject, separately when counting flashes and when counting beeps. The dependent variable was the number of beeps (or flashes) reported and the four predictor variables were the number of flashes and beeps at the attended and unattended locations. Predicted responses were generated by using the resulting coefficients; these predictions were compared with the observed psychophysical data. We used the regression coefficients as a measure of the perceptual weight a subject gave to the auditory and visual stimuli at both attended and unattended locations. The regression coefficients were used to predict the number of flashes perceived (CFlash) and the number of beeps perceived (CBeep) as follows: CFlash = cF + wFV*V + wFv*v + wFA*A + wFa*a; CBeep = cB + wBV*V + wBv*v + wBA*A + wBa*a; where cF and cB are constants, V is the number of flashes at the attended location, v is the number of flashes at the unattended location, A is the number of beeps at the attended location, a is the number of beeps at the unattended location, and wES is the weighting given to stimulus element S (S = V, v, A, or a) when counting event type E (E = B for beeps, F for flashes).
We also compared the full model (above) to three reduced models to determine whether all of the factors in the full model were necessary to capture the pattern of results. The first used only the number of flashes (when counting flashes) or beeps (when counting beeps) at the attended location (a “reduced unisensory model”). The second model included the number of stimuli present at both the attended and unattended locations for the appropriate modality (a “full unisensory” model). The third model considered only the stimuli at the attended location, i.e., both the number of flashes and beeps at the attended location (a “reduced multisensory” model). We used the χ2 statistic to compare the deviance value from the full model to that obtained with each of the reduced models to assess whether adding additional terms significantly increases the statistical power of the model. For all subjects counting flashes or beeps, there was a significant difference in deviance for the full model when compared with the reduced unisensory model (the model that considered only the number of stimuli in the reported modality at the attended location; mean p = 1 × 10⁻⁵). Compared with the full unisensory model, the full model produced a significant (p < 0.05) decrease in deviance for 11/13 subjects when counting flashes and 6/13 subjects when counting beeps. Compared with the reduced multisensory model, the full model produced a significant decrease in deviance for 12/13 subjects when counting flashes and 13/13 subjects when counting beeps. We therefore elected to use the full model.
Results
Unisensory trials: within-modality integration
In unisensory blocks, we measured the ability of subjects to count flashes or beeps in the presence of a competing, same-modality stream from the opposite hemifield. Our aim was to assess the degree of obligatory, within-modality integration of temporal information for comparison with across-modality results. Observers accurately report the number of flashes (or beeps) when streams in both the attended and unattended directions have the same number of events (Fig. 2A: conditions V1v1 and V2v2, where “V” represents the to-be-attended direction, “v” the competing direction, and subscript denotes the number of events; Fig. 2B: corresponding auditory conditions A1a1 and A2a2). However, in both modalities, when the number of events in the two streams differs, the number in the competing stream influences judgments. The mean number of reported flashes when there are two flashes from the to-be-attended direction and one in the competing direction (V2v1) is less than two (Fig. 2A). Similarly, the average number of reported events to a V1v2 stimulus is greater than one. A similar pattern of results arises when counting beeps (Fig. 2B).
Figure 2.

Perception is biased by the number of events in to-be-ignored streams, both within and across modality. A, B, Mean (±SE) number of [flashes, beeps] reported in the unisensory [visual, auditory] condition. The number of [flashes, beeps] at the attended location is denoted by V or A and the unattended location by v or a. C, D, Mean (±SE) number of reported flashes and beeps in the auditory-visual condition when the accompanying [beep, flash] stimulus was either A2a2 (open triangles) or A1a1 (black triangles), V2v2 (open diamonds) or V1v1 (black diamonds). The gray symbols illustrate the values obtained in the corresponding unimodal condition (compare Figure 2A,B).
Two-way repeated-measures ANOVAs confirm that the number of events in both the unattended and attended directions significantly influences the reported number of events. The number of flashes on both the attended (F(1,12) = 457.3, p < 0.001) and on the unattended side (F(1,12) = 505.9 p < 0.001) significantly influences the number of flashes reported on unisensory visual trials. Similarly, the number of beeps on both the attended (F(1,12) = 132.6, p < 0.001) and the unattended side (F(1,12) = 273.8 p < 0.001) significantly influences the number of beeps reported on unisensory auditory trials. Interactions between the number of events in the attended direction and the number of events in the unattended direction are not significant (F(1,12) = 3.917, p = 0.07; F(1,12) = 1.96, p = 0.188, respectively, for flashes and beeps).
Multisensory conditions: within- and across-modality integration
In AV blocks, observers were asked to report, on each trial, both the number of flashes and the number of beeps from one direction. Each trial presented either one or two flashes and one or two beeps from the attended direction as well as either one or two flashes and one or two beeps from the competing direction. Subjects were instructed that the number of flashes and beeps varied independently, an instruction designed to promote perceptual segregation (and thus reveal obligatory cross-modal interactions).
We first consider the conditions in which the number of events in the competing modality was the same for both left and right streams. Figure 2C compares the average number of flashes reported when the two auditory streams each contained one beep and when each contained two beeps (i.e., A1a1 and A2a2). For comparison, the gray symbols show results for the same combinations of flash stimuli in the unisensory visual condition. The average number of reported flashes is greater in the presence of A2a2 streams than when there are no auditory stimuli (Fig. 2C, open symbols are above gray symbols). Although the A1a1 auditory streams have a more modest effect, the single beep streams increase the proportion of double-flash stimuli perceived as single flashes (black triangles are below gray triangles in Fig. 2C for the V2v1 and V2v2 conditions). A three-way repeated-measures ANOVA revealed significant main effects of the number of flashes on both the attended side (F(1,12) = 48.9, p < 0.001) and the unattended side (F(1,12) = 49.4, p < 0.001), as well as the number of beeps (F(1,12) = 10.2 p = 0.008).
Visual streams have a negligible effect on the perceived number of beeps (Fig. 2D). A three-way repeated-measures ANOVA revealed significant main effects of the number beeps on the attended side (F(1,12) = 184.2 p < 0.001) and on the unattended side (F(1,12) = 127.0, p < 0.001); however, the number of flashes did not have a significant effect (F(1,12) = 2.59, p = 0.14). These results highlight that both within-modality and across-modality integration influence temporal judgments, but that when across-sensory cues are in conflict, auditory temporal cues dominate over visual temporal cues.
Does the spatial location of the illusion-inducing sound matter?
Figure 2C demonstrates that double-beep streams cause a proportion of single-flash trials to be perceived as having double (illusory) flashes. Similarly, single-beep trials can result in double flashes being perceived as a single flash (flash fusion). In the cases plotted in Figure 2C, the acoustic streams in the attended and unattended directions both had the same number of events. To test whether the spatial location of the illusion-inducing sound influences perception, we next consider pairs of conditions differing in the location of the auditory streams. Specifically, in the pairs of conditions compared, the visual streams are identical; the two conditions differ only in whether the double-beep stream is in the attended direction or in the unattended direction. In one comparison, we consider whether the likelihood of perceiving an illusory flash (in conditions V1v1 and V1v2, which both have one flash in the attended direction) is greater when the double beep is in the attended direction (comparing A2a1 vs A1a2). In the second comparison, we ask whether the likelihood of flash fusion (in conditions V2v1 and V2v2, which both have two flashes in the attended direction) is greater when the single beep is in the attended direction (comparing A1a2 vs A2a1). These comparisons are shown in Figure 3A, where the dotted brackets connect conditions that differ only in the direction of the illusion-inducing auditory stream. (For completeness, solid brackets link conditions differing in the number of flashes at the unattended location). Figure 3B plots the difference in the mean number of reported flashes for the condition pairs connected by dotted brackets. The number of illusory flashes is greater when the illusion-inducing double-beep stream is in the attended direction compared with when it is in the unattended direction (two leftmost bars of Fig. 3B). Similarly, observers report fewer double flashes (flash fusion is stronger) when the illusion-inducing single-beep stream is in the attended direction (two rightmost bars of Fig. 3B).
Figure 3.
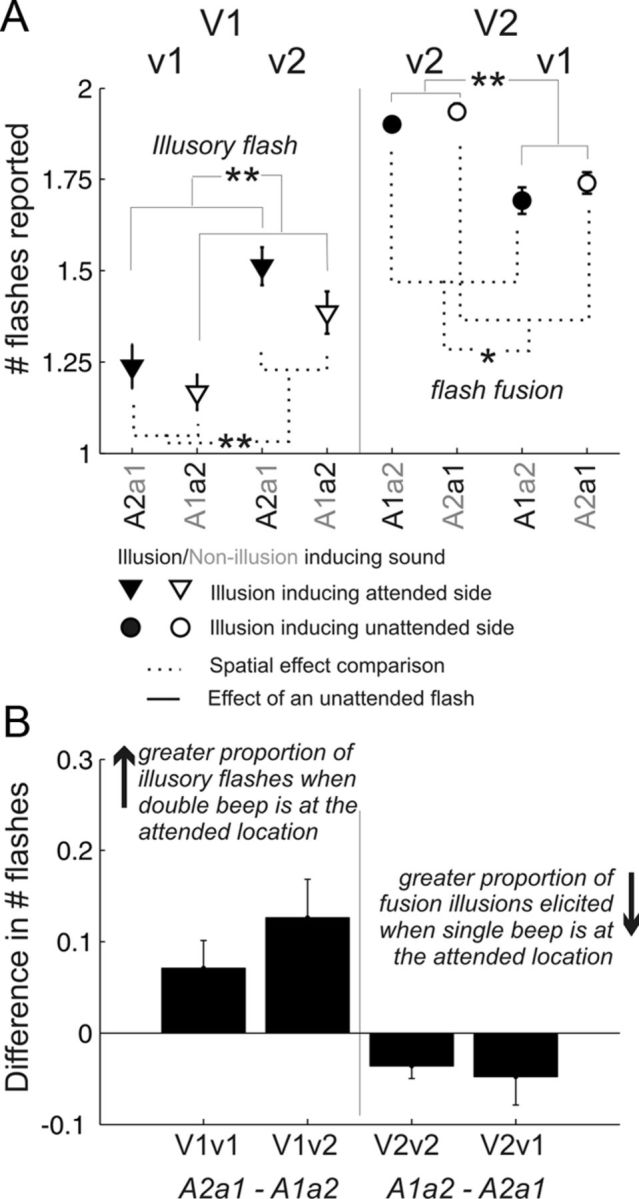
An acoustic stream from the same direction as a target visual stream is more likely to cause auditory-induced visual illusions than the same stream from the opposite hemifield. A, Reported number of flashes (mean ±SE) to stimuli differing only in the location of the illusion-inducing sounds. Filled symbols indicate the conditions where the illusion-inducing stimulus is from the attended side; open symbols indicate the same combination of stimuli but with the illusion-inducing stimulus from the competing side. On the left, the attended visual stimulus is a single flash (V1); a stronger illusory flash effect corresponds to a greater number of flashes reported. Correspondingly, on the right, a double flash (V2) is from the attended direction; a greater flash fusion effect results in a reduction in the mean number of reported flashes. When the illusion-inducing sound is from the attended side, subjects are more likely to report a visual illusion. Significant differences (pairwise Wilcoxon rank sum tests) are indicated by asterisks (*p < 0.05; **p < 0.01). B, Mean (±SE) of the difference in the reported number of flashes when the illusion-inducing sound is from the attended side versus the unattended side. Differences, calculated from the data in Figure 3A, demonstrate that stronger illusory percepts arise when the illusion-inducing stimulus is spatially congruent with the attended flash stream.
Cue combination within and across modalities
Figure 4 plots the mean number of reported events for all 16 possible combinations of flash and beep stimuli. All of the effects discussed above can be seen in this grand summary.
Figure 4.

The perceived number of flashes and beeps is well predicted by a weighted sum of the events in the two within- and two across-modality streams. A, Counting flashes—the mean (±SE) number of flashes for all AV combinations. Solid symbols show behavioral results, while open symbols show predictions using the weights derived from a linear regression. The visual stimulus condition is listed at the top of the figure; each column of four data values presents the same combination of flash stimuli, while the four points within each column represent the four possible combinations of beeps (listed at the bottom of the figure). B, Counting beeps—the mean (±SE) number of beeps for all possible AV combinations.
First, an unattended, spatially distinct stimulus in the same modality affects the perception of the target at the attended direction; a result showing that spatial attention is imperfect at filtering out a same-modality competing stream. Specifically, both when counting flashes (Fig. 4A) and when counting beeps (Fig. 4B), the presence of two same-modality events in the unattended direction increases the number of illusory events reported (filled symbols in column 2 are above the corresponding filled symbols in column 1). Moreover, when the competing same-modality stream in the unattended direction contains only one event, observers are more likely to report a single event, even if there are actually two events in the attended direction (the filled symbols in column 4 are above the corresponding filled symbols in column 3).
Second, cross-modal effects are asymmetrical, as has been previously reported (Shams et al., 2002; Andersen et al., 2004). While auditory streams influence the number of flashes perceived, visual streams have relatively little influence on the number of beeps perceived (within each column of Fig. 4A, the four filled symbols differ from one another, showing the influence of the auditory stimuli, while in Fig. 4B, the four filled symbols in each column are nearly identical).
Third, the spatial layout of the acoustic streams determines how much the number of beeps bias perception of the flashes. In each column of Figure 4A, the number of reported flashes is greater for the A2a1 stimulus than for the A1a2 stimulus.
For each listener, we computed a logistic regression analysis (see Materials and Methods) on all 16 possible combinations of one or two beeps and one or two flashes at each location. The resulting regression coefficients allowed us to estimate the perceptual weight that an observer gave to the temporal information in each the four streams (two visual and two auditory) when judging the number of events in the attended direction. We used these weights to predict the average number of perceived visual and auditory events in each stimulus condition. The mean predictions averaged over subjects (Fig. 4, open circles) fit the data well, explaining 96% of the total variance in both the number of flashes perceived and the number of beeps perceived. In addition, in 28 of the 32 conditions (16 visual and 16 auditory), the predicted number of events reported was not significantly different from the mean number of events actually perceived [pairwise Wilcoxon signed rank test; p > 0.0031 (0.05/16)]. The four cases where there were small, but statistically reliable differences was when counting flashes (p = 0.0012) or beeps (p = 0.0017) in the A1a1V1v1 condition, beeps in the A1a1V2v2, condition (p = 0.0001), and beeps in the V1v1A2A1 condition (p = 0.0012).
We also performed a logistic regression analysis on the unisensory data to compare the perceptual weights given to the to-be-attended stream and the stream in the opposite hemifield. The relative weight given to the stream at the attended direction versus the stream at unattended location quantifies the extent to which spatial attention is “leaky” (Fig. 5A,B), as follows:
 |
If the unattended location is completely ignored, the leakiness ratio would be 0, whereas if the to-be-attended and the to-be-ignored streams are weighted equally, the leakiness ratio would be 1. Our subjects have leakiness ratios of 0.62 ± 0.02 (mean ± SE) for counting flashes and 0.68 ± 0.0.05 for counting beeps (the leakiness values for judging flashes and beeps are not statistically different; Wilcoxon rank-sum test, p = 0.45).
Figure 5.

Within modality effects are similar both in unisensory and cross-sensory trials and in both vision and audition; however, while auditory streams have a strong effect on visual temporal judgments, visual streams have a negligible influence on auditory temporal judgments. A–D, Mean ± SE perceptual weight, derived from linear regression of the observed responses, for the to-be-attended visual stream and the competing visual stream when counting flashes in the unisensory condition (A), for the to-be-attended auditory stream and the competing auditory stream when counting beeps in the unisensory condition (B), and for the perceptual weight for the to-be-attended and competing auditory and visual streams when counting flashes (C) or beeps (D) in the multisensory condition. E, Scatter plot for individual subjects plotting the perceptual weight given to the visual stream when counting beeps against the perceptual weight given to the auditory stream when counting flashes.
The weight given to the attended and unattended within and across-modality stimuli are plotted in Figure 5, C and D. The within-modality leakiness ratio in the cross-sensory conditions (see Eq. 1; ratios derived from the data plotted in Fig. 4) are statistically equivalent when counting flashes (0.58 ± 0.03 mean ± SE) and when counting beeps (0.64 ± 0.03; Wilcoxon p = 0.15). Moreover, the within-modality leakiness ratios found from the two-modality conditions are virtually identical to those observed in the unisensory conditions.
When counting flashes, both attended and unattended auditory streams are given nonzero perceptual weight (Fig. 5C). However, the weight given to the auditory stream from the attended direction (0.96) is greater than that given to the auditory stream from the unattended direction (0.45; Wilcoxon rank sum test: p = 0.005). Thus, this analysis supports the conclusion that an auditory distractor that is closer to an attended visual stream has a bigger influence on the perceived number of visual events than an auditory distractor that is farther from the attended flash(es). In contrast, the weight given to flashes when counting beeps is essentially zero (mean attended weight = 0.23, unattended weight = 0.02 Wilcoxon sign test to test whether the mean is significantly different from zero, p = 0.27 and p = 1.0, respectively) regardless of its direction (Fig. 5D). Figure 5E compares the perceptual weights given to a cross-modal distractor stream from the attended direction when counting flashes (x-axis) and when counting beeps (y-axis). Overall, the effect of flashes on counting beeps is smaller than the effect of beeps on counting flashes, consistent with past results (Andersen et al., 2004).
Finally, we considered the responses that subjects made to catch trials interleaved in the AV test blocks in which the auditory streams preceded the visual streams by 300 ms. As described in Materials and Methods, catch trials presented a single flash in both visual streams and two beeps in each of the auditory streams. Compared with temporally aligned AV trials, the influence of auditory beeps on the reported number of visual events in the catch trials was significantly reduced (Fig. 6; Wilcoxon signed rank test p = 0.0029). The perceived number of auditory events remained unaffected by the presence of single-flash visual streams (Wilcoxon signed rank test p = 0.33).
Figure 6.
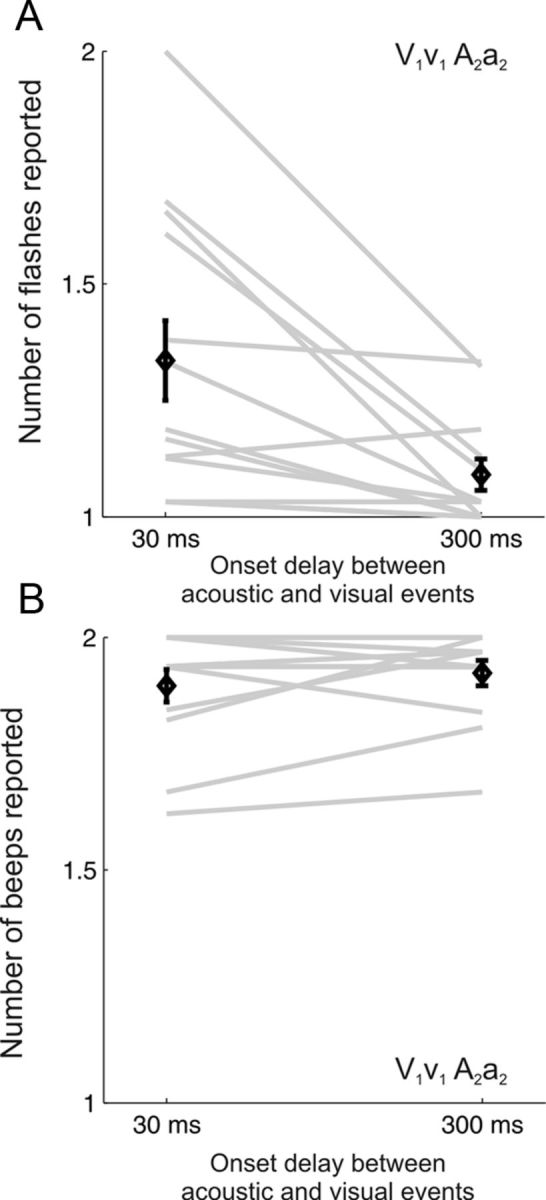
Temporal synchrony is required for across-modality interactions. A, B, The number of reported flashes (A) or beeps (B) for V1v1 A2a2 stimuli when the acoustic stimuli was delayed by 30 ms, relative to the visual stimuli, or by 300 ms. The across subject mean ± SEM (black diamonds) are overlaid on the individual subject data (gray lines).
Discussion
Here, we illustrate that multiple factors affect how information is combined both within and across the auditory and visual domains. While many studies have considered how this is achieved either within one sensory system or across sensory systems, very few have considered both within- and across-modality integration. We asked whether the rules that determine object formation also influence the across-sensory illusions by exploring how spatial configuration affects the strength of sound-induced flash illusions.
By asking subjects to attend to one of two spatially separated streams and to report the number of auditory and visual events that occurred, we are able to assess how the presence of different competing stimuli affect visual and auditory temporal perception. We find that when observers are asked to report the number of events from a stream in one direction and in one modality, attentional focus is imperfect: subjects systematically misreport the number of events from the attended direction when a competing within-modality stream contains a conflicting number of events. In both auditory and visual conditions, the competing streams are readily separable, appearing from opposite hemifields and with distinct content (timbre or color); thus, these illusory percepts show that spatial attention does not fully suppress competing streams even when they are distinct. When we quantify this with a measure of “leakiness,” comparing the perceptual contributions of the stream that was supposed to be attended and the stream that was supposed to be ignored, we find that the stream from the to-be-ignored direction had a weight that is nearly 50% of the weight given to the to-be-attended stream, regardless of whether subjects are counting auditory or visual stimuli. In addition, this within-modality leakiness is equally strong in the unisensory and cross-modal conditions.
When subjects are presented with both flashes and beeps and asked to report the number of each kind of event from one direction, the number of beeps biases the number of flashes perceived, but not the opposite. Thus, our results show perceptual integration both within and across sensory modalities and confirm that when making temporal judgments, audition has a much stronger effect on vision than vice versa.
One previous study demonstrated that a second flash at a different location could elicit an illusory flash, as we found in our unisensory conditions; however, this study found no evidence of a within-modality flash fusion effect (Chatterjee et al., 2011). From this, the authors concluded that different underlying processes cause within-vision and cross-modal effects. However, in our study, we find both unisensory illusory flashes and flash fusion, perhaps because of procedural differences in the studies (e.g., here, both attended and unattended stimuli were presented at equal eccentricities, all possible combinations of single and double stimuli were tested, etc.). Regardless, our results are consistent with the possibility that there is a common mechanism underlying within- and across-modality effects integration of temporal information. That said, some previous studies have illustrated that seemingly similar cross-sensory effects can arise through different underlying mechanisms (Odgaard et al., 2003, 2004). Thus, even though we find striking similarities between within-modal effects and the influence of auditory information on visual perception, we cannot definitively conclude that the underlying physiological processes are the same.
Neuroimaging studies reveal potential neurophysiological correlates of sound induced visual illusions. fMRI studies isolate activity in V1 during both illusory flash trials and flash fusion trials that correlate both with the reported number of flashes and the activity seen in response to nonillusion trials (Watkins et al., 2006; Watkins et al., 2007). EEG studies have shown enhanced oscillatory activity within visual cortex during illusory trials (Shams et al., 2001; Bhattacharya et al., 2002) and suggest that a second sound event induces a complex interplay between auditory and visual cortices, resulting in the illusory flash. These studies reveal aspects of the neural basis for the cross-modal interactions that are observed psychophysically. The qualitative similarity between the within-modality effects that we observe and the across-modality effect that auditory perception has on visual perception suggests that similar neural computations are engaged during within- and across-modality interactions. Such interactions may be the functional consequence of the large-scale cross talk that has recently been observed between putatively unisensory cortices (Schroeder and Foxe, 2005). We believe our experimental paradigm can be exploited to explore the neural basis of across- and within-modality integration of sensory information in physiological, neuroimaging, and behavioral paradigms.
We find that visual judgments are more affected by auditory events in the to-be-attended hemifield than by auditory events in the opposite hemifield; however, the influence of auditory streams on visual perception depends on the temporally coincidence of the streams in the two modalities. We therefore argue that the phenomena we observe are consistent with a set of general object-formation principles that cause sensory inputs that occur closely together in time or space to be more tightly bound together into a single cross-modal object. In particular, we suggest that the perceived properties of such an object are derived from a weighted combination of the underlying cues, with the weight given to a particular cue determined by its relative reliability.
Previous studies have suggested that the flash-beep illusion is unaffected by the spatial configuration of the auditory and visual sources (Innes-Brown and Crewther, 2009). However, by presenting competing streams from opposite hemifields and asking observers to report the number of events from one of the visual streams, we demonstrate that spatial separation between the auditory and visual streams influences the strength of the flash-beep illusion. Given that spatial proximity strongly affects how sensory inputs group into perceptual objects (Marr, 1982; Bregman, 1990; Shinn-Cunningham, 2008), we suggest that object formation principles influence the likelihood of perceiving sound-induced visual illusions. Moreover, our subjects reported the perception that the visual flashes were “captured” by the auditory beeps and that the location of the auditory beeps were, in a manner consistent with the ventriloquism illusion (Bertelson and Radeau, 1981), captured by the visual flashes, lending subjective evidence to the claim that the auditory bias of visual temporal perception is related to object formation.
Temporal synchrony also affects object formation (Alain and Arnott, 2000; Blake and Lee, 2005; Shinn-Cunningham, 2008; Hupé and Pressnitzer, 2012). Previous studies show that auditory-induced flash illusions are most salient when the onsets of the stream of flashes and the stream of beeps fall within milliseconds of one another (Shams et al., 2002), consistent with the idea that across-sensory grouping plays a role in these illusions. Here, in most of the trials, the streams begin at nearly the same moment, promoting integration of the streams; this synchrony enhances both within- and across-modality integration. However, when the flashes were delayed relative to the beeps (Fig. 6), across-modality integration decreased.
A number of past studies of auditory formation show that when object-formation cues are ambiguous or conflicting, some cues can contribute to the perceived qualities of multiple perceptual objects (Darwin and Ciocca, 1992; Hall et al., 2000; Shinn-Cunningham and Wang, 2008). In our design, various grouping cues are at odds with one another: temporal synchrony promotes grouping; spatial proximity varies, altering the likelihood of grouping; stimulus modality, color, and/or timbre strongly promote segregation of the streams into distinct objects. The inherent conflict of grouping cues may help explain why, in our experiments, there is “leakage” of information across streams, both within and across modality, even though the observers all subjectively perceive four different streams in the mixture.
Our aim was to see to what extent across-modal interactions were obligatory; for this reason, we explicitly instructed listeners that the number of auditory and visual events in a trial were independent, and asked them to report the perceived number of flashes (which were likely to be more influenced by across-modal effects) before reporting the number of beeps. We simulated auditory streams at 30 degrees left and right of midline to ensure that they were easily segregated, while the visual streams were at 10 degrees left and right of midline to ensure that they were easy to see while eye gaze was maintained straight ahead; of course, together, these decisions lead to a spatial mismatch between auditory and visual events. In contrast, in natural settings, a priori expectations are that one distal source will produce temporally correlated auditory and visual stimuli arising from exactly the same direction. Thus, our subject instructions and stimulus design are likely to produce weaker binding of auditory and visual inputs than would arise in natural settings, and likely represent a lower-bound on the extent to which cross-modal stimuli are integrated. Despite this, we observed a strong influence of temporal auditory information on visual temporal perception.
Together, these observations raise testable predictions about how parametric manipulation of spatial and temporal congruence, which alter multisensory object formation, will affect illusory percepts. For instance, the degree of temporal coincidence will influence both within- and across-modality interactions. In addition, just as spatial acuity of a visual input influences the “reverse-ventriloquism” illusion (Alais and Burr, 2004), reducing the reliability of visual temporal perception (e.g., by altering visual contrast) should increase the influence of the auditory stream on judgments of the number of flashes, while decreasing the reliability of auditory temporal perception is likely to increase the likelihood that visual events influence sound perception. Finally, increasing the semantic congruence of our stimuli should lead to greater integration across sensory modalities, and hence strong across-modality interactions in perception. These ideas can be tested and contrasted in behavioral, physiological, and neuroimaging experiments to reveal the neural mechanisms that enable across-modality perceptual binding and perceptual integration.
Footnotes
This work was supported by a L'Oreal-UNESCO For Women In Science Fellowship and a Royal Society Dorothy Hodgkin Fellowship to J.K.B., Grant N000141010118 from the Office of Naval Research (B.G.S.-C), and a grant from the National Institutes of Health (K99/R00DC010196; A.K.C.L.). We thank Ross K. Maddox for critical reviews of this manuscript.
References
- Alain C, Arnott SR. Selectively attending to auditory objects. Front Biosci. 2000;5:D202–D212. doi: 10.2741/alain. [DOI] [PubMed] [Google Scholar]
- Alais D, Burr D. The ventriloquist effect results from near-optimal bimodal integration. Curr Biol. 2004;14:257–262. doi: 10.1016/j.cub.2004.01.029. [DOI] [PubMed] [Google Scholar]
- Andersen TS, Tiippana K, Sams M. Factors influencing audiovisual fission and fusion illusions. Brain Res Cogn Brain Res. 2004;21:301–308. doi: 10.1016/j.cogbrainres.2004.06.004. [DOI] [PubMed] [Google Scholar]
- Bertelson P, Radeau M. Cross-modal bias and perceptual fusion with auditory-visual spatial discordance. Percept Psychophys. 1981;29:578–584. doi: 10.3758/bf03207374. [DOI] [PubMed] [Google Scholar]
- Best V, Gallun FJ, Carlile S, Shinn-Cunningham BG. Binaural interference and auditory grouping. J Acoust Soc Am. 2007;121:1070–1076. doi: 10.1121/1.2407738. [DOI] [PubMed] [Google Scholar]
- Bhattacharya J, Shams L, Shimojo S. Sound-induced illusory flash perception: role of gamma band responses. Neuroreport. 2002;13:1727–1730. doi: 10.1097/00001756-200210070-00007. [DOI] [PubMed] [Google Scholar]
- Blake R, Lee SH. The role of temporal structure in human vision. Behav Cogn Neurosci Rev. 2005;4:21–42. doi: 10.1177/1534582305276839. [DOI] [PubMed] [Google Scholar]
- Brainard DH. The psychophysics toolbox. Spat Vis. 1997;10:433–436. [PubMed] [Google Scholar]
- Bregman AS. Auditory scene analysis. Cambridge, MA: MIT; 1990. [Google Scholar]
- Chatterjee G, Wu DA, Sheth BR. Phantom flashes caused by interactions across visual space. J Vis. 2011;11 doi: 10.1167/11.2.14. pii:14. [DOI] [PubMed] [Google Scholar]
- Darwin CJ, Hukin RW. Perceptual segregation of a harmonic from a vowel by interaural time difference and frequency proximity. J Acoust Soc Am. 1997;102:2316–2324. doi: 10.1121/1.419641. [DOI] [PubMed] [Google Scholar]
- Darwin CJ, Ciocca V. Grouping in pitch perception: effects of onset asynchrony and ear of presentation of a mistuned component. J Acoust Soc Am. 1992;91:3381–3390. doi: 10.1121/1.402828. [DOI] [PubMed] [Google Scholar]
- Driver J, Davis G, Russell C, Turatto M, Freeman E. Segmentation, attention and phenomenal visual objects. Cognition. 2001;80:61–95. doi: 10.1016/s0010-0277(00)00151-7. [DOI] [PubMed] [Google Scholar]
- Fox E. Perceptual grouping and visual selective attention. Percept Psychophys. 1998;60:1004–1021. doi: 10.3758/bf03211935. [DOI] [PubMed] [Google Scholar]
- Gebhard JW, Mowbray GH. On discriminating the rate of visual flicker and auditory flutter. Am J Psychol. 1959;72:521–529. [PubMed] [Google Scholar]
- Hall MD, Pastore RE, Acker BE, Huang W. Evidence for auditory feature integration with spatially distributed items. Percept Psychophys. 2000;62:1243–1257. doi: 10.3758/bf03212126. [DOI] [PubMed] [Google Scholar]
- Hupé JM, Pressnitzer D. The initial phase of auditory and visual scene analysis. Philos Trans R Soc Lond B Biol Sci. 2012;367:942–953. doi: 10.1098/rstb.2011.0368. [DOI] [PMC free article] [PubMed] [Google Scholar]
- Innes-Brown H, Crewther D. The impact of spatial incongruence on an auditory-visual illusion. PLoS One. 2009;4:e6450. doi: 10.1371/journal.pone.0006450. [DOI] [PMC free article] [PubMed] [Google Scholar]
- Lee AK, Deane-Pratt A, Shinn-Cunningham BG. Localization interference between components in an auditory scene. J Acoust Soc Am. 2009;126:2543–2555. doi: 10.1121/1.3238240. [DOI] [PMC free article] [PubMed] [Google Scholar]
- Marr D. San Francisco: Freeman; 1982. Vision. A computational investigation into the human representation and processing of visual information. [Google Scholar]
- McGurk H, MacDonald J. Hearing lips and seeing voices. Nature. 1976;264:746–748. doi: 10.1038/264746a0. [DOI] [PubMed] [Google Scholar]
- Odgaard EC, Arieh Y, Marks LE. Cross-modal enhancement of perceived brightness: sensory interaction versus response bias. Percept Psychophys. 2003;65:123–132. doi: 10.3758/bf03194789. [DOI] [PubMed] [Google Scholar]
- Odgaard EC, Arieh Y, Marks LE. Brighter noise: sensory enhancement of perceived loudness by concurrent visual stimulation. Cogn Affect Behav Neurosci. 2004;4:127–132. doi: 10.3758/cabn.4.2.127. [DOI] [PubMed] [Google Scholar]
- Pelli DG. The VideoToolbox software for visual psychophysics: transforming numbers into movies. Spat Vis. 1997;10:437–442. [PubMed] [Google Scholar]
- Schroeder CE, Foxe J. Multisensory contributions to low-level, ‘unisensory’ processing. Curr Opin Neurobiol. 2005;15:454–458. doi: 10.1016/j.conb.2005.06.008. [DOI] [PubMed] [Google Scholar]
- Shams L, Kamitani Y, Shimojo S. Visual illusion induced by sound. Brain Res Cogn Brain Res. 2002;14:147–152. doi: 10.1016/s0926-6410(02)00069-1. [DOI] [PubMed] [Google Scholar]
- Shams L, Kamitani Y, Thompson S, Shimojo S. Sound alters visual evoked potentials in humans. Neuroreport. 2001;12:3849–3852. doi: 10.1097/00001756-200112040-00049. [DOI] [PubMed] [Google Scholar]
- Shinn-Cunningham BG. Object-based auditory and visual attention. Trends in cognitive sciences. 2008;12:182–186. doi: 10.1016/j.tics.2008.02.003. [DOI] [PMC free article] [PubMed] [Google Scholar]
- Shinn-Cunningham BG, Wang D. Influences of auditory object formation on phonemic restoration. J Acoust Soc Am. 2008;123:295–301. doi: 10.1121/1.2804701. [DOI] [PubMed] [Google Scholar]
- Shinn-Cunningham BG, Kopco N, Martin TJ. Localizing nearby sound sources in a classroom: binaural room impulse responses. J Acoust Soc Am. 2005;117:3100–3115. doi: 10.1121/1.1872572. [DOI] [PubMed] [Google Scholar]
- Watkins S, Shams L, Tanaka S, Haynes JD, Rees G. Sound alters activity in human V1 in association with illusory visual perception. Neuroimage. 2006;31:1247–1256. doi: 10.1016/j.neuroimage.2006.01.016. [DOI] [PubMed] [Google Scholar]
- Watkins S, Shams L, Josephs O, Rees G. Activity in human V1 follows multisensory perception. Neuroimage. 2007;37:572–578. doi: 10.1016/j.neuroimage.2007.05.027. [DOI] [PubMed] [Google Scholar]