

Abstract
The purpose of this study was to investigate the use of magnetic resonance (MR) imaging and image processing software to determine the functional cross-sectional area (FCSA) (the area of muscle isolated from fat) of the lumbar paraspinal muscles. The measurement of the morphology of the lumbar paraspinal muscles has become the focus of several recent investigations into the aetiology of low back pain. However, the reliability and validity of determining the FCSA of the lumbar paraspinal muscles using MR imaging are yet to be reported. T2 axial MR scans at the L1-S1 spinal levels of six subjects were obtained using identical MR systems and scanning parameters. Lean paraspinal muscle, vertebral body bone and intermuscular fat were manually segmented using image analysis software to assign a grey scale range to the MR signal intensity emitted by each tissue type. The resultant grey scale range for muscle was used to determine FCSA measurements for each of the paraspinal muscles, psoas, quadratus lumborum, erector spinae and lumbar multifidus on each scan slice. As various biological, instrument and measurement factors can affect MR signal intensity, a sensitivity analysis was conducted to determine the error associated in calculating FCSA for paraspinal muscle using a discrete grey scale range. Cross-sectional area and FCSA measurements were repeated three times and reliability indices for the FCSA measurements were obtained, showing excellent reliability, intra class correlation coefficient (mean=0.97, range 0.90–0.99) and %SEM (mean=2.6%, range 0.7–4.8%). In addition, the error associated with miscalculation of the grey scale range for the MR signal intensity of muscle was calculated and found to be low with an error of 20 grey scale units at the upper end of the muscle’s grey scale range resulting in a very small error in the measured muscle FCSA. The method presented in this paper has a variety of practical applications in areas such as evidence-based rehabilitation, biomechanical modelling and the determination of segmental inertial parameters.
Keywords: Lumbar spine, Magnetic resonance imaging, Cross sectional area, Low back pain, Muscle morphology
Introduction
The measurement of the morphology of the lumbar paraspinal muscles has become the focus of several recent investigations into the aetiology of low back pain (LBP) [6, 8, 12, 16, 18, 21, 36]. Muscles in this group, consisting of the psoas, quadratus lumborum, iliocostalis lumborum, longissimus lumborum and the lumbar multifidus, can have a direct influence on segmental stability and control of the lumbar spine due to their attachments to the spinal column. Coordinated, co-contraction of the lumbar paraspinal muscles with the abdominal wall muscles is thought to have a stabilising effect on the lumbar spinal segments; therefore, providing a safe platform for trunk movement [30, 39]. It has been suggested that dysfunction of these muscles is a significant factor in the aetiology and chronicity of LBP [6, 12, 15, 29].
Cross-sectional area (CSA) asymmetries of certain lumbar paraspinal muscles have previously been associated with the presence of LBP [4, 5, 12, 13, 16, 31]. These asymmetries are thought to be a quantitative manifestation of lumbar paraspinal muscle dysfunction. Hides et al. [13] used real time ultrasound to measure the CSA of the lumbar multifidus from L2 to S1 in subjects with acute, first episode, LBP. The authors reported uni-segmental atrophy, represented by a reduced lumbar multifidus CSA, which correlated with the symptomatic side of the body and spinal level. In a subsequent study [12], localised atrophy of the lumbar multifidus was shown not to spontaneously recover following the resolution of LBP. This phenomenon was thought to be sequelae to pain-induced inhibition of this muscle [12]. A deficit in the capacity of the segmental stabilising muscles of the lumbar spine has been proposed as a mechanism for recurrent low back injury [5, 12].
Investigations into the aetiology of LBP by Kader et al. and Parkkola et al. [16, 31] have also revealed that significant atrophy of specific lumbar paraspinal muscles can occur without a reduction in the total CSA within the muscles’ fascial boundaries. These authors described paraspinal muscle atrophy in terms of replacement of muscle with fat and fibrous tissue, which would result in reduced functional contractility of muscle. Therefore, a measure of the functional cross-sectional area (FCSA) i.e. the area of lean muscle tissue within a muscle’s fascial boundaries would be a better indicator of the muscle’s contractile ability.
Imaging techniques such as ultrasound, computed tomography (CT) and magnetic resonance (MR) allow in vivo calculation of low back muscle CSAs. The use of ultrasound is limited to the examination of superficial muscles and the resolution of the resulting images is generally low which can make tissue type discrimination difficult [11]. CT allows high-resolution tissue type discrimination within trunk muscle fascial boundaries [5]. However, CT involves exposure to significant doses of ionising radiation and is therefore “a less than ideal” technique for assessing the morphology of spinal muscles in asymptomatic subjects. Previous MR studies have reported atrophy of selected lumbar paraspinal muscles, in terms of replacement of muscle bulk with fat and fibrous tissue, and have relied upon radiologist assessment and grading of the muscles’ appearance i.e. degree of muscle atrophy and fat infiltration, without quantitative assessment of the intramuscular morphology [16, 31].
Segmentation (or tissue classification) is the process whereby various tissues visible on either a CT or MR image are distinguishable by the signal intensity they emit [1, 10, 14, 23, 27, 35]. Danneels et al. [5] conducted a study that used CT in conjunction with image processing software to produce quantitative measurement of “low-fat” CSAs of low back muscles. Their approach involved eliminating pixels within the fascial boundary with grey scale values that were thought to represent fat. In the Danneels’ study however, the method of determining grey scale values for the different tissue types was not described in detail.
The signal intensity of each pixel from an MR image can be assigned a grey scale value using image analysis software [1, 10, 14, 27]. Segmentation is a complex area in automated MR image analysis due to potential problems such as heterogeneous signal intensities in tissues and the possibility that individual pixels of an MR image may contain two or more anatomical structures (the partial volume effect) [1, 10, 14, 26, 34]. Regardless of these concerns, recent investigations using MR imaging to determine inertial properties of body segments have identified tissue types using discrete grey scale ranges for signal intensity emitted by various tissues including fat, bone and muscle [3, 32]. More sophisticated methods of MR image tissue segmentation have been successfully utilised in the area of brain research. Harris et al. [10] and Meier and Guttmann [26] developed methods to automatically segment MR images of the brain according to the signal intensity of manually identified areas of homogenous white matter, grey matter and cerebrospinal fluid.
Despite the use of identical MR systems and scanning parameters, homogeneous tissue may have varying signal intensity between subjects and on one scan slice within subjects. Further, the MR signal intensity for muscle may vary depending on a variety of factors such as the positioning of the tissue within the scan area and the intensity of metabolic activity of the muscle during scanning [2, 10, 14]. The abovementioned biological and measurement effects on MR signal intensity pose a significant problem for researchers wishing to measure the FCSA of the paraspinal muscles, as isolating the area of only one tissue type requires a grey scale range for that tissue type to be identified.
Therefore, the purpose of this investigation was to determine a viable method to analyse the intramuscular morphology of the lumbar paraspinal muscles using MR imaging. In the attempt to determine the preferred method of ensuring that non-contractile tissue was largely eliminated from CSA measurements, two methods of obtaining a grey scale range for the MR signal intensity of lean paraspinal muscle were investigated. Furthermore, the reliability of what was determined to be the preferred method was examined.
Materials and methods
Subjects
The MR scans used in this study were collected as part of a larger study investigating the relationship between paraspinal muscle morphology and low back injury in professional fast bowlers in the game of cricket. The subjects were six, male, professional fast bowlers, aged between 20 years and 28 years of age, who were fit to bowl at the time of data collection. Ethical approval had been provided for the larger study by the Local Region Ethics Committee of the University of Nottingham, UK, and Edith Cowan University, Western Australia.
Scanning protocol and image analysis
Axial T2 weighted MR scans of the six subjects were taken at seven spinal levels; they being the lower vertebral end plate of L1 to L5 and the upper vertebral endplate of L5 and S1 (Fig. 1). Following 30 min of quiet sitting, the subjects were positioned supine in the MR scanner with their hips and knees flexed to allow their normal lumbar lordosis to be comfortably maintained. A spirit level was used to ensure a level trunk and pelvis position. These scans were all obtained during a single data collection session using a General Electric 1.5 T MR scanner employing a fast spin echo sequence of TR 4,000 ms, Teef 120 ms, 5 mm slice thickness, 512×512 matrix. The field of view for the scans (33 cm×33 cm) was set so that all paraspinal muscles of interest were visible. These muscles were the left and right psoas major, quadratus lumborum, multifidus and the combined bulk of the erector spinae muscles, iliocostalis and longissimus. The iliocostalis and longissimus were grouped together as their separate fascial boundaries were difficult to determine on some scans. Images were saved as 16 Bit DICOM files for later analysis.
Fig. 1.
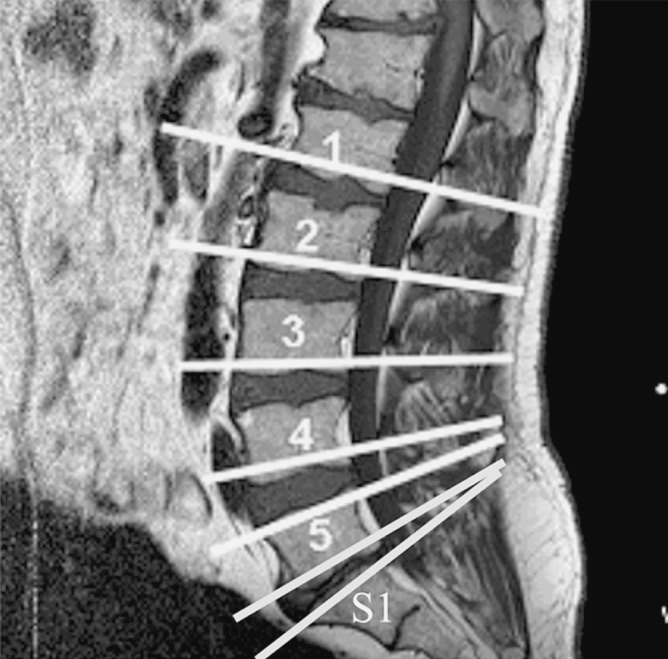
Scout view of the axial T2 MR scans. Scans were taken at the lower vertebral endplate of L1 to L5 and the upper vertebral endplate of L5 and S1
Image J V1.3 (National Institutes of Health, USA) software installed on a notebook computer, running a 2.4-GHz Intel Pentium IV processor, was used to analyse the scans. The scans were imported into the software program and enlarged using a 2:1 zoom ratio. The scale of the image processing software’s measurement function was calibrated by dividing the number of pixels contained along the vertical and horizontal lengths of the images (512), by the scans’ known height and width (33 cm×33 cm) to give a scale of 15.52 pixels/cm.
Muscle CSA measurements at each spinal level were determined by outlining the fascial boundary of the abovementioned muscles (Fig. 2) and using the measurement function of the image processing software. The quadratus lumborum and psoas muscles were only measured at the L1 to L4 and L5 to S1 spinal levels respectively, as these muscles were not clearly discernible below these levels.
Fig. 2.
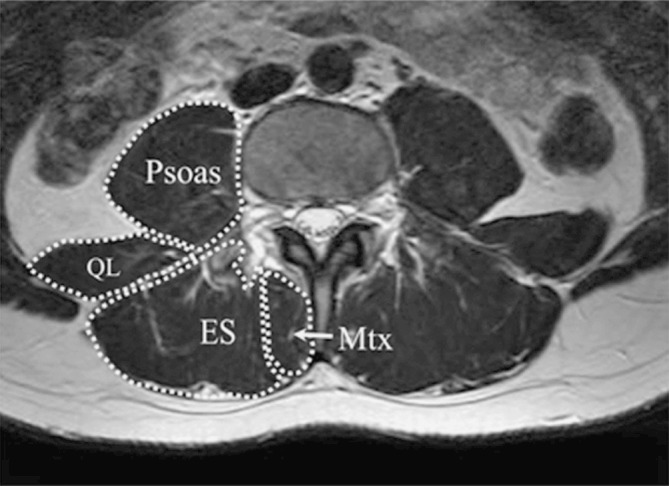
Example ROI used for calculating the CSA of the psoas, quadratus lumborum (QL), erector spinae (ES—combined iliocostalis and longissimus) and lumbar multifidus (Mtx) muscles on an L3 axial MR image
Determination of the grey scale range for the MR signal intensity of lean paraspinal muscle
In this part of the investigation, two methods of determining the grey scale range for the MR signal intensity of lean paraspinal muscle were compared. The aim was to determine the preferred method of identifying the grey scale range for the MR signal intensity of lean muscle in order to calculate the FCSA of the paraspinal muscles. This method should be reliable, accurate and relatively time efficient.
The first method (Method 1) involved determining the grey scale range for the MR signal intensity of lean paraspinal muscle across the entire set of MR scans used in this study. This was based on manual segmentation of the three most prevalent homogenous tissue types within the field of view of the scan—the vertebral body bone, the paraspinal muscle and the intermuscular fat. In order to differentiate the lean paraspinal muscle from the other tissues likely to be present within the field of view of the scans, the largest possible region of interest (ROI) of homogenous bone within the vertebral body, lean paraspinal muscle and intermuscular fat, on each scan slice was manually identified in six subjects i.e. a total of 42 samples per tissue type were analysed (Fig. 3). The resulting grey scale values for the three tissue types were then normalised to the total number of pixels analysed to allow direct comparison of tissue type. From this data, grey scale ranges for the MR signal intensity of three tissue types, across the entire set of scan, were determined.
Fig. 3.

Example ROI used for the calculation of discrete (Method 1) and slice-specific (Method 2) grey scale ranges for bone, muscle and fat from an L3 axial T2 MR scan
Due to the nature of MR it is possible that the signal intensity, and hence grey scale range, for the same tissue type can vary from subject to subject, from scan level to scan level and even within the same scan slice. Therefore, in the second part of this section of the study, a second sampling method for determining a grey scale range for the MR signal intensity of lean paraspinal muscle was investigated.
The second method (Method 2) involved determining a grey scale range for the MR signal intensity of lean muscle that was specific to each scan slice. These slice-specific grey scale ranges were determined from the ROI that were considered to be the largest area of homogenous muscle within the combined bulk of all the paraspinal muscles visible on each scan slice (Fig. 3).
Method reliability
The same observer measured CSA and FCSA three times for each muscle, on each scan slice, for each subject, in random order. FCSA measurements were calculated by thresholding the CSA to include only pixels that were within the grey scale range for lean muscle tissue previously determined using Method 1 above. A mean of the three CSA and FCSA measurements for each paraspinal muscle examined was taken for further analysis.
Sensitivity analysis
To determine the error in obtaining FCSA measurements using a discrete grey scale range which was generated from the analysis of MR signal intensity found from Method 1, a sensitivity analysis was undertaken. As described later in the results section, the resulting discrete grey scale range for the MR signal intensity of lean paraspinal muscle was found to be 0–120 for this set of scans. Therefore, FCSA measurements obtained using this discrete grey scale range were termed FCSA120.
Following evaluation of the methods in the first part of the study, it was deemed that the slice-specific grey scale ranges for muscle (Method 2) were likely to produce the most accurate FCSA measurements. Therefore, further FCSA measurements were obtained using these slice-specific grey scale ranges. To enable an analysis of the degree of error in the FCSA120 measurements caused by using a discrete grey scale range rather than a slice-specific grey scale range for muscle, further FCSA measurements were calculated using the grey scale ranges 0–60, 0–80, 0–100, 0–140 and 0–160. These measurements were then expressed as a percentage of the FCSA measurements obtained using the slice-specific grey scale range for lean muscle (Method 2).
Statistical analysis
Intra class correlation coefficient (ICC) values for the three trials for CSA and FCSA120 for each muscle of interest were calculated using SPSS V10.0. The absolute standard error of measurement (SEM) and the relative SEM (%SEM) [28], for the three trials of CSA and FCSA120 measurements, were calculated from the ICC as follows:
 |
Where, SX was the pooled standard deviation. The %SEM was then calculated by the following:-
 |
Where, Xmean was the pooled mean of the three measurements.
Results
Determination of the grey scale range for the MR signal intensity of lean paraspinal muscle
The grey scale ranges for the combined samples of bone, lean paraspinal muscle, and inter-muscular fat from each of the 42 scan slices obtained using Method 1 are shown in Fig. 4. The overlap of the upper portion of the grey scale range for muscle and the lower portion of the grey scale range for fat on this set of scans spanned from 53 to 160 on the grey scale. However, the amount of pixels representing fat in this overlapping area of the curves was relatively small up to 120 on the grey scale—at which point the number of pixels representing muscle became small as those representing fat began to rise. Therefore, the grey scale range for lean paraspinal muscle for the entire set of scans, across the six subjects, was determined to be 0–120. Similarly, the grey scale range for bone on this set of scans was determined to be 10–255 and the grey scale range for fat was determined to be 74–660. Table 1 shows the slice-specific grey scale ranges for muscle for each subject determined using Method 2.
Fig. 4.

Grey scale values for the MR signal intensity of bone, lean paraspinal muscle and fat across the entire set of scans
Table 1.
Slice-specific grey scale ranges for lean paraspinal muscle
| Spinal level | Subject | |||||
|---|---|---|---|---|---|---|
| 1 | 2 | 3 | 4 | 5 | 6 | |
| L1 | 1–103 | 1–128 | 2–104 | 5–130 | 1–123 | 3–132 |
| L2 | 3–115 | 7–138 | 3–124 | 3–124 | 5–139 | 4–144 |
| L3 | 5–151 | 2–154 | 5–142 | 6–138 | 5–134 | 5–159 |
| L4 | 7–138 | 6–149 | 3–132 | 8–131 | 4–135 | 1–125 |
| L5 upper | 9–112 | 5–137 | 5–135 | 4–126 | 6–134 | 6–124 |
| L5 lower | 8–116 | 6–140 | 6–108 | 12–121 | 5–151 | 6–116 |
| S1 | 5–126 | 19–101 | 17–101 | 12–109 | 18–161 | 16–131 |
Technique reliability
Intra class correlation coefficient and %SEM values for the mean CSA and FCSA120 for each muscle of interest are summarised in Tables 2, 3 respectively. Both CSA and FCSA120 showed excellent reliability in both indices, CSA ICC (mean=0.96, range 0.89–0.99), %SEM (mean=3.1%, range 1.0–4.9%) and FCSA120 ICC (mean=0.97, range 0.90–0.99), %SEM (mean=2.6%, range 0.7–4.8%). There was a significant correlation (r=−0.72, P<0.05) between mean FCSA120 and %SEM indicating that muscles with a lower FCSA120 had a higher %SEM. The L4 multifidus was the most notable exception to this trend, as it showed a relatively large FCSA120 and a relatively large %SEM.
Table 2.
The ICC and percentage standard error of measurement (%SEM) for the CSA of the lumbar paraspinal muscles
| Spinal level | Psoas | Quadratus lumborum | Erector spinae | Multifidus | ||||||||||||||||
|---|---|---|---|---|---|---|---|---|---|---|---|---|---|---|---|---|---|---|---|---|
| L CSA | R CSA | Mean CSA | ICC | %SEM | L CSA | R CSA | Mean CSA | ICC | %SEM | L CSA | R CSA | Mean CSA | ICC | %SEM | L CSA | R CSA | Mean CSA | ICC | %SEM | |
| L1 | 4.00 | 3.50 | 3.75 | 0.89 | 4.81 | 3.61 | 3.78 | 3.69 | 0.95 | 4.95 | 23.58 | 22.38 | 22.98 | 0.91 | 2.78 | 3.44 | 3.49 | 3.47 | 0.90 | 4.66 |
| L2 | 9.75 | 9.17 | 9.46 | 0.96 | 2.00 | 5.43 | 5.90 | 5.68 | 0.93 | 4.73 | 23.35 | 24.19 | 23.77 | 0.98 | 1.73 | 4.97 | 5.21 | 5.09 | 0.95 | 4.37 |
| L3 | 16.26 | 16.88 | 16.57 | 0.97 | 1.78 | 6.94 | 7.06 | 7.06 | 0.97 | 3.96 | 19.89 | 22.53 | 21.21 | 0.99 | 2.15 | 9.62 | 9.58 | 9.60 | 0.97 | 3.61 |
| L4 | 24.11 | 24.08 | 24.10 | 0.98 | 1.55 | 8.25 | 9.22 | 8.63 | 0.95 | 3.41 | 17.53 | 18.07 | 17.80 | 0.97 | 3.45 | 13.74 | 14.17 | 13.95 | 0.90 | 4.83 |
| L5 upper | 25.84 | 26.09 | 25.96 | 0.99 | 1.31 | a | a | a | a | a | 14.97 | 16.27 | 15.62 | 0.96 | 1.19 | 12.10 | 12.12 | 12.11 | 0.98 | 1.08 |
| L5 lower | 24.79 | 24.02 | 24.41 | 0.99 | 1.10 | a | a | a | a | a | 11.27 | 14.13 | 12.70 | 0.99 | 2.97 | 14.24 | 13.63 | 13.94 | 0.97 | 3.34 |
| S1 | a | a | a | a | a | a | a | a | a | a | 8.53 | 8.24 | 8.38 | 0.99 | 3.99 | 14.49 | 13.80 | 14.14 | 0.99 | 3.01 |
| Mean | 17.46 | 17.29 | 17.37 | 0.96 | 2.09 | 6.06 | 6.49 | 6.26 | 0.95 | 4.26 | 17.02 | 17.97 | 17.50 | 0.97 | 2.61 | 10.37 | 10.29 | 10.33 | 0.95 | 3.56 |
aNo measurement taken at these levels
Table 3.
The ICC and percentage standard error of measurement (%SEM) for the FCSA of the lumbar paraspinal muscles
| Spinal level | Psoas | Quadratus lumborum | Erector spinae | Multifidus | ||||||||||||||||
|---|---|---|---|---|---|---|---|---|---|---|---|---|---|---|---|---|---|---|---|---|
| L FCSA | R FCSA | Mean FCSA | ICC | %SEM | L FCSA | R FCSA | Mean FCSA | ICC | %SEM | L FCSA | R FCSA | Mean FCSA | ICC | %SEM | L FCSA | R FCSA | Mean FCSA | ICC | %SEM | |
| L1 | 3.98 | 3.49 | 3.73 | 0.90 | 4.75 | 3.43 | 3.83 | 3.63 | 0.96 | 4.75 | 22.57 | 21.70 | 22.13 | 0.95 | 2.31 | 3.24 | 3.36 | 3.30 | 0.95 | 3.51 |
| L2 | 9.57 | 9.01 | 9.29 | 0.98 | 1.45 | 5.42 | 5.58 | 5.50 | 0.96 | 3.70 | 21.60 | 22.87 | 22.23 | 0.99 | 1.38 | 4.55 | 4.77 | 4.66 | 0.97 | 3.55 |
| L3 | 15.85 | 16.36 | 16.10 | 0.99 | 1.34 | 6.34 | 7.26 | 6.80 | 0.98 | 3.00 | 18.47 | 20.56 | 19.52 | 0.99 | 1.87 | 8.58 | 8.53 | 8.55 | 0.98 | 3.31 |
| L4 | 23.64 | 23.49 | 23.56 | 0.99 | 1.26 | 8.02 | 8.85 | 8.43 | 0.97 | 2.78 | 15.99 | 16.85 | 16.42 | 0.99 | 2.21 | 12.61 | 12.87 | 12.74 | 0.94 | 4.80 |
| L5 upper | 26.20 | 25.04 | 25.62 | 0.99 | 1.05 | a | a | a | a | a | 13.46 | 14.83 | 14.14 | 0.99 | 0.72 | 11.57 | 11.48 | 11.52 | 0.99 | 0.90 |
| L5 lower | 25.74 | 25.01 | 25.38 | 0.99 | 1.23 | a | a | a | a | a | 9.40 | 12.17 | 10.79 | 0.99 | 2.33 | 13.42 | 12.35 | 12.88 | 0.99 | 2.84 |
| S1 | a | a | a | a | a | a | a | a | a | a | 6.58 | 6.47 | 6.52 | 0.99 | 3.28 | 13.03 | 12.47 | 12.75 | 0.99 | 2.33 |
| Mean | 17.49 | 17.07 | 17.28 | 0.97 | 1.85 | 5.80 | 6.38 | 6.09 | 0.97 | 3.56 | 15.44 | 16.49 | 15.97 | 0.98 | 2.01 | 9.57 | 9.40 | 9.49 | 0.97 | 3.03 |
aNo measurement taken at these levels
Sensitivity analysis
The mean FCSA determined using the discrete grey scale ranges of, 0–60, 0–80, 0–100, 0–120, 0–140 and 0–160 as a percentage of the FCSA determined using the slice-specific grey scale range are presented in Fig. 5. From this figure it can be seen that muscle FCSA determined using the 0–100, 0–120 and 0–140 discrete grey scale ranges were respectively, 95%, 99% and 101%, of the FCSA determined using the slice-specific grey scale range. This indicates that an error of 20 grey scale units at the upper end of the muscle’s grey scale range would result in a very small error in the measured muscle FCSA. Conversely, if the upper limit of the muscle grey scale range was set below the 100 value, the potential for error in determining the muscle FCSA from this set of scans, would be far larger.
Fig. 5.

Functional cross-sectional area measurements determined using the discrete grey scale ranges of, 0–60, 0–80, 0–100, 0–120, 0–140 and 0–160 as a percentage of the FCSA measurements determined using the slice-specific grey scale range for muscle
Discussion
Determination of the grey scale range for the MR signal intensity of lean paraspinal muscle
Segmentation (or tissue classification) has been a complex area in automated quantitative MR imaging applications due to problems such as heterogeneous signal intensities in tissues and the partial volume effect [1, 10, 14, 26]. The overlap of the grey scale range for the MR signal intensity of the bone, muscle and fat samples, as shown in Fig. 4, can be attributed to a variety of factors. Although care was taken to exclude large areas of tissue other than muscle and fat from the respective sample ROI (Fig. 3), the muscle samples would almost certainly have contained areas of other tissue such as intramuscular fat, fibrous and nervous tissue, whilst fat samples would have also contained small areas of tissue such as blood vessels and nervous tissue. This, combined with the partial volume effect i.e. “the presence of pixels containing more than one tissue type whose grey scale value is the average of the included tissues”, may help to explain the small degree of overlap of the grey scale ranges for muscle and fat. The considerable overlap between the grey scale range for muscle and vertebral body bone should not influence the paraspinal muscle CSA and FCSA, as careful outlining of the fascial boundaries of the paraspinal muscles should ensure that no bony tissue is included in the ROI used to obtain these measurements.
In an attempt to find the preferred and most reliable method of obtaining FCSA measurements of the paraspinal muscles, two methods of determining a grey scale range for the signal intensity of lumbar paraspinal muscle, on axial T2 weighted MR scans, were investigated. Method 1 produced a discrete grey scale range for lean paraspinal muscle (0–120) that was applicable to the imaging set used in this study.
The results displayed in Fig. 5 indicated that when using a discrete grey scale range, an error of 20 units at the upper end of lean muscle’s grey scale range would result in a very small error in the measured muscle FCSA. Conversely, for this set of scans, if the upper limit of the muscle grey scale range is set below the 100 value the potential for error in determining the muscle FCSA would be far larger. Using a discrete grey scale range for muscle has the advantage of markedly reducing data processing time, as once the discrete muscle grey scale range is established, it is a simple process to apply it to the muscle CSA measurements in order to determine muscle FCSA.
The disadvantage of using a discrete grey scale range for muscle, in this case 0–120, is that the nature of MR means this grey scale range is unlikely to be precise for each muscle at every spinal level. This is because when using MR, even homogenous tissue types will have variable signal intensity within the same scan, within sets of scans for the same subject and within subjects [34]. However, the results of this study indicate that the method the authors have used to determine a discrete grey scale range for muscle will produce only small variations in the muscle FCSA if the muscle grey scale range is slightly over-estimated or under-estimated. It should be noted that discrete grey scale ranges can probably only be used for this type of analysis with sets of scans obtained using identical MR protocols, systems and parameters. If there is a large scan to scan variability in MR signal intensity of homogenous tissue types, then grey scale ranges for each tissue type should be determined for each scan slice, as per Method 2.
Technique reliability
The high ICC and low %SEM values relating to repeated measurement of CSA and FCSA clearly show that the technique described in this paper for examining the intramuscular morphology of the selected lumbar paraspinal muscles was highly reliable. The results of this study compare favourably with those of Marras et al. [22] and Daneels et al. [5] who also found low variability of repeated CSA measurements of similar groups of trunk muscles as seen on MR and CT scans respectively.
The significant negative correlation between mean FCSA and %SEM was probably due to a greater proportion of partial volume pixels at the smaller muscles’ periphery being included in the FCSA. A slight difference in the outline of the CSA of the smaller muscles might therefore result in a relatively greater difference in muscle FCSA. The L4 multifidus was the most notable exception to this trend, as it has a relatively large FCSA and a relatively large %SEM. The fascial boundary between multifidus and the erector spinae was sometimes difficult to distinguish, particularly at the L4 level and this might explain the relatively high %SEM for the L4 multifidus.
The use of radiological techniques combined with image processing software to measure the CSA of muscles of the trunk is becoming increasingly prevalent in research pertaining to abnormalities in muscle morphology in LBP patients [6, 7, 11, 16, 18, 19, 31] and those interested in developing biomechanical models of the trunk [9, 22, 24]. The results of this study indicate that the methods described above to perform CSA measurements are highly reliable, especially when FCSA measurements are being made. This technique should facilitate further functional studies relating paraspinal muscle bulk and atrophy with symptoms and clinical outcomes in patients with LBP.
Method application
Addressing identified asymmetries in the morphology [5, 13] and deficits in function [15] of certain lumbar muscles has become a popular component of LBP rehabilitation programs [6, 12, 18, 29]. Recent developments in MR technology allow high-resolution images of muscles of the lumbar paraspinal muscles to be obtained without entailing the risks associated with exposure to ionising radiation [38]. MR imaging has advantages over US imaging and CT in that MR allows better lean muscle to fat discrimination. Also, MR allows greater precision of repeat imaging over US, as easily identifiable landmarks can be used to position the scan slices. MR therefore, appears to be an ideal imaging modality for assessing the intramuscular morphology of the lumbar paraspinal muscles. The method described in this paper would provide a valuable tool for assessing the efficacy of LBP rehabilitation programs.
A further application of determining muscle CSA area is in the area of musculoskeletal modelling. Accurate measurement of muscle CSA is important as anatomically detailed biomechanical models of the spine routinely use CSA measurements of the surrounding musculature to estimate the variables related to injury. These variables include force production estimates of the lumbar paraspinal muscles and the associated compressive and shear force on structures such as the intervertebral discs and the pars interarticularii [9, 24, 25, 37]. Historically, much of the data pertaining to the geometry and morphology of spinal muscles for use in these models has been derived from cadaveric specimens [32, 33]. However, factors such as these subjects’ age, level of physical activity, race, sex and method of cadaveric preservation, may limit the application of such data within biomechanical models pertaining to populations such as healthy young athletes [33]. Also, in biomechanical models, a mathematical expression that relates muscle CSA and isometric force production is used. The relationship is typically expressed as Force = K × physiological CSA, where K is a constant that is approximately 30 N/cm2 [9, 17, 20]. A major assumption of this relationship is that the entire CSA consists of contractile tissue. There is evidence to suggest that paraspinal muscle atrophy with fat infiltration is associated with low back injury [16, 31]. This could result in muscle CSA being maintained but with the percentage of contractile tissue within that CSA being markedly reduced. Also, in subjects without LBP, the lower lumbar multifidi have been shown to have a greater amount of fat within the fascial boundaries compared to the upper lumbar multifidi [31]. Therefore, functionally correct biomechanical models should utilise FCSA measurements obtained via a method such as that presented in this study.
This method of obtaining paraspinal muscle CSA and FCSA could also have application in the determination of segmental inertial parameters of the trunk, head and neck [3, 32]. A method to determine the correct grey scale range for the MR signals emitted by various body tissues would increase the accuracy of these measurements.
A “gold standard” MR tissue segmentation method is currently not available. Therefore, a direct estimate of the validity of the methods used in this paper is impossible. Harris et al. [10] and Hoad and Martel [14] stated that the manual methods of tissue classification were indeed the “gold standard” and in some automated applications, ROI of homogenous tissue are outlined in order to “train” the automated method [10, 26]. The manual tissue segmentation techniques described in this paper were time consuming and somewhat subjective. The development of accurate and efficient automated tissue segmentation for MR images of skeletal muscle would greatly aid research of the relationship between lumbar muscle morphology, function and pain.
Conclusions
It can be concluded within the limitations of this study that the method to determine muscle FCSA is both valid and highly reliable. The method of obtaining muscle CSA was highly reliable and the reliability indices were improved when FCSA was determined. Even if the upper limit of the grey scale range for the MR signal intensity of muscle is under-estimated or over-estimated, the effect on the muscle FCSA measurements was small. Further, the error in using a discrete grey scale range for MR signal intensity of lean paraspinal muscle was quantified. This method presented in this paper has several applications namely, evidence based LBP rehabilitation, biomechanical modelling and determination of segmental inertial parameters.
Footnotes
Research carried out at Edith Cowan University, Western Australia and the University of Nottingham, UK. The experiments comply with the current laws of the country in which they were performed in and ethical approval for the study was granted by the Local and Regional ethics committees of Edith Cowan University, Western Australia and the University of Nottingham, UK.
References
- 1.Barra V, Boire J-Y. Segmentation of fat and muscle from MR images of the thigh by a possible clustering algorithm. Comput Methods Programs Biomed. 2002;68:185–193. doi: 10.1016/S0169-2607(01)00172-9. [DOI] [PubMed] [Google Scholar]
- 2.Boos N, Boesch C. Quantitative magnetic resonance imaging of the lumbar spine. Potential for investigations of water content and biochemical composition. Spine. 1995;20:2358–2365. [PubMed] [Google Scholar]
- 3.Cheng CK, Chen HH, Chen CS, Lee CL, Chen CY. Segment inertial properties of Chinese adults determined from magnetic resonance imaging. Clin Biomech. 2000;15:559–566. doi: 10.1016/S0268-0033(00)00016-4. [DOI] [PubMed] [Google Scholar]
- 4.Dangaria T, Naesh O. Changes in cross-sectional area of psoas major muscle in unilateral sciatica caused by disc herniation. Spine. 1998;23:928–931. doi: 10.1097/00007632-199804150-00016. [DOI] [PubMed] [Google Scholar]
- 5.Danneels L, Vanderstraeten G, Cambier D. Computed tomography imaging of trunk muscles in chronic low back pain patients and healthy control subjects. Eur Spine J. 2000;9:266–272. doi: 10.1007/s005860000190. [DOI] [PMC free article] [PubMed] [Google Scholar]
- 6.Danneels L, Vanderstraeten G, Cambier D, Witvrouw E, Bourgois J, Dankaerts W, De Cuyper H. Effects of three different training modalities on the cross sectional area of the lumbar multifidus muscle in patients with chronic low back pain. Br J Sports Med. 2001;35:186–191. doi: 10.1136/bjsm.35.3.186. [DOI] [PMC free article] [PubMed] [Google Scholar]
- 7.Davey P, Eardley C, Elliot S, Torkelson A, Rabey M (2000) A quantitative analysis of lumbar multifidus in subjects with chronic lumbar segmental instability. Unpublished Masters of Science Thesis. Curtin University of Technology. Perth, Australia
- 8.Engstrom Quadratus lumborum asymmetry and pars interarticularis injury in cricket fast. 2000;bowlers:a. [Google Scholar]
- 9.Gatton M, Pearcy M, Pettet G. Difficulties in estimating muscle forces from muscle cross-sectional area. An example using the psoas major muscle. Spine. 1999;24:1487–1493. doi: 10.1097/00007632-199907150-00016. [DOI] [PubMed] [Google Scholar]
- 10.Harris G, Andreasen NC, Cizaldo T, Bailey JM, Bockholt J, Magnotta VA, Arndt S. Improving tissue classification in MRI: a three-dimensional multispectral analysis method with automated training class selection. J Comput Assist Tomogr. 1999;23:144–154. doi: 10.1097/00004728-199901000-00030. [DOI] [PubMed] [Google Scholar]
- 11.Hides JA, Richardson C, Jull GA. Magnetic resonance imaging and ultrasonography of the lumbar multifidus muscle: comparison of two different modalities. Spine. 1995;20:54–58. doi: 10.1097/00007632-199501000-00010. [DOI] [PubMed] [Google Scholar]
- 12.Hides JA, Richardson C, Jull GA. Multifidus muscle recovery is not automatic after resolution of acute, first episode, low back pain. Spine. 1996;21:2763–2769. doi: 10.1097/00007632-199612010-00011. [DOI] [PubMed] [Google Scholar]
- 13.Hides JA, Stokes MJ, Saide M, Jull GA, Cooper DH. Evidence of lumbar muscle wasting ipsilateral to symptoms in patients with acute/subacute low back pain. Spine. 1994;19:165–172. doi: 10.1097/00007632-199401001-00009. [DOI] [PubMed] [Google Scholar]
- 14.Hoad CL, Martel AL. Segmentation of MR images for computer-assisted surgery of the lumbar spine. Phys Med Biol. 2002;47:3505–3517. doi: 10.1088/0031-9155/47/19/305. [DOI] [PubMed] [Google Scholar]
- 15.Hodges P, Richardson C. Contraction of the abdominal muscles associated with movement of the lower limb. Phys Ther. 1997;77:132–144. doi: 10.1093/ptj/77.2.132. [DOI] [PubMed] [Google Scholar]
- 16.Kader DF, Wardlaw D, Smith FW. Correlation between the MRI changes in the lumbar multifidus muscles and leg pain. Clin Radiol. 2000;55:145–149. doi: 10.1053/crad.1999.0340. [DOI] [PubMed] [Google Scholar]
- 17.Kamibayashi LKR, Richmond FJR. Morphometry of the human neck muscles. Spine. 1998;23:1314–1323. doi: 10.1097/00007632-199806150-00005. [DOI] [PubMed] [Google Scholar]
- 18.Kaser L, Mannion A, Rhyner A, Weber E, Dvorak J, Muntener M. Active therapy for chronic low back pain. Spine. 2001;26:909–919. doi: 10.1097/00007632-200104150-00014. [DOI] [PubMed] [Google Scholar]
- 19.Keller A, Brox JI, Gunderson R, Holm I, Friis A, Reikerås O. Trunk muscle strength, cross-sectional area, and density in patients with chronic low back pain randomized to lumbar fusion or cognitive intervention and exercises. Spine. 2004;29:3–8. doi: 10.1097/01.BRS.0000103946.26548.EB. [DOI] [PubMed] [Google Scholar]
- 20.Lieber RL, Friden J. Functional and clinical significance of skeletal muscle architecture. Muscle Nerve. 2000;23:1647–1666. doi: 10.1002/1097-4598(200011)23:11<1647::AID-MUS1>3.0.CO;2-M. [DOI] [PubMed] [Google Scholar]
- 21.Mannion AF, Kaser L, Weber E, Rhyner A, Dvorak J, Muntener M. Influence of age and duration of symptoms on fibre type distribution and size of the back muscles in chronic low back pain patients. Eur Spine J. 2000;9:273–281. doi: 10.1007/s005860000189. [DOI] [PMC free article] [PubMed] [Google Scholar]
- 22.Marras WS, Jorgensen MJ, Granata KP, Wiand B. Female and male trunk geometry: size and prediction of the spine loading trunk muscles derived from MRI. Clin Biomech. 2001;16:38–46. doi: 10.1016/S0268-0033(00)00046-2. [DOI] [PubMed] [Google Scholar]
- 23.Martin PE, Mungiole M, Marzke MW, Longhill JM. The use of magnetic resonance imaging for measuring segment inertial properties. J Biomech. 1989;22:367–376. doi: 10.1016/0021-9290(89)90051-1. [DOI] [PubMed] [Google Scholar]
- 24.McGill S, Santaguida L, Stevens J. Measurement of the trunk musculature from T5 to L5 using MRI scans of 15 young males corrected for muscle fibre orientation. Clin Biomech. 1993;8:171–178. doi: 10.1016/0268-0033(93)90011-6. [DOI] [PubMed] [Google Scholar]
- 25.McGill SM, Norman RW. Effects of an anatomically detailed erector spinae model on L4/L5 disc compression and shear. J Biomech. 1986;20:591–600. doi: 10.1016/0021-9290(87)90280-6. [DOI] [PubMed] [Google Scholar]
- 26.Meier DS, Guttmann CRG. Time-series analysis of MRI intensity patterns in multiple sclerosis. Neuroimage. 2003;20:1193–1209. doi: 10.1016/S1053-8119(03)00354-9. [DOI] [PubMed] [Google Scholar]
- 27.Mitsiopolous N, Baumgartner RN, Heymsfield SB, Lyons W, Gallagher D, Ross R. Cadaver validation of skeletal muscle measurement by magnetic resonance imaging and computerized tomography. J Appl Physiol. 1999;85:115–122. doi: 10.1152/jappl.1998.85.1.115. [DOI] [PubMed] [Google Scholar]
- 28.Norton K, Marfell-Jones M, Whittingham N, Kerr D, Carter L, Saddington K, Gore C. Anthropometric assessment protocols. In: Gore C, editor. Physiological tests for elite athletes. Lower Mitcham: Human Kinetics; 2000. pp. 66–85. [Google Scholar]
- 29.O’Sullivan P. Lumbar segmental ‘instability’: clinical presentation and specific stabilizing exercise management. Man Ther. 2000;5:2–12. doi: 10.1054/math.1999.0213. [DOI] [PubMed] [Google Scholar]
- 30.Panjabi M. The stabilizing system of the spine. Part 1 and Part 2. J Spinal Disord. 1992;5:390–397. doi: 10.1097/00002517-199212000-00002. [DOI] [PubMed] [Google Scholar]
- 31.Parkkola R, Rytokoski U, Kormano M. Magnetic resonance imaging of the discs and trunk muscles in patients with chronic low back pain and healthy control subjects. Spine. 1993;18:830–836. doi: 10.1097/00007632-199306000-00004. [DOI] [PubMed] [Google Scholar]
- 32.Pearsall DJ, Reid JG, Ross R. Inertial properties of the human trunk of males determined from magnetic resonance imaging. Ann Biomed Eng. 1994;22:692–706. doi: 10.1007/BF02368294. [DOI] [PubMed] [Google Scholar]
- 33.Reid JG, Jensen RK. Human body segment inertia parameters: a survey and status report. Exerc Sport Sci Rev. 1990;18:225–241. [PubMed] [Google Scholar]
- 34.Rinck PE. Magnetic resonance in medicine. Oxford: Blackwell; 1993. [Google Scholar]
- 35.Sebastian TB, Huseyin T, Crisco JJ, Kimia BB. Segmentation of carpal bones from CT images using skeletally coupled deformable models. Med Image Anal. 2003;7:21–45. doi: 10.1016/S1361-8415(02)00065-8. [DOI] [PubMed] [Google Scholar]
- 36.Storheim K, Holm I, Gunderson R, Brox JI, Bo K. The effect of comprehensive group training on cross sectional area, density and strength of paraspinal muscles in patients sick listed for subacute low back pain. J Spinal Disord Tech. 2003;16:271–279. doi: 10.1097/00024720-200306000-00008. [DOI] [PubMed] [Google Scholar]
- 37.Vasavada AN, Li S, Delp S. Influence of muscle morphometry and moment arm on the moment generating capacity of human neck muscle. Spine. 1998;23:412–422. doi: 10.1097/00007632-199802150-00002. [DOI] [PubMed] [Google Scholar]
- 38.Westbrook C, Kaut C. MRI in practice. Oxford: Blackwell; 1998. [Google Scholar]
- 39.Wilke H, Wolf S, Claes L, Arand M, Weisend A. A stability increase of the lumbar spine with different muscle groups: a biomechanical in vitro study. Spine. 1995;20:192–198. doi: 10.1097/00007632-199501150-00011. [DOI] [PubMed] [Google Scholar]