Abstract
The debate is to which extent external skin markers represent true underlying vertebral position and motion. Skin markers and lumbar vertebrae L3 and L4 were examined by vertically open magnetic resonance imaging (MRI) within different postures to investigate whether, and to which extent the position and orientation of skin markers represent the corresponding information of assigned underlying vertebra. Nine healthy volunteers sat within an open MRI scanner in five different seating postures: upright, low flexion, heavy flexion, upright left turn and upright right turn. Skin markers were fixed at lumbar levels L3 and L4. A set of landmarks defines corresponding positions on the vertebrae. Translation-vectors quantify the change of co-ordinates while changing position. Orientation (Cardan-angles) of each level in space was calculated from co-ordinates of three skin-markers and the corresponding vertebral landmarks respectively. The close relation between the position of the individual skin marker and its corresponding landmark on the vertebrae is conserved through all postures (regression coefficients: 0.720<b<0.972, 0.916<r<0.993, p<0.0001). Despite the high sensitivity to measurement errors there is a strong relation between the translation-vectors of external markers and the corresponding translation of the landmark on the vertebrae (0.68<r<0.99, p<0.0001). Within the resolution of the MR-imaging the orientation of the vertebrae can be predicted from the external markers (regression coefficients: 0.936<b<1.189, 0.769<r<0.959, p<0.0001). Positions and motions of skin markers can be taken as a first estimate to calculate the position and spatial orientation of underlying vertebrae. The use of skin markers may help to investigate spinal positions in daily life situations where internal imaging is not possible.
Keywords: Open MRI, Lumbar spine, Skin markers, Soft tissue, Validation
Introduction
The position of vertebrae within a global, laboratory-fixed system of co-ordinates is necessary to estimate spinal loading. The orientation of consecutive vertebrae determines the curvature of the spine, the deformation of the intervertebral discs, load on ligaments, and the behavior of the facet joints. Especially in relevant daily life conditions such as lifting a weight this information can only be extrapolated so far from external observations such as monitoring the position of external skin markers. However, motions of soft tissue covering the spine may lead to large errors. So far, only a few studies investigated the relation between position and motion of skin markers and real bone-motion. Nonexistent validation is claimed to be the main problem of skin-marker-methods [9]. Concerning the human lumbar spine there are different opinions about the relation of skin to vertebrae motion (or position): in static radiological investigations with radiopaque markers mounted over spinal prominences, it was shown that the skin marker positions represent the spinous centroids and curvature quite well [2]. Further, three-dimensional displacement (shift) of skin markers related to positions on the vertebrae from standing to sitting posture measured by bi-planar radiography is small, especially markers mounted over spinous processes represent vertebral position very well [8]. Comparing functional radiographs of lumbar spine with data of skin markers measured from lumbar spinous processes shows high correlations for estimation of lordosis and mobility [4]. In contrast, previous investigations on low-back-pain-patients in similar situations revealed only a weak correlation between the surface curvature obtained from a single row of skin markers and the rotation of the vertebrae monitored radiographically (r=0.58) [19]. Notice that most cited investigations are two-dimensional and look only on single postures; three-dimensional data are rare [8]. Information about the relation of spatial orientation of vertebrae to spatial orientation of a set of skin markers is not available.
Radiological or magnetic resonance imaging (MRI) methods are precise, but have the disadvantage that daily-life activities cannot be measured as the mobility of the patient must be restricted. At present, due to the limited resolution in time and narrow working space in three dimensions, only measurements of selected postures are possible [3, 6, 10, 11, 13–15, 20]. Motion studies of the lumbar spine during flexion were examined two-dimensionally for sagittal plane using fluoroscopy at five images per second [5, 12]. Because of the dose of radiation especially on the gonads, comparable investigations on healthy subjects are ethically critical.
Another way to obtain in vivo data of segmental spinous motion are measurements with bone-pins [1, 7, 18]. These investigations are highly invasive—local anesthesia, and the bone-pins sticking through skin and muscles may influence the physiological movement.
Skin markers might be used to monitor spine movements while seated or while changing posture. In this study, we investigate the validity to infer positions and movements of vertebrae from a set of surface markers in five different seated postures. This was possible by applying vertically open magnetic resonance imaging (MRI) with its less restrictive environment in comparison to conventional MRI. Regressions of positions, translations of co-ordinates and Cardan-angles as well as the relative shift between markers and vertebrae have been deduced.
Materials and methods
Nine healthy male subjects [age: 25.3 years (SD: 2); weight: 77.1 kg (SD: 4.4); height: 180.8 cm (SD: 5.9)] sat in five different postures within the open MRI scanner. The constitution of the subjects can be characterized as sportsman-like, with a low percentage of fat under their skin. Subjects with a history of low back pain and who did not fulfill the requirements for MRI were excluded. All subjects were informed (written consent) following the requirements of the local ethical commission and were volunteers.
Six special MRI-markers, which could be identified within the scanned volume, were attached on the backs of the subjects. The markers were ring-shaped with an outer diameter of 10 mm, an inner diameter of 3 mm, and a height of 3 mm. The markers were applied to mark lumbar vertebrae L3 and L4. The spinous processes of L3 and L4 were palpated in a flexed posture. Markers were affixed: (i) to the spinous processes and (ii) to the prominent elevation of the muscle bellies of m. erector spinae about 3 cm left and right and approximately 3 cm cranial related to the marker on the spinous process (Fig. 1).
Fig. 1.
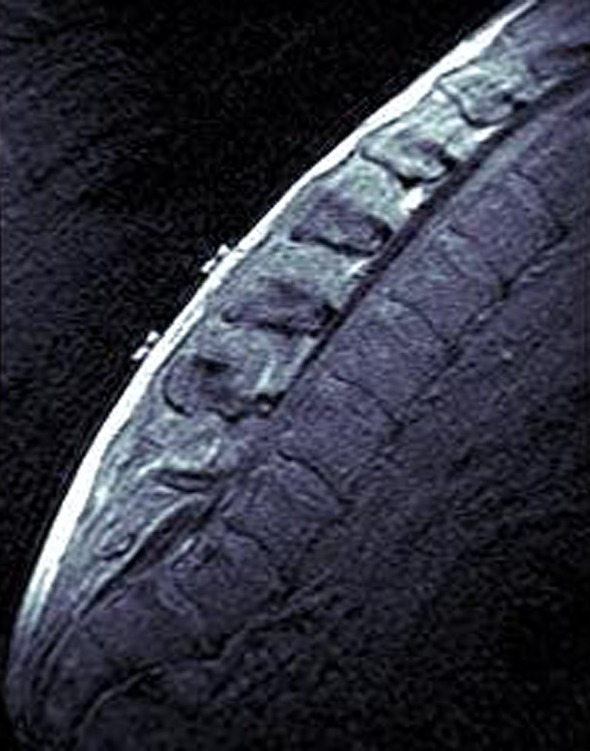
Sagittal slice while flexed seating. On lumbar levels L3 and L4 the skin markers above spinous processes are to see
The seat within the coils of the scanner was placed like described in a previous investigation so the volunteers sat with their lumbar spines within the measurement volume [20]. The subjects had to assume five different postures and were instructed not to move during the scan. Images with movement artifacts were rejected. The five postures were:
Normal seating: hip- and knee-angle approximately 90°, the trunk erect and leaning on the seats back in the thoracic area (from about T6 to T10);
Flexed seating: knee-angle also approximately 90°, elbows resting on the thighs with the upper arms oriented vertically;
Heavy flexed seating: similar to the previous position, except the trunk now bend down to the thighs, hands propped on the feet, so the trunk was in highest flexion as possible;
Rotated seating to the left: with the shoulder turned approximate 90° with respect to the pelvis, hip- and knee-angle approximately 90°, left arm behind the seat’s back;
Rotated seating to the right: same as above, except now the right arm was placed behind the seat’s back so the trunk was in torsion to the right.
The open magnetic resonance imaging scanner Signa SP (General Electric Medical Systems, Milwaukee, WI) was used to measure the subjects’ back. The scanner consists of two vertical superconductive magnets each with a magnetic field force of 2 T, so the Signa SP scanner provides a field strength of 0.5 T between the magnets where the subjects sat. The width between the coils is 58 cm.
Measurements were possible within a cubic volume of approximately 50 cm side length. Concerning the respective posture and using the sagittal 3-D scanning sequence Brain 3D (FGRE 3D, T1 weighted, actually used for brain research) the field of view was set to a cuboid volume of 60 slices with 256×256 pixels (see Table 1 for voxels and cuboid).
Table 1.
Side lengths (mm) of voxel and resulting cuboid of the considered MRI-volume
| Subject | dir: right-left | dir: anterior-posterior | dir: caudal-cranial | |||
|---|---|---|---|---|---|---|
| voxel | volume | voxel | volume | voxel | volume | |
| S1, S8, S9 | 2.0000 | 120 | 1.1719 | 300 | 1.1719 | 300 |
| S2, S3, S4 | 2.5000 | 150 | 1.1719 | 300 | 1.1719 | 300 |
| S5, S6, S7 | 0.9375 | 240 | 0.9375 | 240 | 3.0000 | 180 |
The directions (dir) are anatomically orientated with respect to the subjects (S1,...,S9)
Measuring a single posture of one subject took 3:30 min with this setup. Including pre-adjustment, subjects had to maintain a given posture for 5 min.
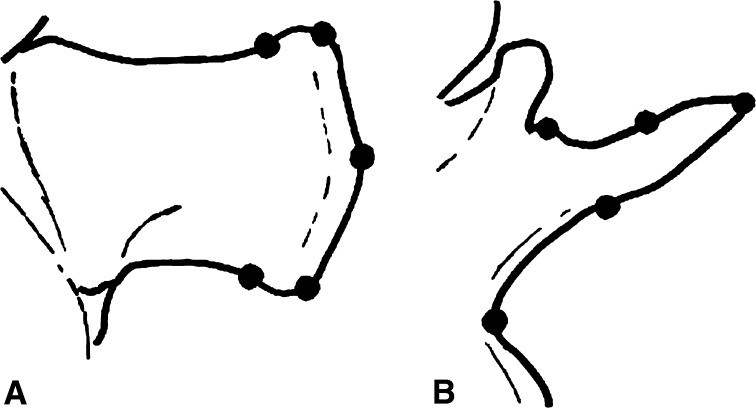
Using the software MRIcro V1.35 (http://www.mricro.com), the 60 slices per measurement were reconstructed to 3-D-volumes. After this, markers, spinous and transverse processes were manually digitized using the Matlab-Toolbox SPM99 (Statistical Parametric Mapping, http://www.fil.ion.ucl.ac.uk). The laboratory-fixed reference point was in the center of the scanner and given by the hardware. Interpolation and averaging can increase the accuracy for visual digitization up to a factor of 10. The skin markers were digitized with one point in the center of the marker. To digitize spinous and transverse processes five landmarks on each process were used (Fig. 2): spinous processes were viewed in sagittal plane. One point was set on the tip of the process, two points on the region with highest curvature of the processes, and two points on the location where the curvature ended. The transverse processes were viewed in transverse plane. One point was the tip of the transverse process, one point was set halfway between the vertebral body and transverse process, and another one halfway between the transverse process and the process of the facet joint. In order to obtain the position of one process, the mean co-ordinate of these five points was estimated. Repeated digitization of the same image by three instructed investigators resulted in an error of 0.9% corresponding to 0.31 voxel (from 0.09 to 0.78 voxel) for the mean co-ordinate.
Fig. 2.
Schematically illustration of a lumbar spinous process (a) and a lumbar transverse process (b) with the five digitized points
The co-ordinates were transformed from voxels to metric units (mm) and to a standard, global Cartesian system of co-ordinates (x-axis: right–left, y-axis: anterior–posterior, z-axis: caudal–cranial in relation to the subject). Further, three-dimensional translation-vectors from one posture to the other were calculated for each process and marker.
Per lumbar level the three mean co-ordinates of spinous and transverse processes and the corresponding set of three skin markers were used to calculate body-fixed systems of co-ordinates for vertebrae and skin surface respectively. The rotation of the body-fixed systems with respect to the lab-fixed co-ordinate system is given by Cardan-angles. They represent a sequence of rotations in our case starting with a rotation about the sagittal axis (flexion), the new frontal axis (lateral bending), and finally about the resulting longitudinal axis (axial rotation). The angles are calculated via co-ordinate transformation [22]. The errors in the Cardan-angles were estimated numerically by assuming an error of the co-ordinates of each marker of one-tenth of the side length of a voxel (compare position error and Table 1) and calculating Cardan-angles using the transformation matrix. It is assumed that the absolute errors induced from each of the nine co-ordinates are superimposed. This procedure results in a measurement error of 3.22° for α (flexion), 3.07° for β (lateral bending) and 2.27° for γ (torsion).
While changing the posture the skin and its markers shift with respect to the corresponding vertebrae, i.e. the vector pointing from the respective process to the marker given in the vertebrae-fixed co-ordinate system should change its components. This change is given as a measure of skin shift. Shifts for the four different postures are represented and statistically tested against zero. Also shifts during the different postures were compared.
To quantify the relationship between external skin markers and the landmarks on the vertebrae regressions were calculated for the positions, the translation-vectors and the Cardan-angles. The quality of the relation was judged by the correlation coefficient and the coefficient of determination. All calculations and statistics were made with Matlab under using library Spacelib (Matlab StatisticsToolbox, The MathWorks, Inc.).
Results
Positions, translation-vectors and spatial orientation of skin markers show a strong linear relation to positions, translation-vectors and spatial orientation of landmarks on the vertebrae. For our sample using simple linear regression equations
 |
the internal positions, translation-vectors or spatial orientation Y are calculable using the external measured or calculated data X and the estimated regression coefficient b and intercept a. Positions and motions of lumbar vertebrae are detectable from markers on skin surface (Table 2).
Table 2.
Linear regression-statistics for calculated parameters for skin markers and assigned landmarks on the vertebrae
| b±(CIb−b) | a±(CIa−a) | r | r2 | |
|---|---|---|---|---|
| Co-ordinates (mm) | ||||
| x | 0.9573±0.0135 | −3.7390±1.3703 | 0.9929 | 0.9858 |
| y | 0.9720±0.0176 | −33.1170±2.2779 | 0.9883 | 0.9768 |
| z | 0.7202±0.0371 | 22.6528±5.5578 | 0.9158 | 0.8388 |
| xSP | 0.9915±0.0184 | −1.5848±1.7573 | 0.9981 | 0.9962 |
| ySP | 0.9856±0.0187 | −13.8877±2.3916 | 0.9980 | 0.9961 |
| zSP | 0.8342±0.0693 | 12.1568±9.2119 | 0.9639 | 0.9291 |
| Translations (mm) | ||||
| xTP3 | 1.1346±0.1418 | −0.5397±2.0250 | 0.8829 | 0.7795 |
| yTP3 | 1.3199±0.0834 | −9.9917±3.3888 | 0.9656 | 0.9325 |
| zTP3 | 0.8217±0.2019 | 17.9868±5.4632 | 0.6912 | 0.4777 |
| xSP3 | 1.0349±0.1106 | −0.9456±1.6458 | 0.9548 | 0.9116 |
| ySP3 | 1.1177±0.0614 | −5.5495±2.3410 | 0.9874 | 0.9750 |
| zSP3 | 0.8962±0.1434 | 7.2980±5.5621 | 0.9063 | 0.8214 |
| xTP4 | 1.0288±0.1271 | −0.8118±1.6608 | 0.8851 | 0.7835 |
| yTP4 | 1.1726±0.1083 | −8.8367±2.9216 | 0.9306 | 0.8661 |
| zTP4 | 0.9101±0.2291 | 20.2703±6.2188 | 0.6824 | 0.4656 |
| xSP4 | 0.9902±0.1354 | −0.5110±1.5417 | 0.9483 | 0.8993 |
| ySP4 | 1.0388±0.0956 | −4.3108±2.4986 | 0.9659 | 0.9330 |
| zSP4 | 0.9724±0.1354 | 5.9943±5.4016 | 0.9266 | 0.8587 |
| Cardan-angles (°) | ||||
| α3 | 0.9509±0.0861 | 63.1626±2.2677 | 0.9593 | 0.9202 |
| γ3 | 1.1886±0.1769 | −0.1019±0.8187 | 0.9001 | 0.8102 |
| α4 | 0.9364±0.1206 | 68.7606±2.9133 | 0.9224 | 0.8509 |
| γ4 | 1.0447±0.2672 | 0.0931±1.1428 | 0.7688 | 0.5911 |
The table shows regression coefficients with 95% confidence intervals (b±(CIb−b)), intercept with 95% confidence intervals (a±(CIa−a)), Pearson’s correlation-coefficients (r) and coefficients of determination (r2) for co-ordinates (x, y, z), co-ordinates of spinous processes (xSP, ySP, zSP), translations on transverse processes and their markers (x,...,zTP3 and x,...,zTP4) and translations on spinous processes and their markers (x,...,zSP3 and x,...,zSP4) and components of Cardan-angles for flexion (α3/4) and torsion (γ3/4) on lumbar levels L3 and L4 on the surface and the vertebrae. All parameters show high correlations (r>0.68), especially co-ordinates of markers on spinous processes are strongly related to the landmarks on the spinous processes (r>0.96). Regression coefficients b for all parameters are near 1 (all statistics are highly significant, p<0.001)
Coherence of co-ordinates
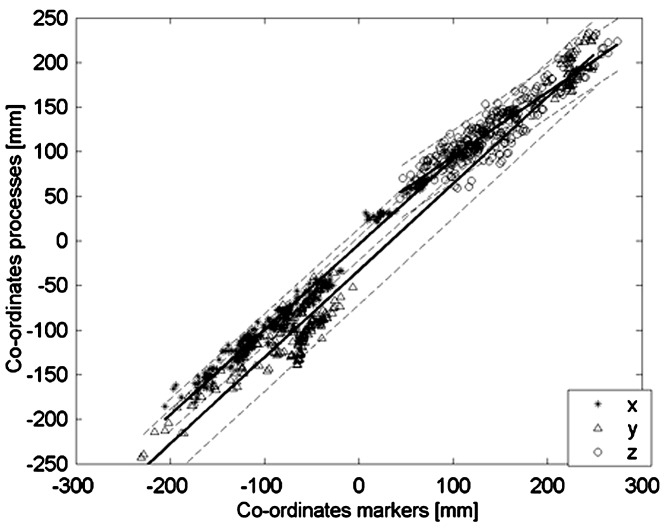
Co-ordinates of skin markers and corresponding landmarks on the vertebrae during the five investigated postures show a linear relationship (regression coefficients and correlations x: b=0.9573, r=0.993; y: b=0.9720, r=0.988; z: b=0.7202, r=0.916; p<0.0001 for all regressions; Fig. 3, Table 2). A different position of the vertebral landmark results in a proportional difference in the position of the skin marker, the regression coefficients b are near 1, this means that co-ordinates of markers on the surface are analogical to those of the assigned landmarks on the vertebrae. Deviations of the regression coefficients b from 1 especially noticeable in the z-component points to systematic deviation from a pure parallel displacement due to rotation of the segments. For slopes close to 1 the intercept a (Table 2) represent the components of the distances between the external markers and vertebral landmark as extrapolated from all measurements. For example, on average the spinous process marker was 13.9±2.4 mm behind the mean landmark of the spinous process. Especially markers on spinous processes represent the position of the landmark on the spinous process very well (r>0.96). The coefficient of determination (r2) for all co-ordinates is above 0.83, for spinous processes above 0.92. So 83% of the co-ordinates were manifested with the regression coefficient (more than 92% for markers on the spinous processes).
Fig. 3.
Relation of co-ordinates of lumbar skin markers and co-ordinates on the vertebral processes during the five observed postures with regression lines (solid) and confidence bounds (95%, dashed). All co-ordinates show strong linear relations (see Table 2)
Coherence of translation
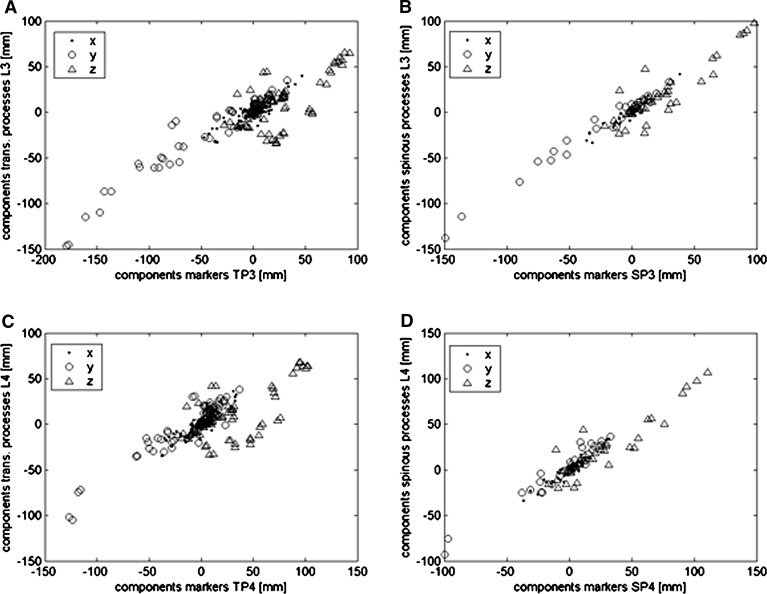
The change in position inflicts similar translations in marker and vertebra position. Again, the components of the vector quantifying this translation are significantly correlated for markers and corresponding processes (r>0.68, p<0.0001; Fig. 4, Table 2). The highest correlations and smallest confidence intervals are found for the vectors from spinous processes and corresponding markers (r>0.91, CIdata<±27.13 mm). The vectors for the transverse processes and their markers show in their x- and y-components correlation coefficients above 0.87, those of the z-component are lower. In general the translation of a vertebra results in a proportional translation of the assigned skin-marker and the regression coefficients b (slopes) are close to 1. As in the co-ordinates the systematic deviations are largely due to rotation of the trunk segment while changing posture an effect which is more pronounced for longer distances between skin markers and spinous process. In this case the intercept (a) to a large extent expresses the amount of average rotation.
Fig. 4.
Translations of landmarks on the vertebrae in dependence of translations of their associated skin marker (L3: A, B; L4: C, D) and the respective processes (transverse (TP): A, C; spinous (SP): B, D). A strong linear relation is observed for all components and all processes and their assigned markers (see Table 2 for regression parameters)
Coherence of spatial orientation
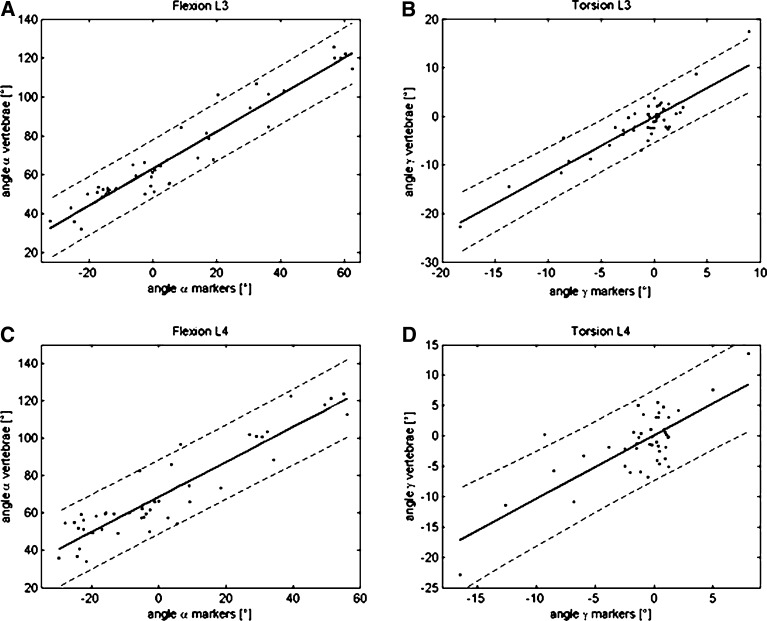
The described marker-configuration was designed to calculate three-dimensionally spatial orientation of a group of skin markers and assigned vertebrae using Cardan-angles (α: flexion, β: lateral bending, γ: axial rotation). The Cardan-angles calculated with a set of three skin-markers and those calculated with the three landmarks of the corresponding vertebrae are significantly correlated (p<0.0001; Fig. 5, Table 2). Taking all data into account the correlations are: level L3 - component α (flexion/extension) r=0.959, component γ (torsion) r=0.8533; level L4 - component α r=0.856, and γ r=0.564. If outliers resulting from digitization errors are removed correlations improve and are highly significant also at level L4 (Fig. 2c, d): L3 α:b=0.9509, r=0.959; L3 γ: b=1.1886, r=0.9; L4 α:b=0.9364, r=0.922; L4 γ:b=1.0447, r=0.769; p<0.0001). From this it can be deduced, that the dorso-ventral orientation of the vertebrae is proportional to that predicted from the skin markers. More than 85% of the data for flexion are predicted by the regression-analysis, for the torsion more than 59% of the data are solid. Again the regression coefficients are nearly 1 so spatial orientation for our sample can reliable measured with markers on the surface.
Fig. 5.
Cardan-angles of lumbar vertebrae in dependence of those obtained from skin markers with regression line, confidence bounds for regression coefficients and confidence bounds for obtained data (levels—L3: A, B; L4: C, D; components—α dorsi flexion/extension: A, C; γ axial rotation: B, D). The strong linear relationship results in regression lines with small confidence bounds. Because of the spatial resolution of the used open MRI, the resulting error in co-ordinates and the resulting error of Cardan-angles depending on nine co-ordinates produce wide confidence bounds of obtained data (see Table 2)
The measurements cover only a small range of lateral flexion angles. The minute lateral flexions observed represent artifacts probably induced by skin shift. For Cardan-angle-component β (lateral flexion) these high correlations could not be found, partially negative correlations are calculated (L4: b=−0.435). As the experimental setup prevented postures with clear lateral flexion most of the lateral rotations are below 7° and thus 56% on lumbar level L3 and 60% on lumbar level L4 are within the expected measurement error (see Materials and methods).
Similarly, relative angles between L3 and L4 are below resolution of the applied MRI-technique and calculation of Cardan-angles, and are not documented.
Shift of soft tissue in relation to lumbar vertebrae
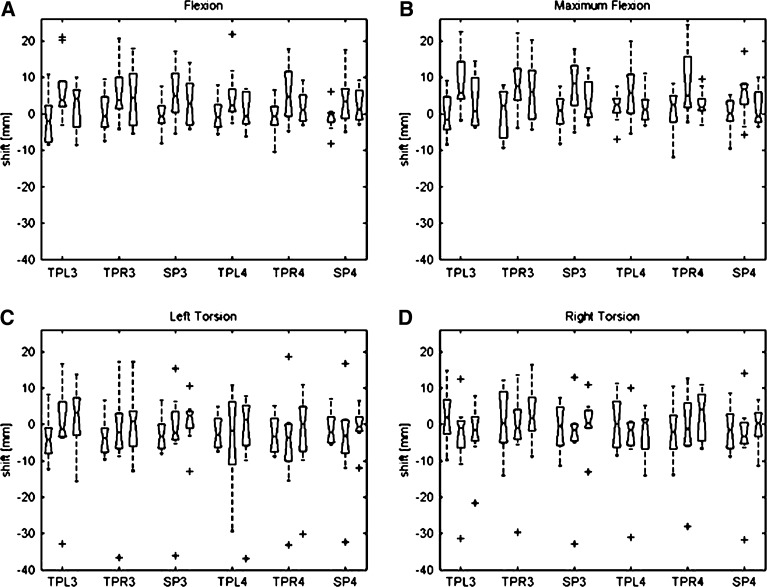
For our sample, the shift of soft tissue in relation to the corresponding landmark on the vertebrae while changing posture can be neglected. During the four investigated postures shift of soft tissue is not significantly different from zero for all components of the shift vector in relation to normal seating (0.06<P<0.99, median skin shift: 0.86 mm, Fig. 6). Particularly markers on spinous processes show lower shifts than markers on muscle bellies, but these differences are also not significant (median skin shift over spinous processes: 0.36 mm). This is due to the fact that the direction the skin shifts is unpredictable and individual. The maximum skin shift to be found within the sample was −36.87 mm for the z-component during torsion to the left about left transverse process L4. This huge value is clearly detected as an outlier. Outliers arose from marker positions on the verge of scanned volume wherein more bias is to expect. Without this outlier the maximum skin shift during this posture about left transverse process L4 for z-component is −9.86 mm. Corresponding to the smaller angles of rotation the shifts of markers in the torsion experiments are closer to zero (0.89<P<0.99). The median marker shift during torsion is greater than the median marker shift of all postures (median skin shift of torsion experiments: −1.76 mm, median skin shift during torsion experiments over spinous processes: −2.02 mm). Differences to flexion and heavy flexion experiments are not significant (Kruskal–Wallis nonparametric one-way Analysis of Variance (ANOVA)).
Fig. 6.
Marker shift during the four investigated postures: flexion (A), maximum flexion (B), left torsion (C) and right torsion (D) in relation to normal seating over left (TPL3/4) and right (TPR3/4) transverse processes and spinous processes (SP3/4) on lumbar levels L3 and L4 for components x, y and z of the shift-vector. Boxplots show median, lower and upper quartiles, rest of the distribution and outliers (+). All data is not significantly different from zero
Discussion
New data supporting linear relation of skin markers to lumbar vertebrae
Three-dimensional co-ordinates, translation-vectors and spatial orientation of markers on the surface of the lumbar back are in close linear relationship to three-dimensional co-ordinates, translation-vectors and spatial orientation of the assigned lumbar vertebrae. In contrast to static 2-D-studies investigating only a single posture, [2] our study adds evidence that this interrelationship is verifiable during different postures. Further the three-dimensional relationship supports former investigations and expands for five different postures [8]. The study documents, within the resolution of modern imaging methods, changes in three-dimensional orientation of vertebrae and corresponding groups of surface markers inflicted by changes of posture. For the dorso-ventral flexion (α) the relation was close to 1, i.e. for the investigated segments the flexion of the external markers are very close to that of the underlying vertebrae. A similar conclusion is possible for torsion (γ). Moreover the shift of soft tissue above investigated landmarks on lumbar vertebrae is quite small and seems to have no effect on posture or motion measurements on the surface. These results are comparable to previous investigations with biplanar X-ray [8]. So, an important step to validate skin-marker-methods in the region of lumbar spine has been made [9], and for healthy subjects the conclusion that positions and motions of skin markers are not sufficiently correlated with positions and motions of the underlying vertebrae must be rejected [19].
Conclusions for lumbar spine motion analysis
It is obvious that the possibility to reliably monitor vertebral movements without going through invasive surgery represents a distinct advantage in investigations of daily activities [1, 7, 18]. For our sample, internal vertebral motions can be derived from information of carefully placed surface skin markers in free situations such as picking up minor loads. It is possible to measure three-dimensional shapes, postures and motions of lumbar vertebrae using skin markers on lumbar back surface with this special marker-application. Especially markers on spinous processes represent vertebral positions and motions very well. Setups with skin markers above spinous processes have been frequently used to monitor spinous movements and positions [4, 9, 17, 19, 21, 23]. So, studies with similar application of skin markers achieve good results.
Notes and limitations
There is to note that positions and motions on the lumbar back surface are not identical to positions and motions on the vertebrae. But knowing the linear relationship the position and motion of lumbar vertebrae are predictable from surface measurements. In some cases (regression coefficient near 1) the change of the position of the markers is analogue to that of the vertebral processes (spinous processes and their markers). For the individuals used in our sample for example the x co-ordinate of the spinous processes can be predicted based on our equations with an accuracy of ±8.7 mm. Considering the small sample of nine subjects the data base is to narrow to allow general predictions for arbitrary populations. Combined with a complex model using external anthropomorphic data and locations of centers of rotation even more reliable and general predictions may be possible [23].
Restrictions of the used setup
Actually at least four lumbar levels were scanned within the described volume but due to change in posture only lumbar levels L3 and L4 remained in the middle of the volume. In the verge of the scan volume outside of this restricted middle area large bias is to be expected affecting the precision of our measurements. For the whole lumbar spine the anatomical structures are comparable so similar results for other lumbar levels are to be expected (see also [2, 4, 8]).
Due to static measurements—subjects had to rest for up to 5 min to measure a single posture—only five different seating postures were tested. This poor resolution in time restricts the number of postures feasible to investigate and the relations of skin markers, and their assigned landmark on the vertebrae during other postures can only be extrapolated. Especially during highly dynamic motions like jumping or running the relation of skin markers and their assigned vertebrae is unpredictable. While standing lumbar paraspinal muscle bellies contract and expand in the transverse direction. Probably these changes are small over wide areas in change of posture and do not affect the relation of skin markers to their bony landmark. The influence of muscle contraction per se was not investigated as the subjects sat relaxed within the scanner to persevere the measuring time. In our dataset influences of different swellings of back-muscles within different postures are not detectable. A hint towards an influence of transverse muscle-swelling during shortening is given by the results of the torsion experiments wherein muscles shorten asymmetrically. The medium marker shift for the torsion experiments show larger (but not statistically different) values.
The investigated subjects were young, sportsman-like males with no history of low back pain. The percentage of fat under their skin was very low so only the behavior of skin, muscles, connecting tissue, ligaments etc. as soft tissue was measured. There is no information about the influence of thick layers of fat so the shift of soft tissue in fat subjects is also unpredictable. Further, low-back-pain-patients have deviant paraspinal muscle-performance inducing deviations in the relation between skin markers and vertebrae.
Technical limitations
The most important limitation is the spatial resolution of the used MRI-scanner (Signa SP, General Electrics). Despite enhancing the resolution via interpolation (see Materials and methods) the corresponding error in co-ordinates propagates in all calculated parameters (translation-vectors, especially Cardan-angles). For better spatial resolution of the available instrument the subjects had to sit for more than 5 min in a fixed posture. The subjects perceived these exposures in a motion free, static attitude as tiring. Keeping these caveats in mind it is remarkable that the special arrangement and resulting orientation of the used set of external markers gives reasonable prediction for the angles of orientation of the underlying vertebrae. At this time no other three-dimensional device with important better resolution in time and space is available.
Only spatial orientation of single vertebrae on level L3 and L4 and their assigned marker-set were calculated. Relative inter-segmental angles are smaller than the measurement error using this possible spatial resolution and the algorithms to calculate the Cardan-angles. The propagation of the measurement error due to the volume resolution of the MRI limits the estimation of the Cardan-angles and the possibility to compare external and internal relative rotations between adjacent segments.
Finally, there is no space between the coils within the scanning volume to allow lateral flexion. Thus, for this component of rotation (β) no clear relation could be derived and the calculated differences in spatial orientations are also smaller than the measuring error.
Conclusions
For the investigated group of subjects positions and motions of lumbar spine skin markers are analogical to positions and motions of the assigned underlying lumbar vertebrae. So, skin markers can be used to estimate lumbar vertebral position and spatial orientation while seated. Similarly, lumbar motions during closely related daily life activities might be measurable with the skin marker method. The here presented coherence may not be true for elderly, overweight and scoliotic patients because of their behavior of soft tissue may diverge.
Acknowledgements
This work was supported by Forschungsgesellschaft für angewandte Systemsicherheit und Arbeitsmedizin mbH. Special thanks to the clinic and polyclinic for diagnostic radiology, university of Leipzig for using the open MR scanner, especially Dr. H. Busse and the technical employees. All investigated subjects were informed (written consent) following the requirements of the local ethical commission.
References
- 1.Baumgartner W, Grob D, Kramers-de Quervain I, Stüssi E (2001) Novel in vivo motion analysis of the healthy lower lumbar spine during standardized movements and complex daily activities. ISB 2001, Zürich
- 2.Bryant JT, Reid JG, Smith BL, Sleven JM. Method for Determining vertebral bodypositions in the sagittal plane using skin markers. Spine. 1989;14:258–265. doi: 10.1097/00007632-198903000-00004. [DOI] [PubMed] [Google Scholar]
- 3.Dimnet J, Fischer LP, Gonon G, Carret JP. Radiographic studies of lateral flexion in the lumbar spine. J Biomech. 1978;11(3):143–150. doi: 10.1016/0021-9290(78)90006-4. [DOI] [PubMed] [Google Scholar]
- 4.Gracovetsky S, Newman N, Pawlowsky M. A database for estimating normal spinal motion derived from noninvasive measurements. Spine. 1995;20:1036–1046. doi: 10.1097/00007632-199505000-00010. [DOI] [PubMed] [Google Scholar]
- 5.Harada M, Abumi K, Ito M, Kaneda K. Cineradiographic motion analysis of normal lumbar spine during forward and backward flexion. Spine. 2000;25(15):1932–1937. doi: 10.1097/00007632-200008010-00011. [DOI] [PubMed] [Google Scholar]
- 6.Hindle R, Pearcy M, Cross A, Miller D. Three-dimensional kinematics of the human back. Clin Biomech. 1990;5:218–228. doi: 10.1016/0268-0033(90)90005-Q. [DOI] [PubMed] [Google Scholar]
- 7.Kramers-de Quervain I, Baumgartner W, Stüssi E, Grob D (2001) Segmental motion of L3/4 and L4/5 of the lumbar spine during stair ambulation. ISB 2001, Zürich
- 8.Labesse F, Cheze L, Dimnet J (1996) Determination of optimal locations for further identification of the moving spine model. In. Proceedings of the Fourth International Symposium, Grenoble
- 9.Lundberg A. On the use of bone and skin markers in kinematics research. Hum Mov Sci. 1996;15(4):411–422. doi: 10.1016/0167-9457(96)00008-5. [DOI] [Google Scholar]
- 10.McGregor AH, McCarthy ID, Hughes SP. Motion characteristics of the lumbar spine in a normal population. Spine. 1995;20:2421–2428. doi: 10.1097/00007632-199511001-00009. [DOI] [PubMed] [Google Scholar]
- 11.McGregor AH, Anderton L, Gedroyc W. The assessment of intersegmental motion and pelvic tilt in elite oarsmen. Med Sci Sports Exerc. 2002;34(7):1143–1149. doi: 10.1097/00005768-200207000-00015. [DOI] [PubMed] [Google Scholar]
- 12.Okawa A, Shinomiya K, Komori H, Muneta T, Arai Y, Nakai O. Dynamic motion study of the whole lumbar spine by videofluoroscopy. Spine. 1998;23(16):1743–1749. doi: 10.1097/00007632-199808150-00007. [DOI] [PubMed] [Google Scholar]
- 13.Pearcy MJ. Stereoradiography of lumbar spine motion. Acta Orthop Scand. 1985;56:212. doi: 10.3109/17453678509154154. [DOI] [PubMed] [Google Scholar]
- 14.Pearcy MJ. Measurement of back and spinal mobility. Clin Biomech. 1986;1:44–51. doi: 10.1016/0268-0033(86)90037-9. [DOI] [PubMed] [Google Scholar]
- 15.Pearcy MJ, Whittle MW. Movements of the lumbar spine measured by three-dimensional X-ray analysis. J Biomed Eng. 1982;4(2):107–112. doi: 10.1016/0141-5425(82)90070-x. [DOI] [PubMed] [Google Scholar]
- 16.Pearcy MJ, Portek I, Sheperd J. The affects of low Back pain on lumbar spine movements measured by three-dimensional X-ray analysis. Spine. 1985;10:150–153. doi: 10.1097/00007632-198503000-00007. [DOI] [PubMed] [Google Scholar]
- 17.Söderkvist I, Wedin PA. Determining the movements of skeleton using wellconfigured markers. J Biomech. 1993;26:1473–1477. doi: 10.1016/0021-9290(93)90098-Y. [DOI] [PubMed] [Google Scholar]
- 18.Steffen T, Rubin RK, Baramki HG, Antoniou J, Marchesi D, Aebi M. A new technique for measuring lumbar segmental motion in vivo. Method, accuracy, and preliminary results. Spine. 1997;22(2):156–166. doi: 10.1097/00007632-199701150-00006. [DOI] [PubMed] [Google Scholar]
- 19.Stokes IA, Bevins TM, Lunn RA. Back surface curvature and measurement of lumbar spinal motion. Spine. 1987;12(4):355–361. doi: 10.1097/00007632-198705000-00009. [DOI] [PubMed] [Google Scholar]
- 20.Vitzthum HE, König A, Seifert V. Dynamic examination of the lumbar spine by using vertical, open magnetic resonance imaging. J Neurosurg. 2000;93:58–64. doi: 10.3171/spi.2000.93.1.0058. [DOI] [PubMed] [Google Scholar]
- 21.Vogt L, Pfeifer K, Portscher M, Banzer W. Influences of nonspecific low back pain on three-dimensional lumbar spine kinematics in locomotion. Spine. 2001;26(17):1910–1919. doi: 10.1097/00007632-200109010-00019. [DOI] [PubMed] [Google Scholar]
- 22.Woltring HJ. Representation and calculation of 3-D joint movement. Hum Mov Sci. 1991;10:603–616. doi: 10.1016/0167-9457(91)90048-3. [DOI] [Google Scholar]
- 23.Zhang X, Xiong J. Model-guided derivation of lumbar vertebral kinematics in vivo reveals the difference between external marker-defined and internal segmental rotations. J Biomech. 2003;36:9–17. doi: 10.1016/S0021-9290(02)00323-8. [DOI] [PubMed] [Google Scholar]


