Abstract
The synthesis of oxidized graphene nanoribbons (O-GNR) via longitudinal unzipping of carbon nanotubes opens avenues for their further development for a variety of biomedical applications. Evaluation of the cyto- and bio-compatibility is necessary to develop any new material for in vivo biomedical applications. In this study, we report the cytotoxicity screening of O-GNRs water-solubilized with PEG-DSPE (1,2-distearoyl-sn-glycero-3-phosphoethanolamine-N-[amino(polyethylene glycol)]), using six different assays, in four representative cell lines; Henrietta Lacks cells (HeLa) derived from cervical cancer tissue, National Institute of Health 3T3 mouse fibroblast cells (NIH-3T3), Sloan Kettering breast cancer cells (SKBR3) and Michigan cancer foundation-7 breast cancer cells (MCF7). These cell lines significantly differed in their response to O-GNR-PEG-DSPE formulations; assessed and evaluated using various endpoints (lactate dehydrogenase (LDH) release, cellular metabolism, lysosomal integrity and cell proliferation) for cytotoxicity. In general, all the cells showed a dose-dependent (10–400 μg/ml) and time-dependent (12–48 h) decrease in cell viability. However, the degree of cytotoxicity was significantly lower in MCF7 or SKBR3 cells compared to HeLa cells. These cells were 100% viable upto 48 hours, when incubated at 10μg/ml O-GNR-PEG-DSPE concentration, and showed decrease in cell viability above this concentration with ~78% of cells viable at the highest concentration (400 μg/ml). In contrast, significant cell death (5–25% cell death depending on the time point, and the assay) was observed for HeLa cells even at a low concentration of 10μg/ml. The decrease in cell viability was steep with increase in concentration with the CD50 values ≥ 100μg/ml depending on the assay, and time point. Transmission electron microscopy of the various cells treated with the O-GNR solutions show higher uptake of the O-GNR-PEG-DSPEs into HeLa cells compared to other cell types. Additional analysis indicates that this increased uptake is the dominant cause of the significantly higher toxicity exhibited by HeLa cells. The results suggest that water-solubilized O-GNR-PEG-DSPEs have a heterogeneous cell-specific cytotoxicity, and have significantly different cytotoxicity profile compared to graphene nanoparticles prepared by the modified Hummer’s method (graphene nanoparticles prepared by oxidation of graphite, and its mechanical exfoliation) or its variations.
Keywords: Multi-walled Carbon Nanotubes, Oxidized Graphene Nanoribbons, PEG-DSPE, Solubility, Toxicity Assays, Colony Size, Transmission Electron Microscopy, Cellular Uptake
INTRODUCTION
Graphene, a two-dimensional (2-D) carbon nanostructure, has attracted a great deal of attention due to its unique nanoscopic properties, and has shown potential for various material, and biomedical science applications [1–9]. Recent reports predict that graphene might overtake carbon nanotubes in commercial applications [10]. Evaluation of the cyto- and bio-compatibility is necessary to develop graphene nanomaterial for in vitro or in vivo biomedical applications. Additionally, in the future, use of these materials for a wide range of commercial materials science applications will increase the possibility of their release into the environment.
Compared to carbon nanostructures such as fullerenes [11], metallofullerenes [12] and carbon nanotubes [13, 14], few reports are available on the toxicity of graphene in vitro [15–17], and in vivo [18, 19]. Solution-based techniques based on the modified Hummer’s method (chemical oxidation of graphite followed by ultrasonic cleavage) have been used in the synthesis of graphene nanoparticles for these toxicity studies, as they allow preparation of graphene in macroscopic amounts necessary for these studies and eventual applications [20]. Recently, Kosynkin, Tour, and co-workers have pioneered an oxidative method that allows the synthesis of graphene nanoparticles in macroscopic amounts by the longitudinal unzipping of multi-walled carbon nanotubes [21]. These nanoparticles, referred to as graphene nanoribbons, may also be suitable for a variety of biomedical applications provided they are not toxic in vitro and in vivo. In this article, we assess, and evaluate the cytotoxicity of oxidized-graphene nanoribbons (O-GNRs) water-solubilized with the amphiphilic polymer PEG-DSPE (hereafter referred to as O-GNR-PEG-DSPE) at various concentrations (0–400 μg/ml) and time points (24–72 hours) in four different cell lines (HeLa, MCF7, SKBR, NIH3T3).
MATERIALS AND METHODS
Synthesis of oxidized graphene nanoribbons formulations
O-GNRs were synthesized from multi-walled carbon nanotubes (Catalog no 636487, Sigma Aldrich, New York, USA) using a minor modification (centrifugation was used for purification rather than filtration) of the previously reported procedure [21]. Briefly, multi walled carbon nanotubes (MWCNTs) (150 mg) were suspended in 30 ml of concentrated sulphuric acid (H2SO4) for 2–4 hours. Potassium permanganate (KMnO4, 750 mg, 4.75 mmol) was added, and the mixture was stirred for 1 hour. The reaction was heated at 55–70°C in an oil bath for an additional 1 hour until completion, cooled to room temperature, and washed with dilute aqueous hydrochloric acid. Ethanol and ether were added for flocculation, and the product was isolated by centrifugation at 3000 rpm for 30 minutes. The sample was then dried overnight in a vacuum oven.
Dried O-GNR samples were weighed, and dispersed in 2 ml of PEG-DSPE(1,2-distearoyl-sn-glycero-3-phosphoethanolamine-N-[amino(polyethylene glycol)]) solution (best dispersion was achieved using 1.2 mg/ml of PEG-DSPE), or DI water to obtain the different concentrations. The dispersions were first bath sonicated (Ultrasonicator FS30H, Fischer Scientific, Pittsburgh, PA) for 15 minutes followed by probe sonication for 180 seconds (2 seconds on and 1 second off cycle, 20% amplitude, Cole Parmer Ultrasonicator LPX 750) to ensure homogenous O-GNR suspensions. Freshly-prepared O-GNR-PEG-DSPE formulations were used for all the cell studies.
Previous trace metal analysis show that the solid O-GNR samples had 0.29 wt% of potassium, 0.93 wt% of manganefse and 0.005 wt% iron, and aqueous O-GNR suspensions have 0.27 ppm of manganese (less than 1 ppm present in cell culture media), and no iron was detected (below the limit of detection of the instrument of 1 ppb) [9].
Sample preparation for Transmission Electron Microscopy
Samples for high resolution transmission electron microscopy (HRTEM) were prepared by dispersing the GONR in 1:1 mixture of water/ethanol by probe sonication for 1 min (Cole Parmer Ultrasonicator LPX 750) followed by ultra centrifugation at 5000 rpm for 5 mins. The supernatant was dropped onto 300 mesh size, holey lacey carbon grids on a copper support (Ted Pella, Inc., Redding, CA). HRTEM was performed using JOEL 2100F high-resolution analytical TEM (Center for Functional Nanomaterials, Brookhaven National Laboratory) at an accelerating voltage of 200kV.
Cell Culture
Four different cell lines Henrietta Lacks cells (HeLa) derived from cervical cancer, National Institute of Health 3T3(NIH-3T3) mouse fibroblast cells, Sloan Kettering breast cancer cells (SKBR3) and Michigan cancer foundation-7 breast cancer cells (MCF7) were used in the experiments. All cell lines were obtained from ATCC (Manassas, VA, USA). HeLa cells and NIH-3T3 mouse fibroblasts were grown in Dulbecco’s Modified Eagle Medium (DMEM) medium, SKBR3 cells were grown in McCoy’s medium and MCF7 cells were grown in RPMI 1600 medium. All the media were supplemented with 10% fetal bovine serum and 1 % penicillin-streptomycin. Cells were incubated at 37°C in a humidified atmosphere of 5% CO2, and 95% air.
Alamar Blue Assay
Cell viability in terms of mitochondrial integrity, and overall cellular metabolism was measured by alamar blue assay (Invitrogen, Grand Island, NY). Cells from the three different cell lines (SKBR3, MCF7 and HeLa) were plated at 5 × 10³ cells per well in 96 well plates, and incubated for 18 hours. Before commencing with the assay, old media was replaced with 200 μl of fresh media in each well. 50 μl of O-GNR PEG-DSPE stock solutions at various concentrations were added to every well for a final treatment concentration of 10μg/ml, 50 μg/ml, 100μg/ml, 200μg/ml, 300 μg/ml and 400 μg/ml. The cells were incubated at 37 °C for 24, and 48 hours. After each time point, the media was removed, and wells were rinsed twice with Dulbecco’s phosphate buffer saline (DPBS) before adding 100μl of fresh media, and 10μl of alamar Blue reagent. The plates were again incubated for 2 hours at 37°C. Fluorescence readings of the wells were recorded by Cytofluor fluorescence multiwell plate reader (Series H4000 PerSeptive Biosystems, Framingham, MA) with excitation at 530 nm, and emission at 580 nm. Fluorescence reading for cells in the culture medium containing only PEG-DSPE was used for baseline correction. The cell viability in terms of % of control cells is expressed as the percentage of (Ftest − Fblank)/(Fcontrol − Fblank), where Ftest is the fluorescence of the cells exposed to nanoribbon sample, Fcontrol is the fluorescence of the unexposed control sample and Fblank is the fluorescence of the wells without any cells. Cell viability in the presence of PEG-DSPE was also tested.
Neutral Red Assay
Cell viability in terms of lysosomal integrity was measured by neutral red assay (Sigma-Aldrich, New York). SKBR3, MCF7 and HeLa cells were plated at 5 × 10³ cells per well in 96 well cell culture plates, and incubated for 18 hours. Next, the cell culture media from each well was removed, and replaced with 200μl of fresh media. Similar to the alamar blue assay, 50 μl of O-GNR-PEG-DSPE stock solutions at various concentrations were added to every well for a final treatment concentration of 10μg/ml, 50 μg/ml, 100μg/ml, 200μg/ml, 300 μg/ml, and 400 μg/ml. The cells were incubated at 37°C for 24 and 48 hours. After each time point, the media was removed, and the wells were rinsed multiple times with DPBS. After the DPBS washes, 100μl of fresh media was added to each well along with 10 μl of neutral red reagent (0.33% in DPBS), followed by incubation for 2 hours at 37°C. The neutral red reagent was removed, and cells were treated with 100μl of neutral red assay fixative for 1 min followed by 100μl of neutral red assay solubilization reagent. Absorbance of culture media containing PEG-DSPE at 490 nm was used for baseline correction in all the groups. Absorbance readings of the plates were taken in a BIOTEK ELx 800 absorbance micro plate reader at 490 nm. Cell viability in terms of % of control cells is expressed as (ODtest − ODblank)/(ODcontrol − ODblank), where ODtest is the optical density of the cells exposed to nanoribbon sample, ODcontrol is the optical density of the control sample, and ODblank is the optical density of the wells without any cells.
Trypan Blue Assay
Cell mortality of SKBR3, MCF7 and HeLa cells was investigated by trypan blue assay. All the 3 cell lines were plated in 6-well culture plates at a concentration of 106 cells per well, and incubated for 18 hours prior to media change, and O-GNR-PEG-DSPE treatment. The wells were incubated with O-GNR-PEG-DSPE solutions at concentrations of 10μg/ml, 50 μg/ml, 100μg/ml, 200μg/ml, 300 μg/ml, and 400 μg/ml for 12 hours. Next, the cells were trypsinized using with 300 μl trypsin–EDTA solution. The supernatant was mixed with trypsin detached cells, and centrifuged at 1500 rpm for 3 minutes. 1ml of trypan blue reagent was added to the pellet, and the cells were counted using a hemocytometer. Cell mortality (%) was expressed as the percentage of dead cells out of the total number of cells. Cells cultured in the absence of O-GNR-PEG-DSPE served as control. Mortality of cells in the presence of PEG-DSPE was also tested.
Lactate Dehydrogenase Assay
Membrane integrity of cells exposed to O-GNR-PEG-DSPE was evaluated by lactate dehydrogenase assay (LDH) Kit (Sigma-Aldrich, New York). SKBR3, MCF7 and HeLa cells were plated at a density of 5 × 10³ cells per well in 96 well cell culture plates, and incubated for 18 hours. Post media changes, and treatments of the cells at O-GNR-PEG-DSPE concentrations (10–400 μg/ml similar to the previous assays, the cells were incubated at 37°C for 24, 48, and 72 hours). After each time point, media was collected from individual wells and centrifuged at 1200 rpm for 5 minutes. 50 μl of the media supernatant was added to a fresh 96 well plate along with LDH assay reagent and incubated for 45 minutes. The absorbance values were recorded at 490 nm. Positive control was prepared by adding 10 μl of lysis solution to the control cells, 45 min before centrifugation. The LDH leakage (% of positive control) is expressed as the percentage of (ODtest − ODblank)/(ODpositive − ODblank), where ODtest is the optical density of the control cells, or cells exposed to O-GNR-PEG-DSPE, ODpositive is the optical density of the positive control cells, and ODblank is the optical density of the wells without cells. Absorbance of culture media containing PEG-DSPE was used for baseline correction in all the groups. LDH release from cells in the presence of DSPE-PEG was also tested.
Clonogenic assay
Cell division and colony forming capacity of the cells exposed to the O-GNR-PEG-DSPE formulations were evaluated using clonogenic assay. HeLa and MCF7 cells were plated at a density of 50 cells per well in 6 well plates. After 18 hours of incubation, old media was removed and 1.6 ml of fresh media along with 400 μl of various O-GNR-PEG-DSPE stock solutions were added to yield final treatment concentrations of 1 μg/ml, 10 μg/ml and 30 μg/ml. The cells were incubated at 37°C for 7 days, and media was changed every 2 days. Post incubation, the culture media was removed, cells were subjected to multiple DPBS washes, and fixed using ice cold methanol. Cell colonies were viewed and imaged by a brightfield microscope (Axiovision 4.0, Zeiss, Germany). Cells cultured without O-GNR-PEG-DSPE or with PEG-DSPE served as the controls.
Image processing toolbox in MATLAB was used to quantify the sizes of each of the colonies obtained after O-GNR-PEG-DSPE treatment. Briefly, bright field images were subjected to a series of image processing steps such as thresholding, edge detection, contrast enhancement, median filtering, erosion, and dilation followed by quantification of the region properties. Colony area, computed using image processing (square pixels) was converted to μm2 based on the pixel area, scale and magnification of the bright-field images. Multiple colonies were analyzed for every O-GNR-PEG-DSPE treatment group (Supplementary figure S8).
TEM of cells incubated with the O-GNR-PEG-DSPE formulations
Six well plates with surfaces covered with ACLAR® film (Electron Microscopy Sciences, Hatford, PA) were plated with cells at a density of 5 × 10⁵ cells per plate, and exposed to O-GNR-PEG-DSPE for 3 hours. At the end of three hours, cells were fixed with 2.5% electron microscopy grade glutaraldehyde (Electron Microscopy Sciences, Hatford, PA) in 0.1 M PBS. After fixation, the films containing fixed cells were placed in 2% osmium tetroxide in 0.1 M PBS, dehydrated through graded ethanol washes, and embedded in durcupan resin (Sigma-Aldrich, St. Louis, USA). Areas with high cell densities were blocked, cut into 80 nm ultra-thin sections using an Ultracut E microtome (Reichert-Jung, Cambridge, UK), and placed on formvar-coated copper grids. The sections were then viewed with a Tecnai Bio Twin G transmission electron microscope (FEI, Hillsboro, OR), at 80 kV. Digital images were acquired using an XR-60 CCD digital camera system (AMT, Woburn, MA).
STATISTICAL ANALYSIS
All data are presented as mean ± standard deviation. (n = 4 for trypan blue assay, and n = 6 for all other assays). Student’t’ test was used to analyze the differences among groups. One-way analysis of variance (ANOVA) followed by Tukey Kramer post hoc analysis was used for multiple comparisons between groups. All statistical analyses were performed using a 95% confidence interval (p < 0.05).
RESULTS
TEM
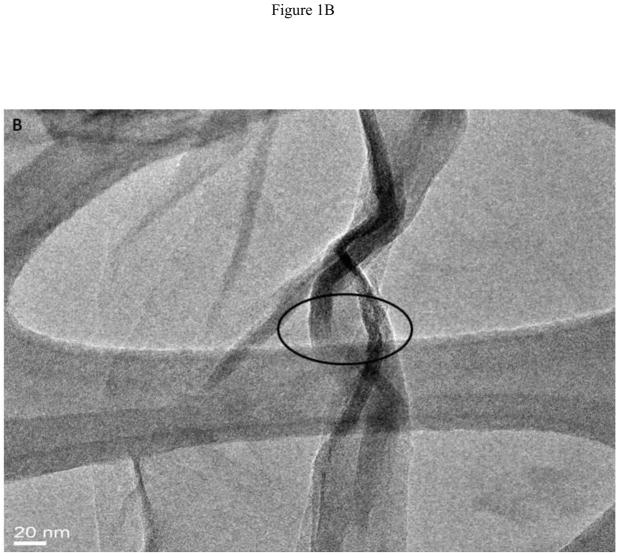
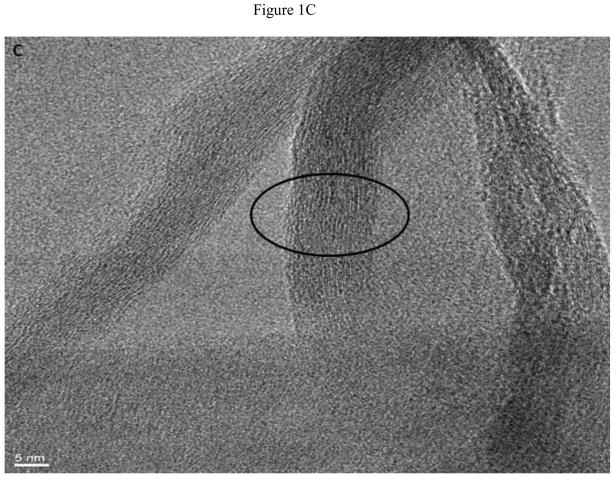
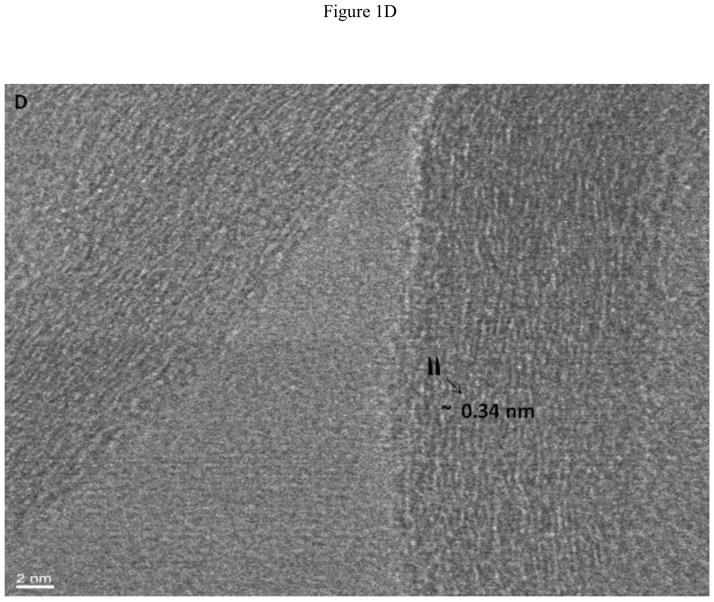
Figure 1A displays a low resolution TEM micrograph showing multiple GONRs. As seen in the figure, the graphene nanoribbons have fully unzipped layers of graphene sheets. The TEM image clearly shows that the nanoribbons are multilayered (arrows) due to the unzipping of the MWCNTs. The graphene oxide nanoribbon structure appears mostly uniform and smooth, with few defects. Analyses of multiple TEM images show that O-GNRs have an average width of 125 – 220 nm, and lengths between of 500 – 2500 nm. Figure 1B, C and D are representative high resolution TEM (HRTEM) images of the synthesized O-GNRs that show straight smooth edges with no edge-roughness. The inter-layer spacing of graphene sheets measured from HRTEM micrograph is ~ 0.34 nm, which is in agreement with the values reported for pristine graphene [22].
FIGURE 1.
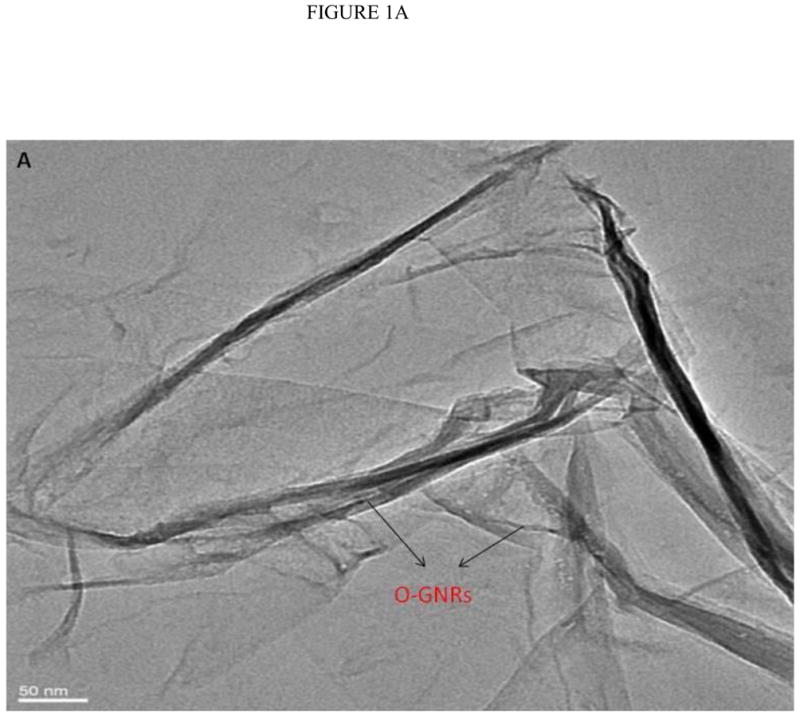
(A) Representative low resolution TEM image showing multiple oxidized graphene nanoribbons (O-GNR). (B–D) High Resolution TEM micrographs of graphene oxide nanoribbons at 200 kV. (B) Image depicting unzipping of carbon nanotubes to form O-GNR. (C) Corresponding high resolution image of the highlighted area revealing multiple layers of oxidized graphene nanoribbon. (D) Further high resolution micrograph of image (C) revealing Van-der-Waal thickness of ~ 0.34 nm, corresponding to individual graphene layers. Scale bars: (B) 20 nm, (C) 5 nm and (D) 2 nm.
Alamar Blue Assay
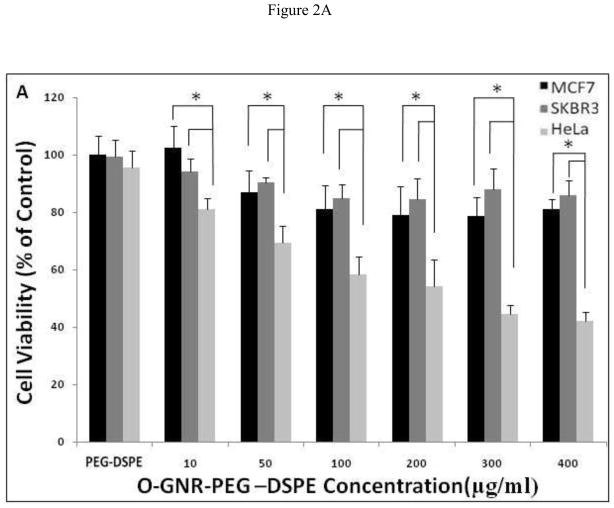
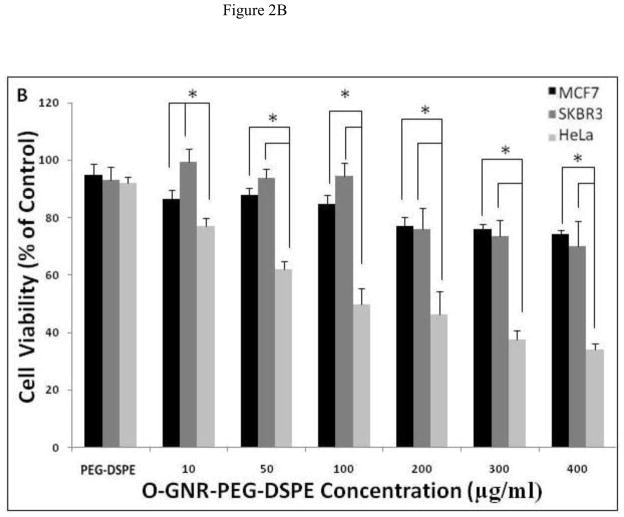
In this fluorescence-based assay, the non-fluorescent dye Alamar blue (resazurin) acts as an electron acceptor for enzymes like nicotinamide adenine dinucleotide phosphate (NADP), and is converted to a pink fluorescent dye. The amount of non-fluorescence to fluorescence conversion is dependent on the metabolic state of cells. Increased metabolic activity produces more conversion, and hence more fluorescence. Figure 2A and B show the plot of percent cell viability as a function of O-GNR-PEG-DSPE concentration (10–400 μg/ml) at the 24, and 48 h time points, respectively. At both the time points, all the three cell types showed a decrease in cell viability with increase in incubation concentrations and the largest decrease in cell viability was observed at the maximum incubation concentration of 400 μg/ml. At this concentration, the SKBR3 cells shows ~10% and 22% decrease in cell viability at the 24 and 48 h time points, respectively. MCF7 cells show a 15% and 20% decrease in cell viability at the 24 and 48 h time points, respectively. At the same incubation concentration, HeLa cells show a 60% and 63% decrease in cell viability at the 24 and 48 h time points, respectively. 50% cell death was observed for the HeLa cells at 200 μg/ml incubation concentration at both the time points.
FIGURE 2.
Alamar blue assay to assess the cell viability of HeLa, MCF7 and SKBR3 cells incubated with PEG-DSPE (control) and various O-GNR-PEG-DSPE (10–400 μg/ml) concentrations at (A) 24 and (B) 48 hour time points. Data are presented as mean ± SD (n = 6 per group). * = p < 0.05 between groups at that particular concentration.
Neutral Red assay
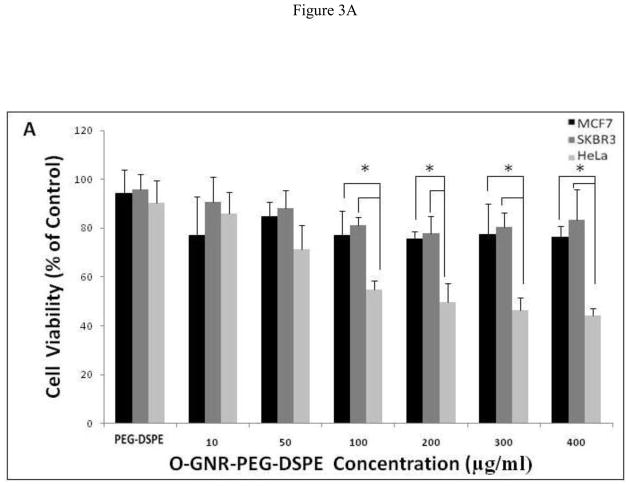
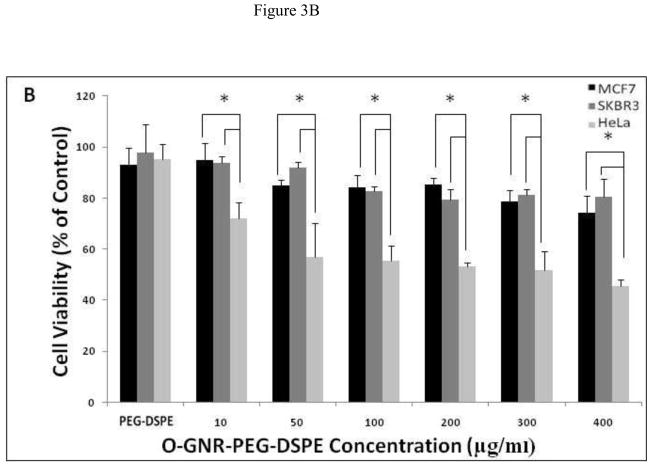
In this colorimetric assay, healthy cells take up and store the neutral red dye in lysosomes, which is released in the presence of solubilization buffer. Healthy cells with intact lysosomes hold more neutral red dye than dead cells or cells undergoing apoptosis. Figures 3A and 3B show the viability of 3 cell lines (SKBR3, MCF7, and HeLa), incubated with the O-GNR-PEG-DSPE solutions for 24 and 48 hours at concentrations between 10–400 μg/ml. At both the time points, all the three cell types showed a decrease in cell viability with increase in incubation concentrations. At the highest concentration of 400 μg/ml, SKBR3 cells show maximum cell death with 17% and 20% decrease in cell viability, and MCF7 cells show a 20% and 22% decrease in cell viability at the 24 and 48 hour time points, respectively. HeLa cells show a 60%, and 58% decrease in cell viability at the 24 and 48 hour time points, respectively. 50% cell death was observed for the HeLa cells at 200 μg/ml incubation concentration at both the time points.
FIGURE 3.
The Neutral red assay to assess the cell viability of HeLa, MCF7 and SKBR3 cells incubated with PEG -DSPE(control) and various O-GNR-PEG-DSPE (10–400 μg/ml) concentrations at (A) 24 and (B) 48 hours. Data are presented as mean ± SD (n = 6 per group). * = p < 0.05 between groups at that particular concentration.
Trypan Blue Assay
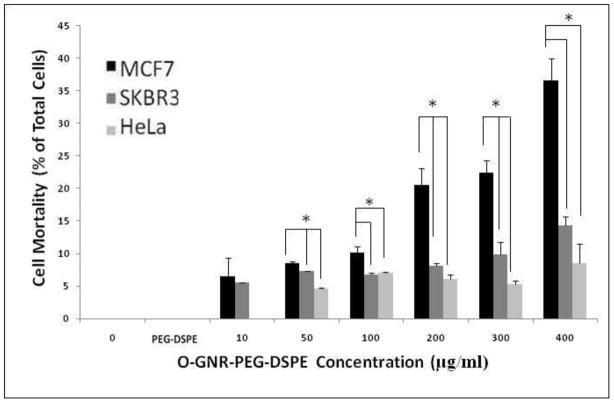
This assay is based on the principle of dye exclusion to differentiate between living, and dead cells. Living cells with intact cell membranes prevent the trypan blue dye from entering them, whereas dead cells with compromised leaky cell membranes allow the dye to pass through. This allows dead cells stained by the dye to be visualized under a bright field microscope. Figure 4 shows the cell mortality (cell death) observed in the 3 cell lines (SKBR3, MCF7 and HeLa), when incubated with 10–400 μg/ml O-GNR-PEG-DSPE solution for 12 hours. Also included are the results of the controls; untreated cells, and cells treated with only the PEG-DSPE solution. The controls do not show any noticeable cell death in the three cell types. MCF7 cells show no cell death at 10μg/ml, ~5% cell mortality at 50 μg/ml, and no statistically significant increase upto 400 μg/ml treatment concentrations. SKBR3 cells show ~5% cell mortality at 10μg/ml incubation concentration, and a dose -dependent increase with ~13% cell death at 400 μg/ml treatment concentration. HeLa cells show ~5% cell mortality at 10μg/ml incubation concentration and a dose-dependent increase with ~36% cell death at the highest treatment concentration of 400 μg/ml.
FIGURE 4.
Trypan Blue Assay for assessing cell mortality in HeLa, SKBR and MCF 7 cells incubated with PEG-DSPE (control) and various O-GNR-PEG-DSPE (10–400 μg/ml) concentrations for 12 hours. Data are presented as mean ± SD (n = 4 per group). * = p < 0.05 for two particular groups.
LDH Assay
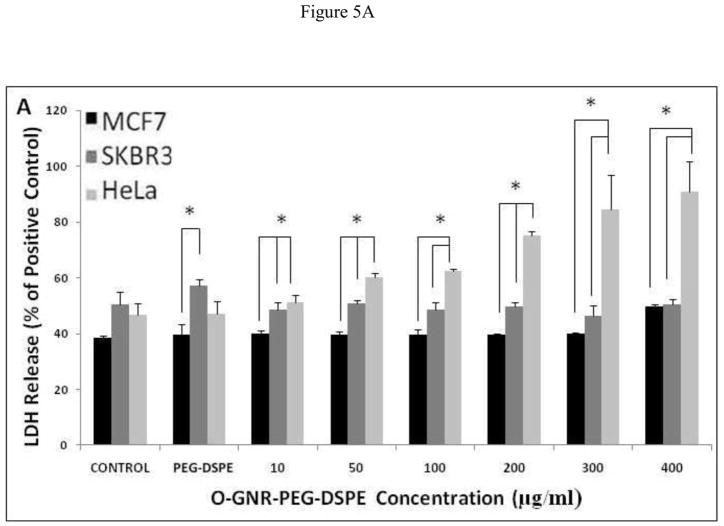
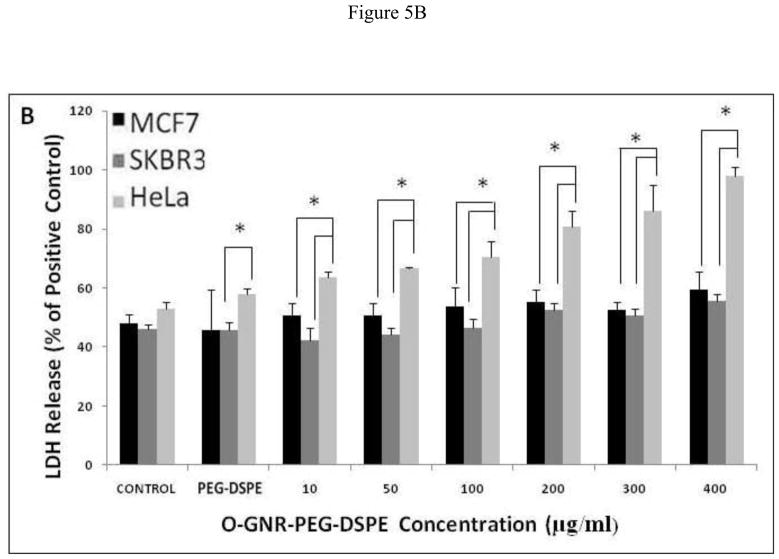
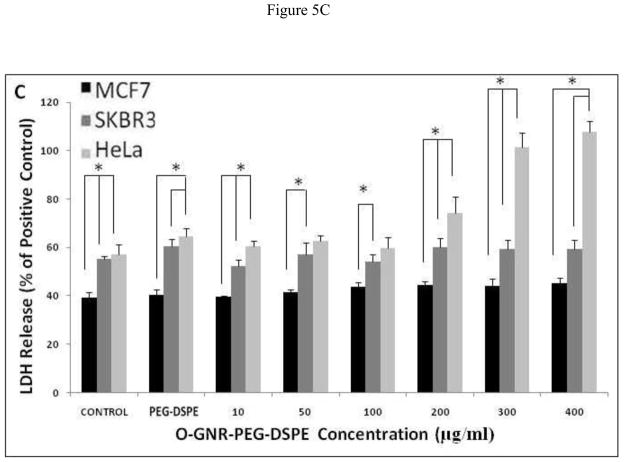
This assay measures the cytosolic enzyme lactate dehydrogenase (LDH) released in the media by dying cells possessing compromised cell membranes. The released LDH oxidizes lactate to pyruvate which converts iodonitrotetrazolium (INT) present in the assay reagent to formazan; a water soluble molecule with an absorbance peak at 490 nm [23], readily detectable by optical absorption spectroscopy. Figure 5A–C shows %LDH release from the three cell lines incubated with various concentrations of O-GNR-PEG-DSPE (10–400 μg/ml), for 24, 48, and 72 h. The results of the controls; untreated cells, and cells treated with only the PEG-DSPE solution are also shown. The controls (untreated cells) show different LDH release with SKBR3 and HeLa cells showing slightly higher LDH release at the three time points (24,48, and 72 hours) compared to MCF7 cells which do not show any statistically significant increase in %LDH release with increase in O-GNR-PEG-DSPE incubation concentrations, at all the three time points (Figure 5A–C). At the highest concentration (400 μg/ml), MCF7 cells show the maximum LDH release of ~45% LDH compared to positive control (lysis solution) at the 24 hour time point, which remains almost same (~40%) at the 72 hour time point. SKBR3 cells also show no statistically significant increase in %LDH release with increase in O-GNR-PEG-DSPE incubation concentrations at all the three time points (Figure 5A–C). SKBR3 cells incubated with 400 μg/ml O-GNR-PEG-DSPE solution show a LDH release of ~45% at the 24 and 48 hour time points which increases to ~55% at the 72 hour time point. HeLa cells show an increase in %LDH release with increase in O-GNR-PEG-DSPE incubation concentrations, at all the three time points (Figure 5A–C). They show ~95% LDH release at the 24 hour time point when compared to positive control, which increases to ~105% at the 72 hour time point.
FIGURE 5.
%LDH release (normalized to LDH release from positive control; cells incubated with lysis buffer for 45 min) in HeLa, SKBR and MCF7 cells following incubation with various O-GNR-PEG-DSPE (10–400 μg/ml) concentrations at (A) 24, (B) 48 and (C) 72 hours. Data are presented as mean ± SD (n = 6 per group). * = p < 0.05 between groups at that particular concentration.
Clonogenic Assay
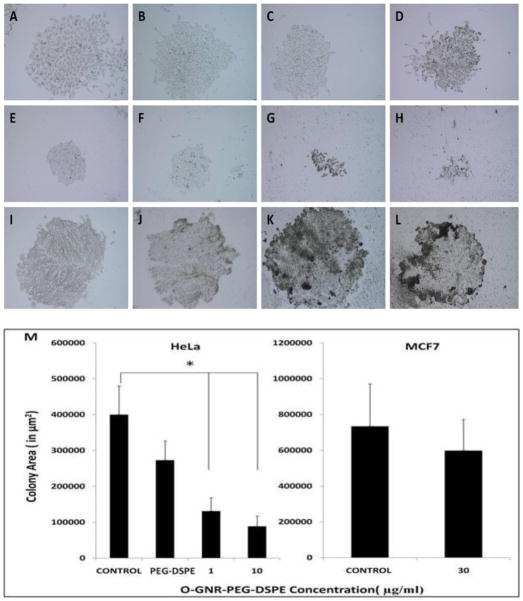
The clonogenic assay is a widely-accepted method to quantify the proliferation rate, and capacity of colony formation of cancer cells in presence of one or more xenobiotic compounds [24]. The colony forming capacity of an individual cancer cell can be assessed by either counting the number of colonies or by estimating the size of the colonies produced by the individual cells at various concentrations of the xenobiotic compound. Figure 6 shows representative bright-field optical images of HeLa and MCF7 cell colonies after 7 days. These images are of control groups (untreated cells or only PEG-DSPE solution) and experimental groups (cells incubated with O-GNR-PEG-DSPE solutions at various concentrations). Figure 6A and Figure 6B are bright-field images of HeLa cell colonies formed by the control cells (untreated cells). Figure 6C and Figure 6D are bright-field images of HeLa cell colonies formed when cells were incubated with only the PEG-DSPE solution. Figure 6E–H show colonies of HeLa cells formed by cells incubated with 1μg/ml (Figure 6E–F), and 10μg/ml (Figure 6G–H) of O-GNR-PEG-DSPE solution. HeLa cell colonies, albeit of smaller sizes compared to controls could only be observed for cells incubated at these concentrations. At the O-GNR-PEG-DSPE incubation concentration of 30 μg/ml, individual HeLa cells could be observed till day 3 of incubation, and no observable cell colonies were formed at day 7 (results not shown). MCF7 cell colonies formed in the absence (control) and presence of O-GNR-PEG-DSPE solution (incubated at 30 μg/ml concentration) are shown in Figures 6I–J and K–L, respectively. Qualitatively, from the images, the MCF7 cell colony sizes for all groups were similar. Image processing performed to calculate the colony area (Figure 6M) showed no significant difference between the untreated control (HeLa, and MCF7 cells), HeLa cells treated with only PEG-DSPE, and MCF7 cells incubated with 30 μg/ml O-GNR-PEG-DSPE (average colony area ~ 3–8 × 105 μm2). However, HeLa cells showed smaller colony areas of ~ 1.5×105 μm2 and 1×105 μm2 at incubation concentrations of 1 and 10μg/ml, respectively.
FIGURE 6.
Representative bright-field optical microscopy images after 7 days of (A–B) HeLa cell colonies formed from control cells (untreated cells); (C–D) HeLa cell colonies formed after individual HeLa cells were initially incubated with only PEG-DSPE solution; (E–F) HeLa cell colonies formed after individual HeLa cells were initially incubated with 1 μg/ml O-GNR-PEG-DSPE’s; (G–H) HeLa cell colonies formed after individual HeLa cells were initially incubated with 10μg/ml O-GNR-PEG-DSPE’s; (I–J) MCF7 cell colonies formed from control cells (untreated cells); (K–L) MCF7 cell colonies formed after individual MCF7 cells were initially incubated with to 30 μg/ml O-GNR-PEG-DSPE solution. (M) Quantified colony areas for HeLa cells (Control, incubated with to only PEG-DSPE and treated with 1 μg/ml and 10μg/ml O-GNR-PEG-DSPE solutions), and MCF7 cells (Control, and treated with 30 μg/ml O-GNR-PEG-DSPE solution).Data are presented as mean ± SD (n = 6 per group). * = p < 0.05 between groups. All the optical images images have a size bar of 200 μm.
Cellular Uptake
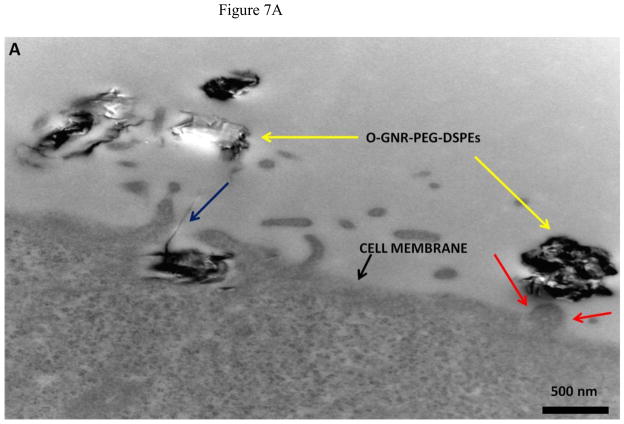
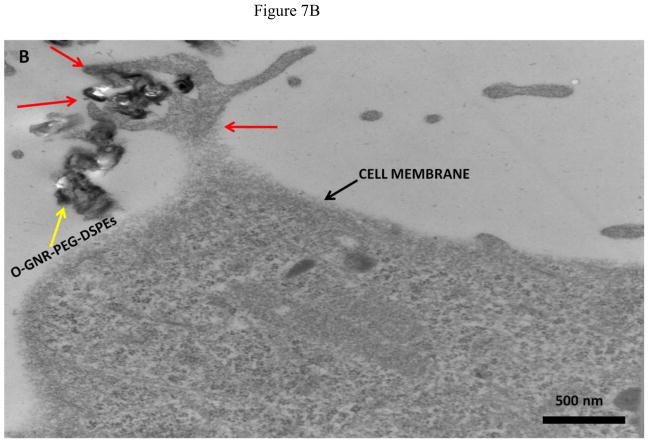
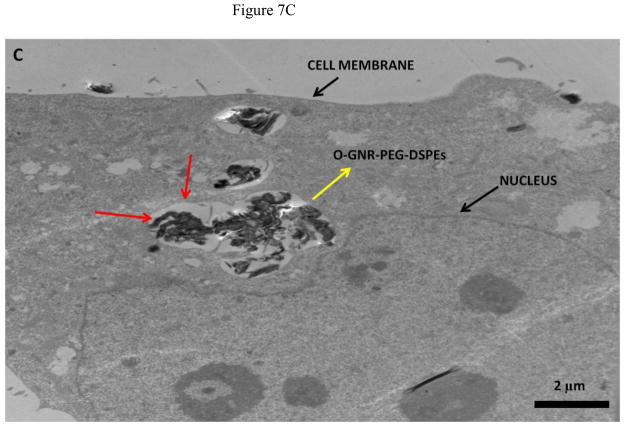
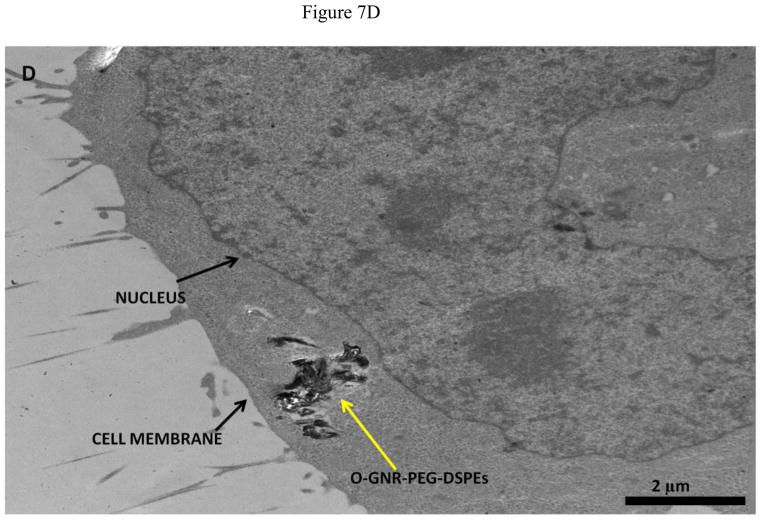
Representative TEM images of HeLa and MCF7 cells incubated with 20 μg/ml O-GNR-PEG-DSPE solution are shown in Figure 7 and Figure S4, respectively. Figure 7A shows O-GNR-PEG-DSPE aggregates (yellow arrow) at the periphery of a HeLa cell. The same image also shows O-GNR-PEG-DSPEs located in a pit (coated pit involved in endocytosis) with the membrane enveloping around it suggesting that this aggregate is getting endocytosed (blue arrows). A part of the membrane from the same cell can also be seen moving towards a larger aggregate (red arrows) suggesting a macropinocytotic mode of uptake being also present. Figure 7B shows a HeLa cell with its cytoplasm (red arrows) moving towards the O-GNR-PEG-DSPEs (yellow arrow), and engulfing them in a mechanism similar to macropinocytosis. Figure 7C shows large O-GNR-PEG-DSPE aggregates inside a HeLa cell. The aggregates are enclosed within a vesicular structure (red arrows) lying outside the nucleus. The structures are similar in appearance to early endosomes (endosomal matrix is less dense matrix than cytoplasm) which generally transport endocytosed material to lysosomes after maturation. Figure 7D shows another vesicle carrying the O-GNR-PEG-DSPEs. Analysis of multiple TEM images of many different cells indicates that most of the O-GNR-PEG-DSPEs uptaken into the HeLa cells were present in vesicles within the cell and rarely found outside the cells. Additionally, no O-GNR-PEG-DSPE aggregates were found inside the nucleus of the HeLa cells or associated with any cellular organelles. Figure 7E and F show TEM images of HeLa cells incubated with 20μg/ml O-GNR-PEG-DSPE for 24 hours. The images show swollen intracellular vesicles (Figure 7E), and disrupted plasma membrane (Figure 7F) shown with red arrows) commonly observed in necrotic cells. The TEM images of MCF 7 cells show most of the O-GNR-PEG-DSPE as aggregates (Supplementary section 4, and Figures S4 A–D, yellow arrows) in the periphery of the cells, and no or very few aggregates within the cells. The cells appear healthy, and do not show any apparent changes in the gross morphology.
FIGURE 7.
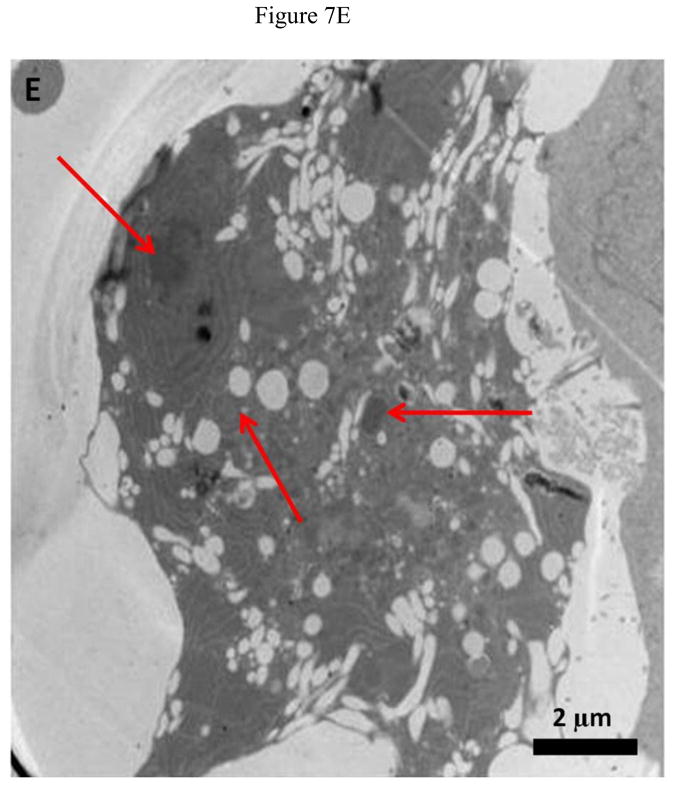
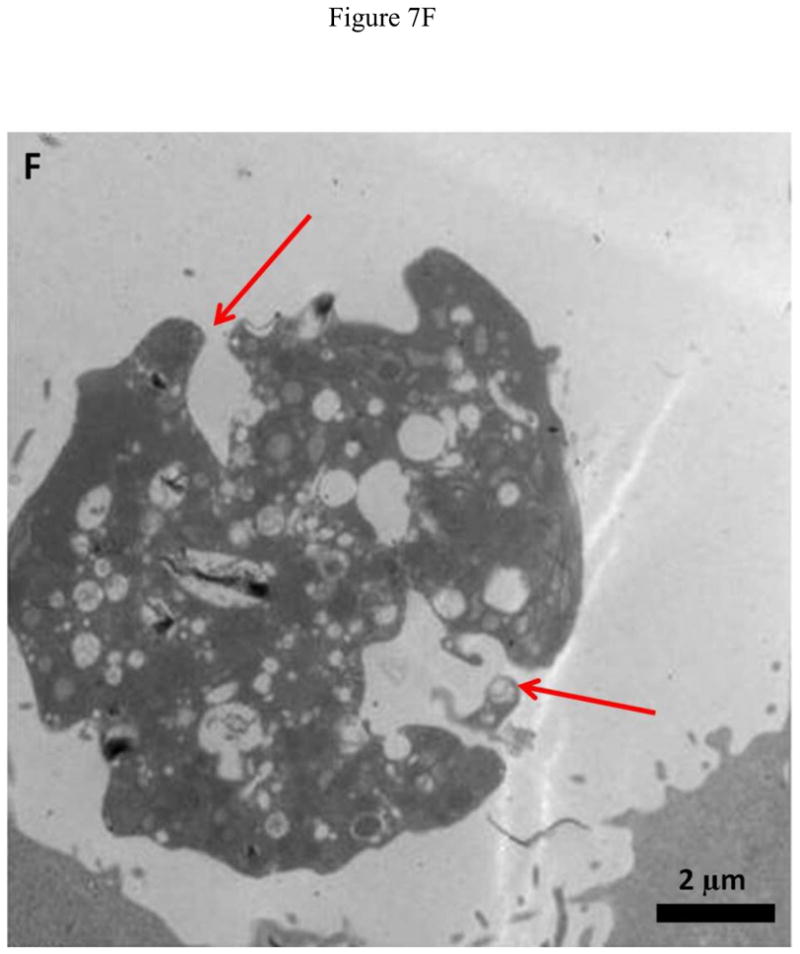
Representative TEM images of a HeLa cell incubated with 20 μg/ml O-GNR-PEG-DSPE solution for 3 hours.(A) O-GNR-PEG-DSPE aggregates at the periphery of the cell (blue arrows). (B) Cell membrane protruding towards and engulfing large O-GNR–PEG-DSPE aggregates (red arrows). (C–D) O-GNR-PEG-DSPE aggregates enclosed in large cytoplasmic vesicles similar to endosomes (red arrows). (E-F) HeLa cells after exposure to 20 μg/ml O-GNR-PEG-DSPEs (yellow arrow) for 24 hours with (E) swollen vesicles, and (F) ruptured plasma membrane (red arrows) suggesting the cells are undergoing necrosis.
DISCUSSION
The objective of this study was to assess, and evaluate the cytotoxicity of O-GNR-PEG-DSPE formulations. Towards this end, O-GNR-PEG-DSPE solutions at various concentrations (0–400 μg/ml) were treated at various time points (24–72 hours) on four different cell lines (HeLa, MCF7, SKBR, and NIH3T3). The four cells were chosen since, they are widely accepted model cell lines used for screening in vitro cytotoxicity, and cytocompatibility [25]. The TEM images (Figure 1) clearly show multilayered (arrows) O-GNRs due to the unzipping of the MWCNTs. The starting material, MWCNTs, have an outer diameter of 40 – 70 nm. Upon unzipping, the MWCNTs should open up completely to have breadths of ~ 125 – 220 nm (π x diameter). The analysis of the TEM images indicates that the width of the graphene nanoribbons is ~ 125–220 nm, which is in the range expected for completely unzipped ribbons. The Raman spectrum (Supplementary section 1, and Figure S1) shows a prominent D-band peak due to increased disorder in the sp2 domains, and reduction of the crystal size due to oxidation [21]. PEG-DSPE was chosen as a dispersant as it has been previously used in numerous in vitro and in vivo studies to water-solubilize carbon nanotubes to ensure excellent dispersibility, in blood, and biological media[14]. The O-GNR-PEG-DSPE solutions were homogeneous, and stable up to the 3 hour time point (Supplementary section 2, and Figure S2). The O-GNRs dispersed in water settled down with time. Nevertheless, at the end of 3 hours, substantial amounts (~50%) of O-GNRs still remained in the solution. This observation is in line with other reports [6]. The presence of carboxyl and hydroxyl groups along the edges of the nanoribbons leads to their increased dispersibility in water [21]. However, the O-GNRs flocculate in presence of ionic salts typically present cell culture media. Thus, addition of a non-toxic coating such as PEG-DSPE stabilizes the O-GNRs and prevents them from settling down in biological media.
The initial cytotoxicity screening of O-GNR-PEG-DSPE formulations were done with SKBR3, MCF7, and HeLa cells using various assays that allow assessment of its effects on cell anatomy and physiology. These assays provide information on cell metabolism (alamar blue), cell machinery (neutral red), cell membrane integrity (LDH), cell mortality (trypan blue), and cell proliferation (clonogenic assay), which are direct or indirect indicators of cytotoxicity. All these assays require living cells to firmly adhere to the surface of the tissue culture wells. Thus, before these assays were performed, the four cell lines were incubated with 10μg/ml nanoribbons for 48 hours to confirm that the presence of the O-GNR-PEG-DSPEs does not affect the attachment of the cells to the substrate. No significant changes in cell number were observed when compared to untreated or control cells after multiple DPBS washes (see Supplementary section 5 and Figure S5). Thus, any observed decrease in cell viability cannot be attributed to live cells detaching from the substrates upon exposure to O-GNR-PEG-DSPE formulations. Although there are reports about the interactions of carbon nanotubes with alamar blue and neutral red dyes [26], the high solubility of the O-GNR-PEG-DSPE formulations allows them to be easily rinsed via DPBS washes before the commencement of assays. Thus, these assays did not show any nanoparticle interference.
The results of all five assays indicate that the O-GNR-PEG-DSPE has a dose- and time-dependent cytotoxic effect on the MCF7, SKBR3 and HeLa cell lines. In general the cytotoxic effects increased with increase in incubation concentration, and incubation time. However, the degree of cytotoxicity was significantly lower in MCF7 or SKBR3 cells compared to HeLa cells. The results of the alamar blue (indicator of cellular metabolism) and neutral red assays (indicator of lysosomal integrity) on the MCF7 or SKBR3 cells taken together show that, upto 48 hours, ~100% of these cells remain viable, when incubated at 10 μg/ml concentration. There is decrease in cell viability above this concentration, and ~78% are viable at the highest concentration (400 μg/ml). These results for the MCF7 and SKBR3 cells are further corroborated by LDH (indicator of cell membrane integrity), and trypan blue (indicator of cell death) assay. The LDH assay for both these cell lines shows no increase in LDH release at concentration upto 10 μg/ml compared to controls, or cells treated with only PEG-DSPE solution, but increase at higher concentrations. The trypan blue assay show no statistically significant increase in cell mortality upto 10 μg/ml, and a marginal (upto 13% cell death) increase at higher concentrations. The cell mortality values for the trypan blue assay are approximately half tthe values observed in other assays because of a media change at the 36 hour time point to avoid cell death due to nutrient depletion which removed the dead and detached cells at that time point. The results of the four assays taken together indicate that the O-GNR-PEG-DSPE formulations show no toxic effects on the MCF7 and SKBR3 cells upto 10μg/ml, and low cytotoxicity even at higher concentrations (400 μg/ml) over a period of 48 hours.
In contrast, the alamar blue, neutral red, trypan blue, and LDH assay results of HeLa cells taken together indicate that the O-GNR-PEG-DSPE formulations affect the cell viability at all concentrations and time points. At lowest incubation concentration 10μg/ml, the % cell death was between 5–25% cell (depending on the time point and assay), and steeply increased with concentration with the CD50 values ≥ 100μg/ml depending on the assay and time point. This substantially increased cytotoxicity of the O-GNR-PEG-DSPE formulations on HeLa cells compared to other cancer cell lines, and was further corroborated by the Clonogenic assay.
The clonogenic assay results (Figure 6) seven days after the treatment of HeLa cells with 1–30 μg/ml of O-GNR-PEG-DSPE solution clearly show dose-dependent decrease in the cell colony sizes with no colony formation at the 30 μg/ml incubation concentration. No such decrease was observed at these concentrations for the MCF7 cells or the controls. The decrease in the colony sizes at 1μg/ml compared to the untreated controls suggests that the O-GNR-PEG-DSPE formulations may have a long term adverse effect on atleast a small percentage of HeLa cells even at these low incubation concentrations.
The effects of the O-GNR-PEG-DSPE formulations were also investigated on NIH3T3 fibroblasts cells (a normal non-cancer cell line) using the LIVE cell assay. The results (Supplementary section 3, and Figure S3) indicate the viability of the NIH3T3 cells is affected in a manner similar to those observed for the MCF7 and SKBR3 cells; no toxic effects at 10μg/ml, and low toxicity at higher concentrations (upto 250 μg/ml) over a 24 hour period. The LIVE cells results for the HeLa cells were similar to the results of the other assays; low toxicity at 10μg/ml and steep increase in toxicity with increase in concentration. Thus, the results of the various assays indicate that the O-GNR-PEG-DSPE formulations show a differential (higher) cytotoxic response on HeLa cells compared other cancer or normal cells investigated in this study.
The significantly higher toxicity exhibited by HeLa cells may be attributed either to greater reactive oxygen species (ROS) generation, depletion of the nutrients in the culture media due to their absorption or adsorption by the nanoparticles, or the greater cellular uptake of the O-GNR-PEG-DSPEs nanoparticles into the HeLa cells [17]. ROS production in a cell is dependent on its stress levels, and may even induce cell death. HeLa and MCF7 cells incubated 20μg/ml of O-GNR-PEG-DSPE solution for 2 hours (ROS production under stress starts immediately, and can be quantified within 1–2 hours) showed similar ROS production (Supplementary section 6 and Figure S6). Thus, ROS generation may not be the major reason for observed differences in cytotoxicity between the HeLa cells and other cell lines. Depletion of the nutrients in the culture media due to the presence of carbon nanotubes has been shown in some reports to be another reason for the observed cytotoxicity [27, 28]. To test this hypothesis, 100μg/ml of O-GNR-PEG-DSPE solution was added to the cell culture media for 48 hours. O-GNR-PEG-DSPEs were removed by high speed ultra-centrifugation, and the media was used to culture SKBR3, MCF7, and HeLa cells. All the cells showed normal growth without any signs of cytotoxicity (Supplementary section 7 and Figure S7). Thus, the observed differences in cytotoxicity for the HeLa cells, and other cell lines cannot be attributed to the depletion of media nutrients
Greater cellular uptake of the O-GNR-PEG-DSPEs nanoparticles into the HeLa cells and their unfavorable interactions with the cell machinery is another possible explanation and TEM results of HeLa or MCF7 cells support this hypothesis. The cellular uptake and localization of the O-GNR-PEG-DSPEs into HeLa, and MCF7 cells investigated by TEM showed that the HeLa cells (Figure 7) uptake greater amounts of O-GNR-PEG-DSPEs compared to MCF7 cells (Supplementary Figure S4). MCF7 cells showed little or no uptake (Supplementary Figure S4 AB), and similar results were obtained for the other cell types (SKBR3 and NIH3T3 cells; results not shown). It could also be inferred from the TEM images that HeLa cells possibly uptake O-GNR–PEG-DSPEs through both endocytotic, and macro-pinocytotic pathways (Figure 7A–B). The images also suggest that larger aggregates of O-GNR-PEG-DSPE were being uptaken by the macropinocytotic pathway, while smaller aggregates were uptaken through the endocytotic pathway. The images also show that vesicular structures similar to early endosomes take up the O-GNR-PEG-DSPEs (Figure 7C–D). Early endosomes generally mature to form late endosomes which fuse with the lysosome. However, association of the endosomal vesicles containing O-GNR-PEG-DSPE with any organelles (including lysosome) were not observed after 3 hours of incubation. Also, the O-GNR-PEG-DSPE containing vesicles were not observed inside the nucleus. The morphology of the HeLa cells incubated with the O-GNR-PEG-DSPEs (Figure 7E and F) was similar to cells undergoing necrotic cell death; ruptured cell membrane and swollen vesicles. MCF7 cells incubated with the O-GNR-PEG-DSPEs appear healthy (Supplementary Figure S4D), and do not show any apparent changes in the gross morphology. While the TEM images provide preliminary indications of possible greater uptake and cell death mechanism in HeLa cells in the presence of the O-GNR-PEG-DSPEs, clearly more thorough investigations are needed, and are currently underway to understand both the mechanism of uptake and cell death.
Evaluation of the cyto- and bio-compatibility is necessary to develop any new material for in vivo biomedical applications [29]. Some of these same considerations will influence toxicity of these materials if released to the environment. There is now a wide body of research available that documents the toxicity and cell/tissue responses of carbon nanostructures such as fullerenes, metallofullerenes, and carbon nanotubes (single-walled and multi-walled carbon nanotubes) [11–14]. These reports show that the structure (e.g. spherical, tubular), chemical composition (e.g pristine, functionalized), and synthesis method (e.g. chemical vapor deposition, arc-discharge) are some of key factors that influence the toxicity and tissue response for these carbon nanostructures. For instance, it has been reported that pristine (hydrophobic) fullerenes or carbon nanotubes elicit adverse toxic effects and cell/tissue responses including reactive oxygen stress, inflammation, and immune response while functionalized water-soluble fullerenes and carbon nanotubes mitigate these serious effects [12, 13]. In the case of graphene, relatively little work has been done to assess the toxic effects in vitro [15–17] and in vivo [18, 19] compared to other carbon nanostructures. All these reports are on graphene nanoplatelets prepared by the modified Hummer’s method (oxidation of graphite by potassium permanganate, and strong acids followed by mechanical exfoliation) or variations of this technique. These reports indicate that graphene nanoparticles, depending on their chemical composition and synthesis method, show diverse effects on cells and tissues. Sasidharan et al. report that in vitro pristine thermally-exfoliated graphene and those functionalized with carboxylic acid groups show differential toxic effects. Pristine graphene nanoparticles have cell death 50 values (CD50) of ~50 μg/ml, and functionalized graphene nanoparticles do not possess any toxicity even at 300 μg/ml concentrations. Chang et al. show in vitro that graphene oxide nanoparticles show no cytoxicity at dosages up to 300 μg/ml, and a slight decrease in cell viability above this concentration, which is attributed to oxidative stress. Singh et al. show in vitro that the graphene oxide prepared from potassium chlorate show strong aggregatory response in platelets at concentrations down to 2 μg/ml. Using rodents, Yang et al. and Wang et al. have investigated in vivo toxicity at dosages up to 20 mg/kg of pristine graphene oxide nanoparticles, and those functionalized with water-soluble non-toxic polymer polyethylene glycol. No toxic effect was observed for pristine or functional graphene, nor do they have any adverse reactions on the internal organs at concentrations as high as 20 mg/kg. One should note that it is difficult to compare the cytotoxic effects of O-GNR-PEG-DSPEs with these various in vitro studies, as these studies used different graphene synthesis method, different cell types, and different solubilizing agents for dispersing the graphene nanoparticles. Nevertheless, the results of this study suggest that water-solubilized graphene nanoribbons (O-GNR-PEG-DSPE) prepared from carbon nanotubes have a significantly different toxicity profile compared to graphene nanoplatelets prepared by the modified Hummer’s method or its variation. The results should also provide guidelines on the range of non-toxic concentrations that may be suitable for potential imaging and drug delivery applications. For instance, recent studies show that O-GNRs show promise as advanced contrast agents for magnetic resonance imaging (MRI) [9] such as cellular MRI, wherein cells will be labeled ex vivo with these nanoparticles, and tracked in vivo by MRI. Thus, this study offers insights into the concentration suitable for the ex vivo labeling of cells for this, and other similar applications.
CONCLUSION
O-GNR coated with PEG-DSPE show increased solubility, and stability in biological media. Toxicity screening performed using 5 assays tested (alamar blue, neutral red, trypan blue, LDH release, clonogenic assay and live cell assay) on four cell lines (HeLa, MCF7, SKBR3 and NIH3T3) indicate that O-GNR-PEG-DSPEs have a dose-dependent, time-dependent, and differential cytotoxic effects on the four cell lines. HeLa, exhibited greater toxicity compared to the other cell lines in all 5 assays. TEM images of cell histology specimens show high uptake of the O-GNR-PEG-DSPE formulations into HeLa cells compared to other cells, which show very little or no uptake. The higher uptake affects the cellular machinery of HeLa cells and is the major reason for observed differences in cytotoxicity results between HeLa and other cell lines. The results of this study suggest that O-GNRs synthesized from CNTs have a cell-specific cytotoxic effect and significantly different cytotoxicity profile compared to graphene nanoparticles prepared by the modified Hummer’s method (graphene nanoparticles prepared by oxidation of graphite, and its mechanical exfoliation) or its variations.
Supplementary Material
Acknowledgments
The authors thank Dr. Pramod Avti for helpful discussions and Susan Van Horn (Central Microscopy, Stony Brook University) for her help in Transmission Electron Microscopy. This work was supported by the the National Institutes of Health (grants No. 1DP2OD007394-01), and the Wallace.H.Coulter Foundation.
Footnotes
Publisher's Disclaimer: This is a PDF file of an unedited manuscript that has been accepted for publication. As a service to our customers we are providing this early version of the manuscript. The manuscript will undergo copyediting, typesetting, and review of the resulting proof before it is published in its final citable form. Please note that during the production process errors may be discovered which could affect the content, and all legal disclaimers that apply to the journal pertain.
References
- 1.Novoselov KS, Geim AK, Morozov SV, Jiang D, Zhang Y, Dubonos SV, et al. Electric field effect in atomically thin carbon films. Science. 2004;306:666–9. doi: 10.1126/science.1102896. [DOI] [PubMed] [Google Scholar]
- 2.Liu W, Jackson BL, Zhu J, Miao C-Q, Chung C-H, Park YJ, et al. Large scale pattern graphene electrode for high performance in transparent organic single crystal field-effect transistors. ACS Nano. 2010;4:3927–32. doi: 10.1021/nn100728p. [DOI] [PubMed] [Google Scholar]
- 3.Schedin F, Geim AK, Morozov SV, Hill EW, Blake P, Katsnelson MI, et al. Detection of individual gas molecules adsorbed on graphene. Nat Mater. 2007;6:652–5. doi: 10.1038/nmat1967. [DOI] [PubMed] [Google Scholar]
- 4.Lin Y-M, Valdes-Garcia A, Han S-J, Farmer DB, Meric I, Sun Y, et al. Wafer-scale graphene integrated circuit. Science. 2011;332:1294–7. doi: 10.1126/science.1204428. [DOI] [PubMed] [Google Scholar]
- 5.Sordan R, Traversi F, Russo V. Logic gates with a single graphene transistor. Appl Phys Lett. 2009;94:073305–3. [Google Scholar]
- 6.Sun X, Liu Z, Welsher K, Robinson J, Goodwin A, Zaric S, et al. Nano-graphene oxide for cellular imaging and drug delivery. Nano Res. 2008;1:203–12. doi: 10.1007/s12274-008-8021-8. [DOI] [PMC free article] [PubMed] [Google Scholar]
- 7.Huang PXC, Lin J, Wang C, Wang X, Zhang C, Zhou X, Guo S, Cui D. Folic acid-conjugated graphene oxide loaded with photosensitizers for targeting photodynamic therapy. Theranostics. 2011:240–50. doi: 10.7150/thno/v01p0240. [DOI] [PMC free article] [PubMed] [Google Scholar]
- 8.Yang X, Zhang X, Ma Y, Huang Y, Wang Y, Chen Y. Superparamagnetic graphene oxide-Fe3O4 nanoparticles hybrid for controlled targeted drug carriers. J Mater Chem. 2009;19:2710–4. [Google Scholar]
- 9.Paratala BS, Jacobson BD, Kanakia S, Francis LD, Sitharaman B. Physicochemical characterization, and relaxometry studies of micro-graphite oxide, graphene nanoplatelets, and nanoribbons. PLoS One. 2012;7:e38185. doi: 10.1371/journal.pone.0038185. [DOI] [PMC free article] [PubMed] [Google Scholar]
- 10.Geim AK, Novoselov KS. The rise of graphene. Nat Mater. 2007;6:183–91. doi: 10.1038/nmat1849. [DOI] [PubMed] [Google Scholar]
- 11.Nakamura E, Isobe H. Functionalized fullerenes in water. The first 10 years of their chemistry, biology, and nanoscience. Acc Chem Res. 2003;36:807–15. doi: 10.1021/ar030027y. [DOI] [PubMed] [Google Scholar]
- 12.Sitharaman B, Wilson LJ. Gadofullerenes and gadonanotubes: A new paradigm for high-performance magnetic resonance imaging contrast agent probes. J Biomed Nanotechnol. 2007;3:342–52. [Google Scholar]
- 13.Lacerda L, Bianco A, Prato M, Kostarelos K. Carbon nanotubes as nanomedicines: From toxicology to pharmacology. Adv Drug Deliv Rev. 2006;58:1460–70. doi: 10.1016/j.addr.2006.09.015. [DOI] [PubMed] [Google Scholar]
- 14.Liu Z, Tabakman S, Welsher K, Dai H. Carbon nanotubes in biology and medicine: In vitro and in vivo detection, imaging and drug delivery. Nano Res. 2009;2:85–120. doi: 10.1007/s12274-009-9009-8. [DOI] [PMC free article] [PubMed] [Google Scholar]
- 15.Singh SK, Singh MK, Nayak MK, Kumari S, Shrivastava S, Grácio JJA, et al. Thrombus inducing property of atomically thin graphene oxide sheets. ACS Nano. 2011;5(6):4987–96. doi: 10.1021/nn201092p. [DOI] [PubMed] [Google Scholar]
- 16.Sasidharan A, Panchakarla LS, Chandran P, Menon D, Nair S, Rao CNR, et al. Differential nano-bio interactions and toxicity effects of pristine versus functionalized graphene. Nanoscale. 2011;3:2461–4. doi: 10.1039/c1nr10172b. [DOI] [PubMed] [Google Scholar]
- 17.Chang Y, Yang S-T, Liu J-H, Dong E, Wang Y, Cao A, et al. In vitro toxicity evaluation of graphene oxide on A549 cells. Toxicol Lett. 2011;200:201–10. doi: 10.1016/j.toxlet.2010.11.016. [DOI] [PubMed] [Google Scholar]
- 18.Yang K, Wan J, Zhang S, Zhang Y, Lee S-T, Liu Z. In vivo pharmacokinetics, long-term biodistribution, and toxicology of PEGylated graphene in mice. ACS Nano. 2010;5:516–22. doi: 10.1021/nn1024303. [DOI] [PubMed] [Google Scholar]
- 19.Wang K, Ruan J, Song H, Zhang J, Wo Y, Guo S, et al. Biocompatibility of graphene oxide. Nanoscale Res Lett. 2011;6:8. doi: 10.1007/s11671-010-9751-6. [DOI] [PMC free article] [PubMed] [Google Scholar]
- 20.Hummers W, Offeman R. Preparation of graphitic oxide. J Am Chem Soc. 1958;80:1339. [Google Scholar]
- 21.Kosynkin DV, Higginbotham AL, Sinitskii A, Lomeda JR, Dimiev A, Price BK, et al. Longitudinal unzipping of carbon nanotubes to form graphene nanoribbons. Nature. 2009;458:872–6. doi: 10.1038/nature07872. [DOI] [PubMed] [Google Scholar]
- 22.Miyazaki HOS, Sato T, Tanaka S, Goto H, Kanda A, et al. Inter-layer screening length to electric field in thin graphite film. Appl Phys Express. 2008;1:034007. [Google Scholar]
- 23.Lewinski N, Colvin V, Drezek R. Cytotoxicity of nanoparticles. Small. 2008;4:26–49. doi: 10.1002/smll.200700595. [DOI] [PubMed] [Google Scholar]
- 24.Franken NAP, Rodermond HM, Stap J, Haveman J, van Bree C. Clonogenic assay of cells in vitro. Nat Protoc. 2006;1:2315–9. doi: 10.1038/nprot.2006.339. [DOI] [PubMed] [Google Scholar]
- 25.Clothier RH, Beed M, Samson R, Ward R. An in vitro approach to the evaluation of repeat exposure in the prediction of toxicity. Toxicol In Vitro. 1997;11:679–82. doi: 10.1016/s0887-2333(97)00083-0. [DOI] [PubMed] [Google Scholar]
- 26.Doak SH, Griffiths SM, Manshian B, Singh N, Williams PM, Brown AP, et al. Confounding experimental considerations in nanogenotoxicology. Mutagenesis. 2009;24:285–93. doi: 10.1093/mutage/gep010. [DOI] [PubMed] [Google Scholar]
- 27.Guo L, Von Dem Bussche A, Buechner M, Yan A, Kane AB, Hurt RH. Adsorption of essential micronutrients by carbon nanotubes and the implications for nanotoxicity testing. Small. 2008;4:721–7. doi: 10.1002/smll.200700754. [DOI] [PMC free article] [PubMed] [Google Scholar]
- 28.Liu J, Yang L, Hopfinger AJ. Affinity of drugs and small biologically active molecules to carbon nanotubes: A pharmacodynamics and nanotoxicity factor? Mol Pharm. 2009;6:873–82. doi: 10.1021/mp800197v. [DOI] [PMC free article] [PubMed] [Google Scholar]
- 29.Williams DF. On the mechanisms of biocompatibility. Biomaterials. 2008;29:2941–53. doi: 10.1016/j.biomaterials.2008.04.023. [DOI] [PubMed] [Google Scholar]
Associated Data
This section collects any data citations, data availability statements, or supplementary materials included in this article.


