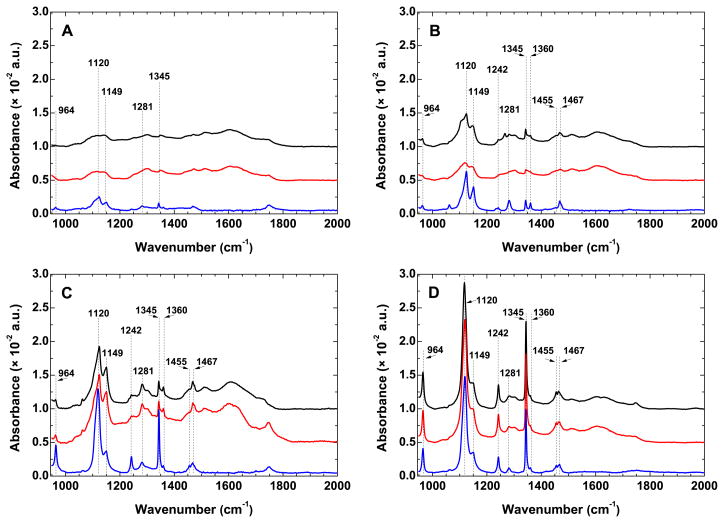
Figure 2.
IRRAS spectra in the fingerprint and amide I regions of PEO layers with different number average molecular weights: (A) 2000, (B) 5000, (C) 10000, and (D) 20000. PEO-N(H)-PDA (black), PEO-S-PDA (red), and PEO-S (blue) anchoring on gold are shown. Thicknesses and surface-related parameters of the layers are summarized in Table 1.

