Abstract
Purpose
In order for spatiotemporal analysis to become a relevant clinical tool, it must be applied to human vocal fold vibration. Receiver operating characteristic (ROC) analysis will help assess the ability of spatiotemporal parameters to detect pathological vibration.
Materials and Methods
Spatiotemporal parameters of correlation length and entropy were extracted from high speed videos of 124 subjects, 67 without vocal fold pathology and 57 with either vocal fold polyps or nodules. Mann-Whitney rank sum tests were performed to compare normal vocal fold vibrations to pathological vibrations, and ROC analysis was used to assess the diagnostic value of spatiotemporal analysis.
Results
A statistically significant difference was found between the normal and pathological groups in both correlation length (P < 0.001) and entropy (P < 0.001). ROC analysis showed area under the curve (AUC) of 0.85 for correlation length, 0.87 for entropy, and 0.92 when the two parameters were combined. A statistically significant difference was not found between the nodules and polyps groups in either correlation length (P = 0.227) or entropy (P = 0.943). ROC analysis showed AUC of 0.63 for correlation length and 0.51 for entropy.
Conclusions
Although they could not effectively distinguish vibration of vocal folds with nodules from those with polyps, the spatiotemporal parameters correlation length and entropy exhibit the ability to differentiate normal and pathological vocal fold vibration, and may represent a diagnostic tool for objectively detecting abnormal vibration in the future, especially in neurological voice disorders and vocal folds without a visible lesion.
Keywords: Spatiotemporal analysis, vocal fold nodules, vocal fold polyps, ROC analysis
INTRODUCTION
The ability to measure and observe vocal fold vibration is essential to diagnosing and understanding vocal fold pathologies. Much can be learned from acoustic measurement and aerodynamic evaluation of the voice, but the need to visualize the vocal folds is imperative. Visualization of the vocal folds allows us to determine the etiology of the change in the acoustic or aerodynamic measurement and delineate an effective treatment plan for the patient. Pathologies such as vocal fold paralysis, nodules, Reinke’s Edema, and many others may be difficult to diagnose without the use of vocal fold visualization. In the present study, we focus on vocal fold nodules and polyps. Both nodules and polyps can be caused by vocal fold irritation or trauma and have roughly the same visual appearance [1]. Discriminating between the two pathologies has typically been done on a basis of size; polyps being larger and typically unilateral and nodules being smaller and typically bilateral [1,2]. It has been suggested by Colton, Woo, Brewer et al. [1] that the two pathologies may share etiology since polyps may represent an advanced stage of nodules that have been continually irritated or traumatized. Through vocal fold visualization, the vibratory properties of the vocal folds can be used to understand the changes due to vocal fold pathology [3].
High-speed digital imaging (HSDI)allows for the visualization and analysis of individual vibrations of the vocal folds regardless of the presence of pathology or aperiodicity. New methods of edge detection and video extraction have made the use of objective parameters from HSDI more clinically feasible than previous analysis methods which were too time consuming to perform as a part of routine practice. The edge detection algorithm proposed by Zhang, Bieging, Tsui et al. [4] allows vocal fold vibratory patterns to be extracted faster and more accurately than previous methods such as the histogram method [5] and active contour [6]. During glottal closure, a contrast no longer exists between the glottis and the surrounding tissues. As a result, neither the histogram nor the active contour method scan accurately distinguish surrounding tissue as the glottis. The method from Zhang, Bieging, Tsui et al. [4] does not experience this drawback. Additionally, it reduces computation time while providing a more accurate portrayal of vocal fold vibration.
Spatiotemporal analysis of HSDI has recently been proposed as a valid method of extracting more information from high speed digital images to describe vocal fold movement during phonation [7–9]. As the name implies, spatiotemporal analysis extracts the dynamics of the vocal fold along its entire length as well as through time. This is in contrast to kymography where only a single line of pixels from a video is analyzed through time. Spatiotemporal analysis allows researchers to understand the interrelationships between different parts along the anterior-posterior axis of the vocal folds [10]. Two relatively unexplored spatiotemporal parameters that provide important information about vocal fold vibration are correlation length and entropy. These two parameters were introduced by Zhang and Jiang [11] and describe both the correlation of vocal fold vibration between the midline and all other points along the anterior-posterior axis and the amount of disorder present in the vibratory activity, respectively. Pathological voices typically have higher entropy values and lower correlation length values than healthy voices.
Traditional diagnosis of nodules and polyps has been performed using head and neck examination in conjunction with patient history and endoscopy [12]. Both diseases manifest themselves in patients as chronic hoarseness and discomfort. Nodules are typically characterized by symmetric, bilateral epithelial swelling and decreased glottal closure as a result of increased vocal fold mass and interruption of vibration [13]. Polyps are typically unilateral and show more pronounced disruption of phonation than nodules. Both pathologies are treated first with behavioral modification and if improvement is not observed, surgical intervention is often the next step [12]. Sulica and Behrman [14] note that clinicians are more likely to treat polyps surgically than nodules. Because the two lesions are treated differently in some circumstances, it may be helpful to differentiate between them via analysis of high speed videos. This differentiation would be most beneficial when reactive lesions develop contralaterally to a vocal fold polyp because it could be confused with nodules.
Differentiation of normal voices from pathological voices based on spatiotemporal parameters of vocal fold vibration represents a potential advance in diagnosis because it allows for the quantitative analysis of pathologies which have traditionally been diagnosed subjectively. Current clinical practice requires visualization of the vocal folds to identify a suspected vocal fold lesion. Therefore obtaining high speed video of the vibrating vocal folds for analysis would require only a minute increase in workload to the physician and no increased discomfort of the patient.
Little research has been dedicated to a quantitative understanding of the spatiotemporal changes inherent in pathological larynges. Several studies using excised canine larynx set ups found that pathological larynges have higher entropy values and lower correlation length values than normal larynges [8,9,11]. In our experiment we seek to evaluate the utility of spatiotemporal analysis as a tool clinicians can use to distinguish between normal and pathological vocal folds in humans. ROC analysis of the spatiotemporal parameters correlation length and entropy will assess their diagnostic potential. These parameters may increase the level of objectivity in laryngeal pathology diagnosis, which may, in turn, increase the quality of patient care.
MATERIALS AND METHODS
124 subjects, 78 females and 46 males ranging from age 16 to 75 with a mean age of 43, were used in this study. Of the 78 female subjects, 20 had vocal fold nodules, 14 had a unilateral polyp, and 44 had normal vocal folds. Of the 46 male subjects, 0 had vocal fold nodules, 23 had a unilateral polyp, and 23 had normal vocal folds. Diagnoses were made by an attending physician and were based on the subject’s medical history and an endoscopic examination of the vocal folds. This study was conducted under the approval of the Institutional Review Board of the University of Wisconsin-Madison and the Ethics Committee of the Fudan University Eye, Ear, Nose, and Throat Hospital.
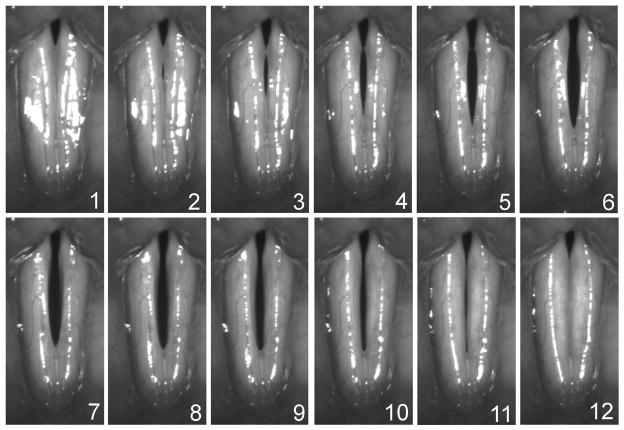
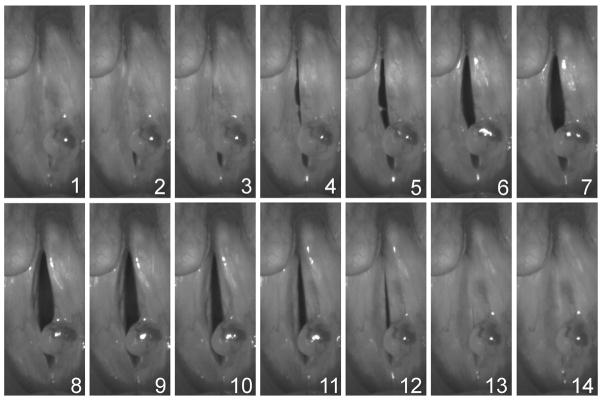
A high-speed camera (KayPENTAXFastcam MC2, Lincoln Park, NJ) was used to collect high-speed images of the vocal folds at a frame rate of 4000 frames per second and a resolution of 512 × 256 pixels. Images were obtained with a rigid 70° endoscope (Kay Elemetrics Model 9106, Lincoln Park, NJ) with a 300-W cold light source. The rigid laryngoscope was coupled to the high-speed digital camera head and endoscopy was performed as in conventional video stroboscopy. The phonatory task was consistent for all recordings. Subjects produced an open vowel /i/ for 4 seconds at a comfortable effort. Figs. 1 and 2 display sequences of images from one cycle of vibration in normal and pathological voices, respectively.
Fig. 1.
Sequence of high speed videoendoscopic images of normal vocal fold vibration. The top and bottom of each image correspond with the posterior and anterior ends of the vocal folds, respectively.
Fig. 2.
Sequence of high speed videoendoscopic images of pathological vocal fold vibration. A polyp is visible on the left vocal fold. The top and bottom of each image correspond with the posterior and anterior ends of the vocal folds, respectively.
A custom-designed MATLAB program (version 7.2.0.232 (R2006a), The Mathworks, Inc., Natick, MA) was used to crop the field of view in the videos to reduce the amount of visible superficial surrounding tissue. Sections of these videos (800–1000 frames in length) with minimal camera movement and sufficient lighting were chosen for automated edge detection. The MATLAB program uses a pixel threshold edge detection method [4] to count the number of pixels in the glottis for each line of pixels perpendicular to the glottal axis in each frame. Because the lighting conditions change from recording to recording, an appropriate threshold for edge detection was determined for each video. In each frame, pixels with intensity greater than the threshold were considered to be tissue of the larynx illuminated by the light source, and those with sub-threshold intensity were considered to be the glottis. A MATLAB program was designed to count the pixels composing the glottal width at each pixel line of each frame. The data are stored as a 2-D matrix with the i-index as frame number, j-index as anterior-posterior position (in pixels) and the glottal width as the elements. The data were visualized by plotting time and spatial position (anterior-posterior) on the x and y-axes, respectively. Glottal width was color-mapped to the z-axis. Red denotes maximum glottal width, blue represents minimum glottal width, and intervening colors represent intermediate degrees of glottal width. Fig. 3 explains the features of a typical spatiotemporal plot of a single cycle of vibration in a normal subject. Numbers displayed in the figure refer to stages within the vibratory cycle shown in Fig. 1. Stages 1 and 12 fall during the closed phase, and as a result, the spatiotemporal plot is dark blue at all spatial positions except the posterior glottal chink. Stages 4 and 10 occur during the early and late open phases, respectively. The light blue and green colors at these stages reflect the fact that glottal width is at an intermediate stage between maximum opening and maximum closure. Stage 7 falls at the maximum opening time of the vocal folds, and therefore, the spatiotemporal plot is red at most of the central spatial positions. From the 2-D matrix, the spatiotemporal parameters of correlation length and entropy were calculated. Correlation length refers to the percentage of pixel lines perpendicular to the glottal axis whose pattern of opening and closing correlates with the vocal fold midline at a level of 90% or greater, as determined by the following calculations. Entropy refers to the amount of disorder present in the signal. Both parameters were defined previously by Zhang and Jiang [11]. Selecting video samples with minimal camera movement and shadows is important for the accuracy of the spatiotemporal parameters of correlation length and entropy. Camera movement and shadows affect the pixel light intensity which plays an integral part in the determination of edges and glottal width. Because spatiotemporal parameters are calculated using glottal width and edge detection information, excessive camera movement and shadows can lead to inaccurate results.
Fig. 3.
Conceptual explanation of the properties of the spatiotemporal pattern in a single cycle of normal vocal fold vibration. The numbers refer to stages within the single cycle of vibration shown in Fig. 1.
Briefly, we calculated the cross correlation function as
| (1) |
where δu(i, t) = u(i, t) − 〈u(i, t)〉 and 〈•〉 denotes the time average. Cmax (i, j) represents the maximal value of C(i, j, τ) with respect to the delay time τ. We placed the spatial reference point at the center of the glottis and defined the correlation length as
| (2) |
where Lg denotes the glottal length. i1 and i2 represent the two spatial points at which Cmax (i1) and Cmax (i2) are decreased to 0.9 with respect to the reference point. Correlation length L measures the size of the spatially correlated structure. A higher value of L corresponds to a larger size of the spatially ordered pattern. Data with complete spatial consistency has L = 1; however, the correlation length of random spatiotemporal data approaches zero since any two spatial points are uncorrelated. In order to further quantify the spatiotemporal complexity of the vocal fold vibrations, we apply eigenmode analysis via Karhunen-Loeve decomposition (KLD). KLD decomposes the input data of a spatially extended system into an orthonormal set of eigenmodes. For the vibratory signal u(j,t) extracted with high-speed digital imaging, we can calculate the spatial covariance matrix as
| (3) |
where i, j = 1,2,···, N is the spatial index.Cij is a symmetric matrix whose eigenvalue λj and eigenvector Qj satisfy CQj = λjQj. The eigenvalue λj measures the energy captured by the corresponding eigenvectors Qj. The relative energy Ek of the k-th eigenmode can be described as and the global entropy S can be calculated as
| (4) |
Entropy measures the degree of disorder of a spatiotemporal pattern. Entropy is low for ordered spatiotemporal behavior with the main energy concentrated in the first few modes. For spatiotemporal data with uniform spatial distribution, S = 0 shows that only one eigenmode with energy E1 =1 is needed to describe the dynamics. For a random spatiotemporal pattern, the entropy approaches 1 and the energies are equally spread across all eigenmodes. The entropy of a spatiotemporal chaotic system is by definition between 0 and 1. The derivations of the above equations can be found in our previous studies [8,11].
Mann-Whitney Rank Sum tests were performed to compare the normal, nodules, and polyps groups with one another based on correlation length and entropy using Sigma Plot 11.0 (Systat Software, Inc., San Jose, CA). Receiver operating characteristic analysis was used to determine the diagnostic potential for correlation length and entropy parameters to distinguish between normal, nodules, and polyps groups.
RESULTS
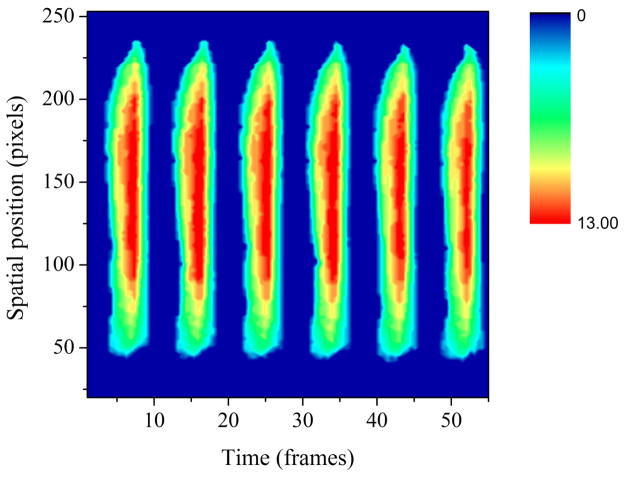
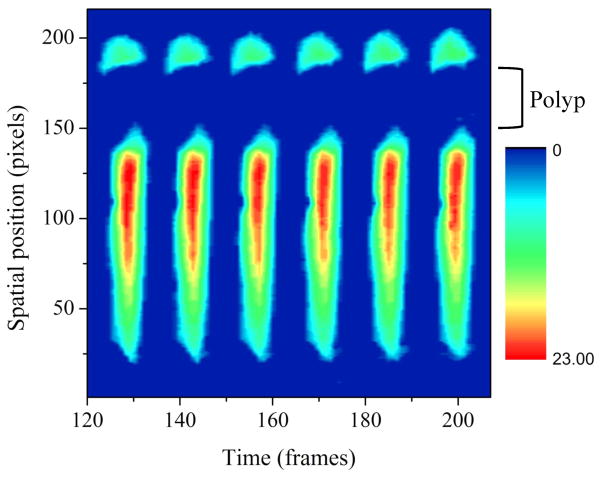
Fig. 4 shows the spatiotemporal pattern of normal vocal fold vibration. The periodicity and symmetry of the spatiotemporal pattern in Fig. 4 are typical of normal phonation. Fig. 5 displays a spatiotemporal pattern from a patient with vocal fold polyps. The dark blue space between pixel lines 140 and 170 indicates a lack of glottal opening in the area of the polyp.
Fig. 4.
Representative example of a spatiotemporal pattern from the normal group.
Fig. 5.
Representative example of a spatiotemporal pattern from the polyps group.
Fig. 6 displays the results of a Mann-Whitney Rank Sum test comparing correlation length in the normal group with both the nodules and the polyps groups, as well as the combination of the two, referred to as the pathological group. The mean correlation length (and standard deviation) of the normal, pathological, nodules, and polyps groups are: 0.788 (0.131), 0.431 (0.296), 0.491 (0.275), and 0.399 (0.305), respectively. The normal group was significantly greater than each other group, with a p-value of less than 0.001 in each case.
Fig. 6.
Bars represent the mean correlation length of each subject group. Error bars represent the standard deviation. Individual p-values reflect the results of a Mann-Whitney Rank Sum test comparing each respective group to the normal group.
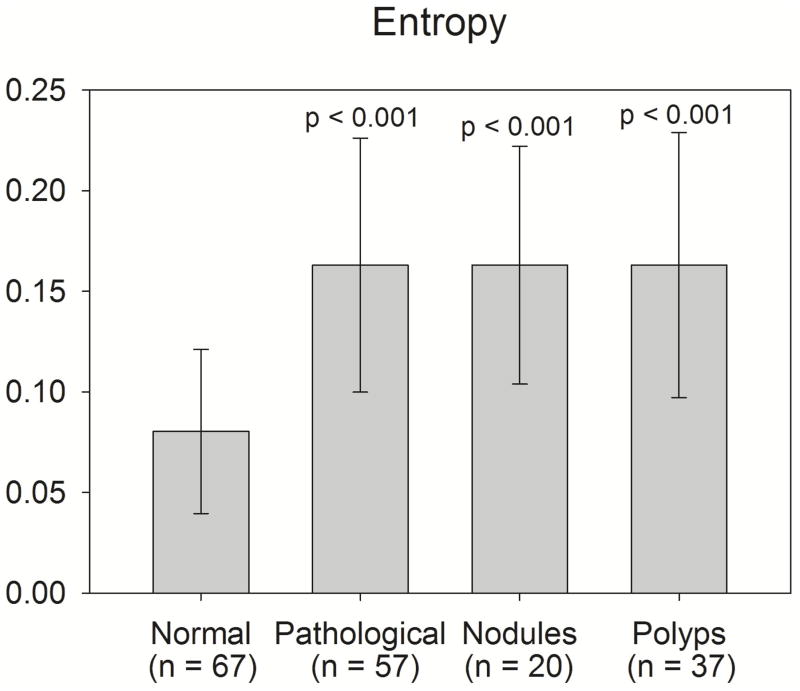
Fig. 7 displays the results of a Mann-Whitney Rank Sum test comparing entropy in the normal group with the following groups: pathological, nodules, and polyps. The mean entropy (and standard deviation) of the normal, pathological, nodules, and polyps groups are: 0.080 (0.041), 0.163 (0.063), 0.163 (0.059), 0.163 (0.066), respectively. The normal group was significantly less than each other group, with a p-value of less than 0.001 in each case. Mann-Whitney Rank Sum tests comparing the nodules group with the polyps group revealed no significant differences in correlation length (p = 0.227) or entropy (p = 0.943).
Fig. 7.
Bars represent the mean entropy of each subject group. Error bars represent the standard deviation. Individual p-values reflect the results of a Mann-Whitney Rank Sum test comparing each respective group to the normal group.
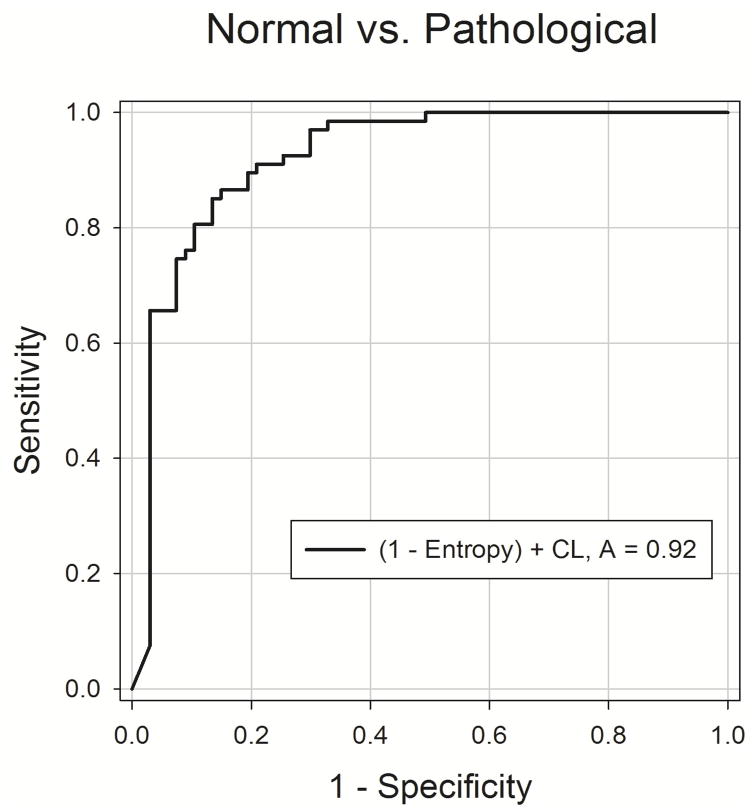
In order to assess the diagnostic utility of entropy and correlation length, an ROC analysis was performed for each parameter. Fig. 8 shows the results of the ROC analysis for each parameter and each group comparison. Comparing normal with pathological voices, using entropy as a diagnostic test resulted in an area under the curve (AUC) of 0.87, and using correlation length resulted in an AUC of 0.85. With the same comparison, combining entropy and correlation length into one diagnostic test resulted in an AUC of 0.92 (Fig. 9). In individual comparisons between the normal group and each pathological group (polyps and nodules), AUC values ranged from 0.86 to 0.90. The comparisons of polyps vs. nodules for both testing modalities demonstrated an AUC value near 0.5, or random guessing.
Fig. 8.
ROC curves describing the individual ability of correlation length and entropy to discriminate between subject groups.
Fig. 9.
ROC curve describing the combined ability of correlation length and entropy to discriminate between the normal and pathological groups.
DISCUSSION
The utility of a new diagnostic parameter relative to the current gold standard can be assessed by ROC analysis. Since entropy and correlation length have not been used extensively to differentiate normal from diseased voices, it would be difficult to obtain enough samples to come up with a single threshold to distinguish normal vocal folds from pathological vocal folds with sufficient sensitivity and specificity. ROC analysis tests each data-point as a cutoff above which or below which a vocal fold would be considered diseased. The sensitivity and specificity for each cutoff is calculated and plotted. The area under the ROC curve (AUC) reveals information about the utility of the test. A perfect test would have an AUC of 1.0 meaning that regardless of the cutoff chosen for the test, it would always have 100% sensitivity and specificity. An AUC of .5 indicates that the test is equivalent to randomly guessing.
Our analysis evaluated the utility of distinguishing normal from pathological vocal folds, normal from vocal folds with nodules, normal from vocal folds with polyps, and vocal folds with polyps from those with nodules based on entropy and correlation length. The results demonstrated that either test could distinguish normal vocal fold vibration from pathological vocal fold vibration with adequate sensitivity and specificity.
Additionally, an analysis was performed that summed correlation length and 1 – Entropy. This was done because entropy and correlation length have the same inputs; therefore, no marginal effort is required to perform both tests as opposed to one test alone. Each parameter is bound between 0 and 1, so they were weighted equally in the new analysis. Combining the tests in this manner improved the AUC from .87 and .85 for entropy and correlation length alone, respectively, to .92 for the summation. This analysis demonstrates the utility of spatiotemporal analysis as a whole to distinguish normal vocal fold vibration from pathological vocal fold vibration.
The clinical impact that spatiotemporal analysis will have on the diagnosis of mass lesions such as late stage polyps and nodules, as was evaluated in this report will be fairly limited. The technique to capture the data for spatiotemporal analysis necessitates vocal fold visualization – a highly sensitive and specific diagnosis method for these late-stage lesions. However, this study represents an important step in quantitatively differentiating the vibration of normal vocal folds from that of diseased vocal folds. As quantitative measures of vocal fold vibration are refined, the techniques will be able to characterize the subtle differences in vocal fold vibration found in neurological voice disorders and other conditions that occur without a visible lesion. Patel, Dailey, and Bless [15] note that high speed video analysis techniques may be especially appropriate for neurological conditions because they often express increased levels of aperiodicity which dramatically decreases the utility of stroboscopic analysis. Further studies must be performed to apply spatiotemporal analysis to neurological disorders.
Our method of using spatiotemporal analysis to differentiate between normal and pathological larynges represents a new diagnostic instrument. Most previous analysis of high speed videos required physicians to make subjective diagnoses. As shown in Fig.1 and 2, normal and pathological vocal folds may exhibit perceivable differences. However, our method also introduces a new quantitative measure of vocal fold pathology. Quantitative and objective analysis methods may reduce the amount of training necessary to interpret high speed video of vocal fold vibration or minimize the number of diagnostic mistakes due to lack of adequate training. Although experienced otolaryngologists are capable of distinguishing normal and pathological vibration via visualization in most cases, a systematic and objective method of high speed video analysis may reduce the amount of viewing time necessary to make a clinical decision, especially in cases with high levels of aperiodicity [15]. Quantitative methods may also be useful for keeping records and making detailed comparisons between several patient visits to the clinic. While previous studies have used spatiotemporal analysis in excised larynx setups [8,11], the present study investigates spatiotemporal parameters in high speed videos of human vocal fold vibration and correlates more directly with the ultimate intended application of this type of analysis.
Our method possesses some inherent limitations that we aim to address in future studies. The calculation of correlation length and entropy is vulnerable to the effects of camera movement and shadows. Camera movement may induce artificially high entropy and low correlation length values. The middle pixel line and those that it is compared with will have unstable glottal width recordings, and portions of the glottis may even move out of the frame depending on how extensively the frame is cropped. In this study, sections of videos to be analyzed were selected based on minimal camera movement, but it is almost impossible to completely nullify this effect.
Shadows in the tissue surrounding the vocal folds also present an obstacle to the accurate determination of correlation length and entropy. Most shadows can be eliminated from the final processed image by appropriate cropping and thresholding techniques, but those that persist may be interpreted by the program to be a part of the glottis, thereby overestimating the glottal width at the respective locations. There may be room for improvement in the spatiotemporal analysis program by adding the ability to pinpoint, track, and delete shadows from certain locations in the frame relative to the vocal folds, or by increasing the contrast levels between the glottis and the surrounding shadows that initially had the same black pixel intensity as the glottis. However, most video samples do not need this type of refinement, and an analysis program that performs these functions would not have a major impact on the overall differentiation of nodules and polyps. The area under the curve (AUC) values for ROC analysis attempting to differentiate nodules and polyps was very low in this study with the current spatiotemporal analysis program. It is unlikely that these refinements in the program would bring the AUC values to clinically relevant levels.
Although this study was not able to successfully differentiate vocal fold nodules and polyps using the current spatiotemporal analysis program, it is possible that future studies that modify the program may find more success. Using kymography, Chodara, Krausert, and Jiang [16] found a significant difference in the phase symmetry between the posterior end of the right and left vocal folds in cases of nodules and polyps, with nodules showing more symmetrical vibration than polyps. This difference should be investigated in more detail in future studies, especially with ROC analysis, which was not performed by Chodara, Krausert, and Jiang. The spatiotemporal program could be modified to study only specific sections along the anterior-posterior axis of the vocal folds. This might allow detailed examination of the areas of the vocal folds that yield the largest differences between nodules and polyps. Spatiotemporal analysis may have an advantage over kymography in this situation because it would record activity at every pixel line along the glottal axis in this targeted section of the vocal folds whereas kymography would only record the activity of one pixel line.
Although it can be difficult and uncomfortable for patients with vocal pathology to control their pitch and loudness, the lack of control of these parameters in the phonatory task is another limitation that may have prevented spatiotemporal analysis from reaching its full diagnostic potential in this study. The potential association between spatiotemporal parameters, pitch, and loudness may be a good subject for future study. It is possible that our study underestimates differences in vocal fold vibration between groups because patients were allowed to phonate comfortably. If all patients were required to phonate at exactly the same loudness, it is possible that additional differences in parameters between groups would have been present or that the differences we observed would be magnified due to the likelihood that patients with pathology would need to use more effort and subglottal pressure. Wang, Shau, and Hsiao [17] showed that after surgery to excise polyps, patients exhibited significant decreases in phonation threshold pressure and used less vocal effort. Therefore, patients with vocal fold lesions probably need higher pressures than a normal subject to achieve the same loudness of phonation. If loudness were controlled in this study, the patients with nodules and polyps would have been forced to use more effort and subglottal pressure. Zhang and Jiang [18] reported decreases in the spatiotemporal parameter correlation length and increases in entropy following increases in subglottal pressure. Therefore, if loudness had been controlled in this study, the pathological groups may have seemed even more pathological based on parameter measurements becoming more extreme. In the future, it may be valuable to study these parameters while controlling for loudness to discover whether any additional diagnostic benefit can be gained to separate normal and pathological cases, or even nodules and polyps.
CONCLUSION
Spatiotemporal analysis was performed on high speed videos of human vocal fold vibration in normal subjects and in those with vocal fold pathologies, namely nodules and polyps. The pathological groups showed significantly lower correlation length and higher entropy values than the normal group. Although they could not effectively distinguish vibration of vocal folds with nodules from those with polyps, spatiotemporal parameters of correlation length and entropy exhibit the ability to differentiate between normal and pathological vocal fold vibration and may represent a diagnostic tool for objectively detecting abnormal vibration in the future, especially in neurological voice disorders and vocal folds without a visible lesion.
Acknowledgments
This research was supported by NIH grant number R01 DC008850 from the National Institute on Deafness and Other Communication Disorders.
Footnotes
Publisher's Disclaimer: This is a PDF file of an unedited manuscript that has been accepted for publication. As a service to our customers we are providing this early version of the manuscript. The manuscript will undergo copyediting, typesetting, and review of the resulting proof before it is published in its final citable form. Please note that during the production process errors may be discovered which could affect the content, and all legal disclaimers that apply to the journal pertain.
References
- 1.Colton RH, Woo P, Brewer DW, et al. Stroboscopic signs associated with benign lesions of the vocal folds. J Voice. 1995;9:312–25. doi: 10.1016/s0892-1997(05)80240-1. [DOI] [PubMed] [Google Scholar]
- 2.Wallis L, Jackson-Menaldi C, Holland W, et al. Vocal fold nodule vs. vocal fold polyp: answer from surgical pathologist and voice pathologist point of view. J Voice. 2004;18:125–9. doi: 10.1016/j.jvoice.2003.07.003. [DOI] [PubMed] [Google Scholar]
- 3.Svec JG, Sram F, Schutte HK. Video kymography in voice disorders: what to look for? Ann Otol Rhinol Laryngol. 2007;116:172–80. doi: 10.1177/000348940711600303. [DOI] [PubMed] [Google Scholar]
- 4.Zhang Y, Bieging E, Tsui H, et al. Efficient and effective extraction of vocal fold vibratory patterns from high-speed digital imaging. J Voice. 2010;24:21–9. doi: 10.1016/j.jvoice.2008.03.003. [DOI] [PMC free article] [PubMed] [Google Scholar]
- 5.Yan Y, Chen X, Bless D. Automatic tracing of vocal-fold motion from high-speed digital images. IEEE Trans Biomed Eng. 2006;53:1394–1400. doi: 10.1109/TBME.2006.873751. [DOI] [PubMed] [Google Scholar]
- 6.Kass M, Witkin A, Terzopoulos D. Snakes: active contour models. Int J Comput Vision. 1988;1:321–31. [Google Scholar]
- 7.Neubauer J, Mergell P, Eysholdt U, et al. Spatio-temporal analysis of irregular vocal fold oscillations: biphonation due to desynchronization of spatial modes. J AcoustSoc Am. 2001;110:3179–92. doi: 10.1121/1.1406498. [DOI] [PubMed] [Google Scholar]
- 8.Zhang Y, Jiang JJ, Tao C, et al. Quantifying the complexity of excised larynx vibrations from high-speed imaging using spatiotemporal and nonlinear dynamic analyses. Chaos. 2007;17:043114. doi: 10.1063/1.2784384. [DOI] [PubMed] [Google Scholar]
- 9.Zhang Y, Jiang JJ. Asymmetric spatiotemporal chaos induced by a polypoid mass in the excised larynx. Chaos. 2008;18:043102. doi: 10.1063/1.2988251. [DOI] [PMC free article] [PubMed] [Google Scholar]
- 10.Schwarz R, Dollinger M, Wurzbacher T, et al. Spatio-temporal quantification of vocal fold vibrations using high-speed videoendoscopy and a biomechanical model. J AcoustSoc Am. 2008;123:2717–32. doi: 10.1121/1.2902167. [DOI] [PubMed] [Google Scholar]
- 11.Zhang Y, Jiang JJ. Spatiotemporal chaos in excised larynx vibrations. Phys Rev E Stat Nonlin Soft Matter Phys. 2005;72:035201. doi: 10.1103/PhysRevE.72.035201. [DOI] [PubMed] [Google Scholar]
- 12.Johns MM. Update on the etiology, diagnosis, and treatment of vocal fold nodules, polyps, and cysts. Curr Opin Otolaryngol Head Neck Surg. 2003;11:456–61. doi: 10.1097/00020840-200312000-00009. [DOI] [PubMed] [Google Scholar]
- 13.Altman KW. Vocal fold masses. Otolaryngol Clin North Am. 2007;40:1091–1108. doi: 10.1016/j.otc.2007.05.011. [DOI] [PubMed] [Google Scholar]
- 14.Sulica L, Behrman A. Management of benign vocal fold lesions: a survey of current opinion and practice. Ann Otol Rhinol Laryngol. 2003;112:827–33. doi: 10.1177/000348940311201001. [DOI] [PubMed] [Google Scholar]
- 15.Patel R, Dailey S, Bless D. Comparison of high-speed digital imaging with stroboscopy for laryngeal imaging of glottal disorders. Ann Otol Rhinol Laryngol. 2008;117:413–24. doi: 10.1177/000348940811700603. [DOI] [PubMed] [Google Scholar]
- 16.Chodara AM, Krausert CR, Jiang JJ. Kymographic characterization of vibration in human vocal folds with nodules and polyps. Laryngoscope. 2011 doi: 10.1002/lary.22324. [Epub ahead of print] [DOI] [PMC free article] [PubMed] [Google Scholar]
- 17.Wang TG, Shau YW, Hsiao TY. Effects of surgery on the phonation threshold pressure in patients with vocal fold polyps. J Formos Med Assoc. 2010;109:62–68. doi: 10.1016/s0929-6646(10)60022-8. [DOI] [PubMed] [Google Scholar]
- 18.Zhang Y, Jiang JJ. Spatiotemporal chaos in excised larynx vibration. Phys Rev E Stat Nonlin Soft Matter Phys. 2005;72:035201. doi: 10.1103/PhysRevE.72.035201. [DOI] [PubMed] [Google Scholar]


