

Abstract
Spreading depolarizations are accompanied by transient changes in cerebral blood flow (CBF). In a post-hoc analysis of previously studied control rats we analysed CBF time courses after middle cerebral artery occlusion in the rat in order to test whether intra-ischemic flow, reperfusion, and different parameters of peri-infarct flow transients (PIFTs) (amplitude, number) can predict outcome. Sprague-Dawley rats anesthetized with either halothane (n=23) or isoflurane (n=32) underwent 90-minute filament occlusion of the middle cerebral artery followed by 72 hours of reperfusion. The infarct size was determined by 2,3,5-triphenyltetrazolium chloride staining. Relative CBF changes were monitored by laser Doppler flowmetry at 4–5 mm lateral, and 1–2 mm posterior to Bregma. An additional filament occlusion study (n=12) was performed to validate that PIFTs were coupled to direct current shifts of spreading depolarization. The PIFT-direct current shift study revealed that every PIFT was associated with a negative direct current shift typical of spreading depolarization. Post-hoc analysis showed that the number of PIFTs, especially with the combination of intra-ischemic level of flow, can predict the development of cortical infarcts. These findings show that PIFTs can serve as an early biomarker in predicting outcome in preclinical animal studies.
Keywords: rat, filament occlusion, spreading depolarization, peri-infarct flow transient, reperfusion
1
Despite decades of rigorous research for effective treatment of ischemic stroke, the recanalization of the ischemic brain region via thrombolysis by recombinant tissue plasminogen activator is the only approved treatment in the US and in Europe. Hundreds of phase II and phase III trials have failed despite efficacy of neuroprotective compounds in experimental models. Several systemic reviews have exposed important deficits in the quality of animal research that could be responsible for this translational roadblock including deficits in the statistical analysis, lack of blinding and randomization, deficiencies in reporting and lack of quality control mechanisms (Dirnagl, 2006, Macleod et al., 2009).
Filament occlusion of the middle cerebral artery (MCA) is a well accepted animal model of focal ischemia. Previous studies have demonstrated that factors including rat strain (Aspey et al., 1998), body temperature (Yanamoto et al., 1999), animal age (Spratt et al., 2006), degree of collateralization (Oliff et al., 1995), and suture type (Bouley et al., 2007) contribute to infarct variability. Therefore these factors which may affect stroke severity should be taken into consideration during the design and the execution of animal studies. For example, monitoring changes in cerebral blood flow (CBF) in experiments is recommended for quality control, as the sharp drop in flow indicates successful MCA occlusion (MCAO), and the presence of complete reperfusion can confirm that the occlusion is truly transient. Known phenomena of flow monitoring during focal cerebral ischemia are peri-infarct flow transients (PIFT) which are hemodynamical correlates of spreading depolarization (SD). The characteristics of PIFTs have been described in animal studies of MCAO using laser speckle (LS) and laser Doppler (LD) imaging (Shin et al., 2006, Strong et al., 2007, Luckl et al., 2009, Macleod et al., 2009). Some of these studies report that the morphology of PIFTs show regional heterogeneity and suggest that parameters of these transients can serve as biomarkers in experimental ischemia.
In our early studies with 90 min of filament occlusion in the rat we found that the majority of animals (about 75%) show substantial cortical infarcts in addition to infarcts in the striatum while the remainder develop infarcts in the striatum with only negligible or no injury in the cortex. Similarly, a bimodal outcome has also been reported in patients with MCAO (Ueda et al., 1992). We hypothesize that certain flow parameters (intra-ischemic flow, level of reperfusion, the number and the mean amplitudes of PIFTs) collected by a single LD probe can predict this bimodal outcome. Therefore, we have performed a post-hoc analysis of our MCAO studies (study A). Based on findings in 55 filament occluded animals we tested if the flow parameters alone as single markers or in any combinations can predict the presence of cortical infarct. Our secondary aim was to put all of the data into a matrix and find further correlations between outcome and CBF parameters in this large animal pool. The vast majority of the animals in this post-hoc analysis come from pilot studies that were never published.
Since the literature lacks relevant data on the coupling rate between the negative direct current (DC) shift (the gold standard for the recording of spreading depolarization), and the accompanying PIFT, another filament occlusion study (n=12) was performed prospectively in rats to validate that the PIFTs were coupled to typical DC shifts (study B).
2. Experimental Procedures
2.1. Study A
2.1.1. Animal groups
Adult male Sprague-Dawley rats (n=55), underwent 90-minute filament occlusion of the MCA followed by 72 hours of reperfusion. One group (ISO) (n=32) was anesthetized with 1.2% isoflurane and another group (HALO) (n=23) with 1.2% halothane during the ischemic period.
2.1.2. General surgery and filament occlusion
All procedures were approved by the Institutional Animal Care and Use Committee of the University of Pennsylvania. The rats were anesthetized with 4% volatile anesthetics (isoflurane or halothane) for induction and maintained on 1.2–1.5% of the same anesthetic in 70% N2O and 30% O2 during surgery. A polyethylene catheter (PE-50) was placed into the tail artery for arterial blood pressure measurement and blood gas sampling. Blood pressure was continuously monitored using a pressure transducer and recorded on a computer based recording system (PowerLab, ADInstruments, Colorado Springs, CO). Body temperature was monitored by a rectal probe and maintained at 37.2 ± 0.3°C with a heating blanket regulated by a homeothermic blanket control unit (Harvard Apparatus Limited Holliston, MA). Rats were placed into a stereotaxic head holder and the head prepared for monitoring changes in CBF. A LD probe was placed over the ischemic cortex 4–5 mm lateral and 1–2 mm posterior to Bregma. The animal was placed supine on a plastic holder and prepared for MCAO using the intraluminal filament model (Luckl et al., 2009). Briefly, the right common carotid artery (CCA) was isolated from the connective tissue. The right external carotid artery was ligated and a 0.39 mm silicone coated nylon filament (Doccol Corporation, Redlands, CA, USA) was inserted through the CCA into the internal carotid artery. The filament was advanced until LD flowmetry indicated adequate MCA occlusion by a sharp decrease in ipsilateral blood flow. After 90 minutes of occlusion the filament was gently removed and proper reperfusion was monitored by LD for an additional 10 minutes.
2.1.3. Laser Doppler Flowmetry
Residual flow during ischemia (0–90th min) and the reperfusion (0–10th min) was calculated as percentage of baseline prior to MCAO. Criteria for identifying PIFTs have been established previously based on LD recordings with two probes and the comparison of simultaneous LD and LS monitoring during filament MCAO in the rat (Luckl et al., 2008, Luckl et al., 2009): (a) flow transient with amplitude greater than 5% of pre-ischemic baseline; (b) duration of CBF changes longer than 60 s; and (c) stable blood pressure during the event. Since our original description of the criteria for identifying PIFTs we found in a few animals that the amplitudes of PIFTs can also be 3–4% (lower than 5%) in animals with more severe ischemia (intraischemic CBF less than 20%). Similarly to our observation, a 3% amplitude as the lowest threshold was observed in an early paper (Iijima et al., 1992). The identification of the PIFTs was aided by the stereotypical morphology of the flow transients where five different morphologies of PIFTs in rats were seen as described previously (Luckl et al., 2009). The peak-to-peak amplitude was calculated as the percent change in CBF relative to the pre-ischemic baseline.
2.1.4. Infarct volume measurement
Rats were sacrificed 72 hours after MCAO. The brains were removed from the skull, cooled in ice cold saline for 15 minutes, and were sectioned in the coronal plane at 2-mm intervals using a rodent brain matrix. The brain slices were then incubated in 2% 2,3,5-triphenyltetrazolium chloride at 37.0° C. The stained sections were photographed with a digital camera and the infarct size area determined using a computer based image analyzer (AIS 6.0; Imaging Research Inc., St. Catharines, ON, Canada). Lesion volumes in cortex and striatum were calculated by summation of the infarct areas of 6 brain slices integrated by the thickness. The damaged area was calculated by subtracting the area of the normal tissue in the hemisphere ipsilateral to the stroke from the area of the hemisphere contralateral to the stroke with the investigation made blindly. An edema index was calculated from the total volume of the hemisphere ipsilateral to the MCAO and the total volume of the contralateral hemisphere (Yanamoto et al., 1996), a technique validated by a combined MRI/water content study (Gerriets et al., 2004).
2.2. Study B (PIFT-DC potential shift correlation)
2.2.1. General surgery and filament occlusion
Rats (n=12) were anesthetized with 4% isoflurane for induction and maintained on 1.2–1.5% of isoflurane in 70% N2O and 30% O2 during surgery. Filament occlusion and LDF measurements were performed as described above. The DC-electrocorticogram (ECoG) was monitored using two epidural silver chloride electrodes (2 mm and 3 mm posterior to the LD probe) (figure 1) with the reference electrode placed under the skin in the nuchal region. The epidural electrodes were prepared from silver wire flamed to produce a 0.6–0.8 mm diameter spherical tips and then chloridized. The electrodes were placed in burr holes over the dura and connected to a differential amplifier (Jens Meyer, Munich, Germany). Analog-to-digital conversion was performed using a Power 1401 (Cambridge Electronic Design Limited, Cambridge, UK). DC recordings were amplified 50 times, sampled at 200 Hz and filtered with a 1 kHz low pass cut -off. The EEG activity was amplified 2500 times and sampled at 5 kHz with a high pass filter at 1 Hz.
Figure 1.
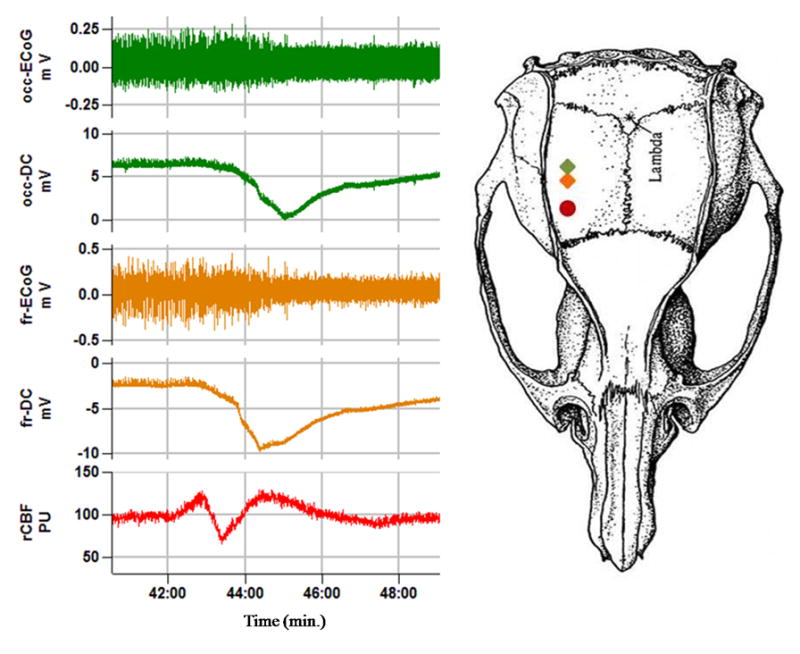
Epidural DC, ECoG and CBF monitoring during filament occlusion. The two silver electrodes (diamond symbols) (frontal (fr) and occipital (occ)) were located two mm caudal to the laser Doppler probe (closed circle) (4–5 lateral, and 1–2 mm posterior to Bregma). PU = perfusion units.
2.2.2 Coupling of spreading depolarization with PIFTs
Spreading depolarizations were identified by a propagating large, negative DC shift. Coupling with PIFT was expressed as the fraction of the total number of negative DC shifts and PIFTs.
2.3. Statistical analysis
Significant differences in the physiological variables, flow parameters, and outcome between anesthetic groups were tested using a two-tailed t-test for two unpaired samples. Animal groups were defined in a scatter plot based on presence or absence of a substantial cortical infarct (figure 2). Analyses were performed using the R Software Environment. Statistical models for single markers as well as for combinations were analyzed using binomial logistic regression (developing a severe cortical infarct – defined as having an infarct size > 80mm2 – used as the response variable). For a single marker, this yields an optimal (with respect to the presented data) point to discriminate between animals with (“ci”) and without (“no”) severe cortical infarct. All data greater (or lower, depending on actual results) than that point would be predicted as “ci”; all other data as “no”. The number of correctly predicted animals (CPA) was calculated based on the discrimination point in order to compare the predictability of the different markers. This model will predict data with more confidence the greater the distance between the data and the discimination point. Using this technique we can calculate borders beyond which the model would predict animals with at least 95% certainty. This is only possible, however, if the discrimination is not “perfect”, i.e. if there are some incorrectly predicted animal, otherwise the model cannot calculate probabilities of errors. This analysis holds for combinations of two markers, also, except that the model discriminates based on a line, not a single point. Whether or not adding another parameter (two-fold combination versus three-fold combination) to a model is useful was calculated using the likelihood ratio test. Correlations between PIFT parameters, residual CBF and outcome were evaluated using Spearman analysis both separately in the HALO and ISO groups as well as in the combined group (ISO+HALO) of animals. Regression analysis was not corrected for multiple testing. Statistical significance was considered when p<0.05 and all data are expressed as mean ± standard deviation.
Figure 2.
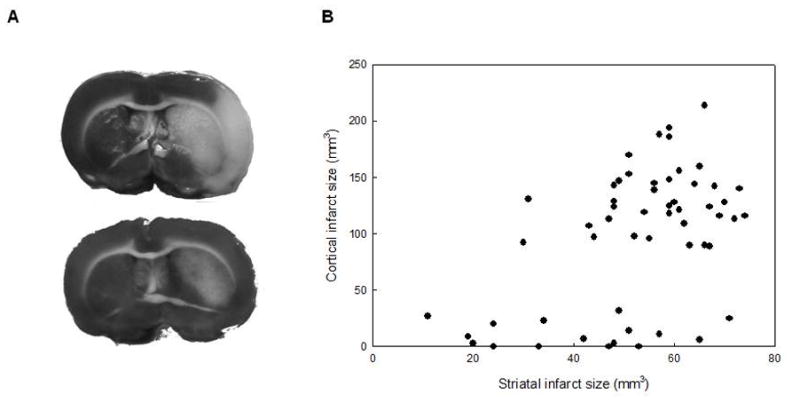
The figure represents the bimodal distribution of the cortical infarct volume. A: TTC stained sections from an animal with substantial cortical infarct (upper image) and from an animal with no cortical infarct (lower image). B: The bimodal distribution of the cortical infarct volume in all (ISO+HALO) of the filament occluded animals.
3. Results
3.1. Physiological variables
All of the physiological parameters were within normal limits both during the surgical preparation and during MCAO in each animal. There were minor differences in systemic pO2, pCO2, and blood pressure between the anesthestic groups (isoflurane (group ISO) vs halothane (group HALO)) of study A (table 1).
Table 1.
Physiological variables during baseline and ischemia (40–50 min).
| Study A | Study B | ||
|---|---|---|---|
|
| |||
| BASELINE | ISO | HALO | ISO |
| MABP (mm Hg) | 103±1 | 93±10* | 112± 9 |
| Temp (°C) | 37.2±0.17 | 37.1±0.4 | 37.1±0.25 |
| pCO2 (mm Hg) | 38.7±3.3 | 42±3.7* | 40.7± 3.3 |
| pO2 (mm Hg) | 119±13 | 111±16* | 127± 25 |
| pH | 7.44±0.03 | 7.42±0.06 | 7.43± 0.02 |
| ISCHEMIA | ISO | HALO | ISO |
| MABP (mm Hg) | 121±11 | 97±13* | 124± 6 |
| Temp (°C) | 37.5±0.27 | 37.4±0.4 | 37.2±0.25 |
| CO2 (mm Hg) | 37.3±3 | 42±3.4* | 42.7± 2.5 |
| pO2 (mm Hg) | 115±15 | 103±12* | 117± 15 |
| pH | 7.45±0.03 | 7.41±0.03 | 7.4± 0.03 |
MABP = Mean arterial blood pressure; Temp = core temperature;
=Significant difference (p<0.05) between isoflurane (ISO) and halothane (HALO) anesthetized animals in study A. Data are mean± SD
3.2. Coupling of spreading depolarization with PIFTs in study B
We collected 46 spreading depolarizations and 41 PIFTs time coupled (coupling rate 89%) in the animals of study B (figure 1). The coupling rate was 76% in animals with intra-ischemic flow lower than 20% of baseline and 97% if the flow remained above 20% of baseline. The post-hoc analysis of the filament occluded animals (study A) contained only four animals with intra-ischemic flow lower than 20%, suggesting a coupling rate of approximately 95% for study A.
3.3. PIFT parameters and outcome
Lesions in the basal ganglia and a substantial cortical infarct (mean of 130–140 mm3 but never less than 89 mm3) were seen in 39 animals (71%). The remainder of the animals (n=16) exhibited only a small or negligible cortical infarct, while the basal ganglia were variably affected by the injury (table 2, figure 2). Table 2 presents the averaged residual CBF, the reperfusion, the parameters of the PIFTs (mean number, amplitude) and the outcome (histology, edema) in different anesthetic groups of study A. These parameters were calculated in subgroups containing animals either with substantial cortical infarcts (ci) or with only a small or negligible cortical infarct (no). Statistical analyses revealed that both the number of PIFTs and the level of reperfusion is significantly higher in the “ci” groups but the significance level is considered only marginal (p<0.05) with the latter marker (table 2).
Table 2.
Flow parameters and outcome measurements in different anesthetic subgroups.
| Anesthesia | rCBF (% of baseline) | Reperfusion (% of baseline) | Flow transients
|
Infarct size (mm3)
|
Edema % | |||
|---|---|---|---|---|---|---|---|---|
| Number of PIFTs | Amplitude (% of baseline) | BG | Cortex | Total | ||||
|
|
|
|
|
|
||||
| ISO (ci) (n=25) |
35±12 | 134±53 | 6.1±2.5 | 14±9.7 | 57±10 | 129±25 | 186±29 | 109±5 |
| ISO (no) (n=7) |
47±16 | 87±30* | 3.3±1.7** | 19±7.9 | 44±19* | 8±8** | 52±24** | 100±1** |
| HALO (ci) (n=14) |
40±13 | 131±31 | 7.4±3.8 | 14±7.7 | 58±10 | 137±37 | 195±39 | 110±6 |
| HALO (no) (n=9) |
45±13 | 103±25* | 3.8±1.4** | 18±3.6 | 38±15** | 13±12** | 51±16** | 102±3** |
ISO=isoflurane, HALO=halothane, ci=substantial cortical infarct, no=small or negligible cortical infarct, BG=basal ganglia.
= Significant difference (p<0.05) between the “ci” and “no” subgroup in the same anesthetic groups.
= Significant difference (p<0.01) between the “ci” and “no” subgroup in the same anesthetic groups. Data expressed as mean± SD
3.4. Logistic regression analyses of single parameters
The results of the regression analyses are summarized in table 3. The analyses revealed that the best single marker is the number of PIFTs in each anesthetic subgroup. For example 45 out of 55 animals can be predicted correctly with the discrimination point of 3.8 in the combined anesthetic group. It is worth noting that setting that discrimination point beyond the range of the data would still yield 39/55 correctly predicted animals in the combined anesthetic group as a “worst case”. The number of correctly predicted animals with other markers such as CBF, reperfusion and amplitudes are usually close to that worst case, therefore these markers are basically not helpful in the separation of animals. In fact, the discrimination point for the amplitude in the ISO group (41%) is beyond the range (4–39%).
Table 3.
Logistic regression analysis of single markers in different anesthetic groups.
| Anesthesia | Flow parameters | Range | Discrimination point | Lower border | Upper border | Ratio of CPA to total number |
|---|---|---|---|---|---|---|
| ISO | CBF % | 9–74 | 62 | 12 | 112 | 26/32 |
| No. of PIFTs | 1–12 | 2.8 | −1.2 | 6.8 | 27/32 | |
| Reperfusion % | 65–302 | 75 | 6 | 144 | 26/32 | |
| Amplitude % | 4–39 | 41 | −15 | 98 | 25/32 | |
|
| ||||||
| HALO | CBF % | 17–76 | 56 | −36 | 149 | 14/23 |
| No. of PIFTs | 2–10 | 5.1 | 2.6 | 7.6 | 20/23 | |
| Reperfusion % | 67–196 | 103 | 21 | 186 | 17/23 | |
| Amplitude % | 5–37 | 20 | −9 | 49 | 15/23 | |
|
| ||||||
| ISO+HALO | CBF % | 9–76 | 59 | 0 | 118 | 41/55 |
| No. of PIFTs | 1–12 | 3.8 | 0.2 | 7.4 | 45/55 | |
| Reperfusion % | 65–302 | 85 | −1 | 171 | 41/55 | |
| Amplitude % | 4–39 | 31 | −18 | 80 | 36/55 | |
Discrimination point distinguishes between animals with and without severe cortical infarct. Borders are parameter values beyond which the model would predict an animal with at least 95% certainty. CBF, amplitude and reperfusion are expressed as percent of pre-ischemic baseline. CPA=correctly predicted animals.
3.5 Logistic regression analyses of combinations of parameters
The results of the regression analyses (6 combinations) in all animals are summarized in figure 3. and the analyses of the ISO and HALO groups (the best 3 correlations of each) are presented in figure 4. The results suggest that the combination of CBF and number of PIFT gives the best prediction in two-fold combinations in each anesthetic subgroup, although there is no difference between the combination of amplitude/No of PIFTs and the CBF/No of PIFTs in the halothane group. It seems that a higher intra-ischemic flow requires more PIFTs for the development of a substantial cortical infarct (figure 3,5). At least 3–4 PIFTs has to occur even in severe ischemia (flow of 20- 30%) in order to see a substantial cortical infarct after 72 hours. The likelihood-ratio test did not show a significant benefit comparing the best two-fold (CBF/number of PIFTs) combination and the variations of the three-fold combinations (CBF/number of PIFTs/Amplitudes; D=2.158, p=0.14) (CBF/number of PIFTs/Reperfusion; D=0.00062, p=0.98)).
Figure 3.

The results of logistic regression analysis in all (ISO+HALO) of the filament occluded animals using two explanatory variables. Open circles represent animals with cortical infarct size larger than 80 mm3 (ci), and the triangles designate animals with negligible cortical infarcts (no) in all panels (A–F).The solid line discriminates “ci” and “no” according to the logistic regression. For example, in panel A all animals above the solid line were predicted as “ci”, and all animals below it were predicted as “no”. Note that in panel A three triangles are above the solid line and two circles are below it, thus CPA=50/55. The dashed lines represent the borders, beyond which the model will predict with at least 95% certainty, for the “ci” and the “no” animals, and if those limits are broad the dashed line may not be shown (Panel C). The CPA is indicated in the upper right corner of each panel.
Figure 4.

The best three of logistic regression analysis in the ISO (A,C,E) and the HALO (B,D,F) subgroups using two explanatory variables. Open circles represent animals with cortical infarct size larger than 80 mm3 (ci), and the triangles designate animals with negligible, cortical infarcts (no) in all panels (A–F). The solid line discriminates “ci” and “no” according to the logistic regression. For example, in panel B all animals above the solid line were predicted as “ci”, and all animals below it were predicted as “no”. However, two triangles are above the solid line and one open circle is below it, thus CPA=20/23. The dashed lines represent the borders, beyond which the model will predict with at least 95% certainty, for the “ci” and the “no” animals, and if those limits are broad the dashed line may not be shown. If the regression analysis is “too good”, i.e. there are not enough incorrectly predicted animals, no robust probabilities for a correct prediction can be calculated (it is about 100%), thus no dashed line is given (Panel A). The CPA is indicated in the upper right corner of each panel.
Figure 5.

Four representative flow time-courses. Panel “A” and “B” show flow traces from animals with low intra-ischemic flow (30%); the animal in panel “A” had 8 PIFTs and a large infarct (116 mm3) while the animal in panel “B” lacks the sufficient number of PIFTs and therefore did not develop a cortical infarct. Panel “C” and “D” present animals with high intra-ischemic (70%) flow. Despite a relatively high intraischemic flow, the animal in panel “C” had 8 PIFTs and showed a substantial cortical infarct (148 mm3), while animal “D” with 4 transients developed only a negligible cortical infarct (14 mm3). Asterisks represent flow transients in each panel.
3.6 Spearman analyses of the data matrix
The Spearman correlation analyses (table 4) were performed both separately in the HALO and the ISO groups as well in the combined group of animals. We discuss only those correlations in the text which are common in each subgroup (ISO, HALO, ISO+HALO) and related to flow parameters: Mean intra-ischemic flow is positively correlated with the mean amplitude of the PIFTs. The amplitude of the PIFTs is negatively correlated with the cortical infarct. The number of PIFTs is positively correlated with cortical infarct, and the degree of edema. It is important to note that the results of the Spearman analysis should be treated carefully, since we did not correct the significance level. However, we provide the raw data (correlations) between the measured flow parameters (number and amplitudes of PIFTs, intraischemic CBF, and reperfusion) and the cortical infarct size (histological outcome) in a separate figure (figure 6.).
Table 4.
The results of Spearman analysis in the isoflurane (
 ), halothane (
 ), and combined (■) group. The “matrix” contains the parameters of the cerebral blood flow (intra-ischemic flow, reperfusion), the flow transients (total number, the mean of amplitudes) and the outcome (striatal and cortical infarct volume, edema).
| Intra-ischemic flow | ||||||
| Number of PIFTs |
+ |
Number of PIFTs | ||||
| Amplitude |
 + + + +■■■ + |
− |
Amplitude | |||
| Infarct striatum | NS |
 + +■■ + |
− ■ − |
Infarct striatum | ||
| Infarct cortex | NS |
+ + ■■■ + |
− − ■■ − |
+ ■■ + |
Infarct cortex | |
| Edema | NS |
+ + ■■ + |
− |
+ ■ + |
 + + + +■■■ + |
Edema |
| Reperfusion | NS |
+ ■■ + |
NS |
+ |
+ ■■ + |
+ ■ + |
,
, ■ p<0.05 (with 0.305 ≤ |ρ| ≤ 0.513);
,
, ■■ p< 0.01 (with 0.379 ≤ |ρ| ≤ 0.695);
,
, ■■■ p<0.0001 (with 0.578 ≤ |ρ| ≤ 0.962); NS. non significant; + positive correlation; − negative correlation
Figure 6.

Correlations (raw data) between the measured flow parameters (number and amplitude of PIFTs, intraischemic CBF, reperfusion) and the cortical infarct size in individual charts (panel A,B,C,D). Closed circles represent the ISO while the open circles designate the HALO animals.
4. Discussion
As discussed above (2.1.3), the criteria for the detection of PIFTs using one LDF probe has been established previously (Luckl et al., 2008, Luckl et al., 2009). In the present study we determined that PIFTs are in fact associated with negative DC shifts typical of spreading depolarization. We found that the average coupling rate between spreading depolarization and PIFT was 89% with a better coupling rate when intra-ischemic flow is higher.
Our primary aim in this study was to investigate if flow parameters (total number and amplitude of flow transients, intraischemic CBF and reperfusion) can be useful as biomarkers in predicting substantial cortical infarct. Previous studies reported that spreading depolarizations play an important role in lesion progression during focal ischemia (Hossmann, 1996, Dijkhuizen et al., 1999, Shin et al., 2006, Nakamura et al., 2010). Similarly, we found in this study that the number of PIFTs in 90 min. ischemia is significantly (p<0.01) higher in animals with substantial cortical infarct. The logistic regression analysis revealed that the number of PIFTs is the single best marker in the prediction of the bimodal outcome. Unfortunately, it does not give a great separation especially in the ISO group (table 3). However, the combination of the flow parameters increases the predictability. The combination of the CBF and the total number of flow transients together seem to be the best predictors (figure 3). A higher intra-ischemic flow required more PIFTs for the development of a substantial cortical infarct. Our results indicate that the penumbral tissue can be at risk even with higher intraischemic rCBF (good collateral supply) when a large number of spreading depolarizations propagate over the territory. Conversely, tissue with severe ischemia can survive if only few spreading depolarizations occur. The likelihood ratio test revealed that the combination of three different markers doesn’t increase the predictability significantly. Although the role of the intraischemic CBF in the concept of viability thresholds (Symon et al., 1977, Mies et al., 1991, Hossmann, 1994, Burnett et al., 2005) and the reperfusion in the pathogenesis of ischemic stroke (Moore and Traystman, 1994, Aronowski et al., 1997) have also been extensively investigated and proven, we did not find these flow parameters as good, early biomarkers in our study.
After finding correlations between the number of flow transients and the histological outcome we presume that the number of animals with negligible cortical infarcts in a given study is probably inversely correlated with the mean number of the flow transients. For example the proportion of the animals without substantial cortical infarct in this study is 16/55 (29%) while this number is only 2/18 (11%) in our chloralose anesthetized animals which underwent the same experimental protocol. The mean number of flow transients (9.8±4.8 vs 5.7±2.5) in our chloralose anesthetized animals is significantly higher (p<0.01) than in the animals in this study. Our observation that anesthesia has an effect on spreading depolarization is in concert with the results of other animal and human studies (Saito et al., 1997, Hertle et al., 2012). We presume therefore that the anesthesia has an effect on the variability of the histological outcome. However, in our experience the mean number of PIFTS, and therefore the proportion of animals without cortical infarct, also shows some variability (10–30%) between different studies with the same anesthetic (ISO). Similarly, the number of flow transients shows a huge inter-animal variability (for example, 1–12 in the ISO animals). We speculate that this difference between animals might also contribute to the well-known inter-laboratory variability in infarct size (Howells et al., 2010). Being aware of the inter-animal variability of the PIFTS we tested in our animals if the physiological variables (pO2, pCO2, blood pressure) show correlations with the number of PIFTs. The statistical analysis did not show significant correlation. Similarly, we did not find a correlation between the pre-occlusion plasma glucose levels (7.1±1.4 mmol/l) levels and the number of PIFTs in the isoflurane anesthetized animals. After reviewing the literature, however, we found that the serum glucose levels might play an important role. Nedergard and Astrup observed a higher incidence of spreading depolarizations in normoglycemic (9.3 mmol/l) rats compared with hyperglycemic (32.5 mmol/l) rats after MCAO (Nedergaard and Astrup, 1986). A significant inverse relationship was found between the mean post-occlusion (3 hours) plasma glucose levels and the number of spreading depolarizations in cats after MCAO (Hopwood et al., 2005). However, other mechanisms related to endogenous neuroprotection for example might also contribute to the inter-animal heterogeneity of PIFTs. The investigation of natural, defensive responses against ischemia has become an important field in stroke research recently. Promising endogenous protectants (HIF1, erythropoietin, granulocyte colony stimulating factor) have already been identified (Kietzmann et al., 2001, Prass et al., 2002, Ruscher et al., 2002, Schneider et al., 2005) and are currently under investigation. The topic of neuroprotection is further complicated by the observations that spreading depolarizations may be beneficial in the healthy surrounding tissue by inducing precondition, facilitating plasticity or by promoting regeneration (Dreier, 2011). This Janus-faced character of SDs needs further investigations.
Based on our results, monitoring CBF changes appears to be very useful in the quality control of experiments. A sharp drop in flow to 20–30% of baseline in this model indicates good MCA occlusion, and successful reperfusion confirms that the occlusion is truly transient. In the clinic, a more realistic early time point for the start of treatment is around 90 min after stroke onset. If this observation is translated to a more clinically relevant animal study, our study provides a relatively simple tool to perform a treatment stratification using the level of intraischemic flow together with the number of PIFTs during the first 90 min after stroke onset. The use of the plot in figure 3 would allow the experimenter to include only those animals that would definitely develop a cortical infarct in the natural course of the disease when no neuroprotectant is given. Hence, the study population would become more homogeneous and fewer animals would be needed.
However, it is important to stress that the present results only apply to the filament occlusion model. In the filament occlusion model (proximal MCAO) we found that the level of CBF in Sprague-Dawley rats is relatively homogenous in the MCA territory accessible after thinning of the calvarium medial to the crista temporalis with spreading depolarizations propagating over the whole penumbral and peri-ischemic area (Luckl et al., 2009). Therefore in filament occlusion, one LD probe at any point of this area is sufficient to record the number of PIFTs. In the model of distal MCAO, however, the tissue immediately medial to the crista seems to be part of the permanently depolarized ischemic core and consequently does not show PIFTs (Luckl et al., 2010). Therefore, in the distal MCAO model the LDF probe should be placed closer to the midline if the experimenter aims to measure the number of PIFTs in the penumbra and peri-ischemic area.
The Spearman analysis revealed that the number of PIFTs correlate with tissue outcome suggesting that monitoring of PIFTs could also be useful to predict outcome measures in clinical studies. Subdural LD monitoring is already used in human studies (Dreier et al., 2009). In the future non-invasive, transcranial optical imaging techniques such as diffuse correlation spectroscopy (Durduran et al., 2010) could be used for this purpose.
5. Conclusions
In summary, this study demonstrates that a single LD probe provides information both on CBF changes and on spreading depolarizations. We provide evidence in a large animal pool that the number of PIFTs and the intra-ischemic CBF together can serve as an early biomarker in predicting outcome and can be useful in the quality control of experimental ischemia. Future human studies could also benefit from detecting flow transients with LD monitoring.
Highlights.
Spreading depolarizations play an important role in lesion progression during stroke.
Peri-infarct flow transients are the flow correlates of spreading depolarizations.
PIFTs along with ischemic blood flow can predict the development of cortical infarcts
PIFTs along with flow can be useful in quality control of preclinical animal studies
Acknowledgments
This study was supported by NIH NS-057400. JPD was supported by grants of the Deutsche Forschungsgemeinschaft (DFG DR 323/3-1), Bundesministerium für Bildung und Forschung (CSB 01 EO 0801, BCCN 01GQ1001C B2) and German Israeli Foundation (124/2008).
Abbreviations
- CBF
cerebral blood flow
- CCA
common carotid artery
- DC
direct current
- ECoG
electrocorticogram
- LD
laser Doppler
- LS
laser speckle
- MCA
middle cerebral artery
- MCAO
middle cerebral artery occlusion
- PIFT
peri-infarct flow transient
- SD
spreading depolarization
Footnotes
Conflict(s) of interest/Disclosure(s)
The authors declare no conflict of interest.
Publisher's Disclaimer: This is a PDF file of an unedited manuscript that has been accepted for publication. As a service to our customers we are providing this early version of the manuscript. The manuscript will undergo copyediting, typesetting, and review of the resulting proof before it is published in its final citable form. Please note that during the production process errors may be discovered which could affect the content, and all legal disclaimers that apply to the journal pertain.
References
- Aronowski J, Strong R, Grotta JC. Reperfusion injury: demonstration of brain damage produced by reperfusion after transient focal ischemia in rats. J Cereb Blood Flow Metab. 1997;17:1048–1056. doi: 10.1097/00004647-199710000-00006. [DOI] [PubMed] [Google Scholar]
- Aspey BS, Cohen S, Patel Y, Terruli M, Harrison MJ. Middle cerebral artery occlusion in the rat: consistent protocol for a model of stroke. Neuropathol Appl Neurobiol. 1998;24:487–497. doi: 10.1046/j.1365-2990.1998.00146.x. [DOI] [PubMed] [Google Scholar]
- Bouley J, Fisher M, Henninger N. Comparison between coated vs. uncoated suture middle cerebral artery occlusion in the rat as assessed by perfusion/diffusion weighted imaging. Neurosci Lett. 2007;412:185–190. doi: 10.1016/j.neulet.2006.11.003. [DOI] [PubMed] [Google Scholar]
- Burnett MG, Detre JA, Greenberg JH. Activation-flow coupling during graded cerebral ischemia. Brain Res. 2005;1047:112–118. doi: 10.1016/j.brainres.2005.04.024. [DOI] [PubMed] [Google Scholar]
- Dijkhuizen RM, Beekwilder JP, van der Worp HB, Berkelbach van der Sprenkel JW, Tulleken KA, Nicolay K. Correlation between tissue depolarizations and damage in focal ischemic rat brain. Brain Res. 1999;840:194–205. doi: 10.1016/s0006-8993(99)01769-2. [DOI] [PubMed] [Google Scholar]
- Dirnagl U. Bench to bedside: the quest for quality in experimental stroke research. J Cereb Blood Flow Metab. 2006;26:1465–1478. doi: 10.1038/sj.jcbfm.9600298. [DOI] [PubMed] [Google Scholar]
- Dreier JP. The role of spreading depression, spreading depolarization and spreading ischemia in neurological disease. Nat Med. 2011;17:439–447. doi: 10.1038/nm.2333. [DOI] [PubMed] [Google Scholar]
- Dreier JP, Major S, Manning A, Woitzik J, Drenckhahn C, Steinbrink J, Tolias C, Oliveira-Ferreira AI, Fabricius M, Hartings JA, Vajkoczy P, Lauritzen M, Dirnagl U, Bohner G, Strong AJ. Cortical spreading ischaemia is a novel process involved in ischaemic damage in patients with aneurysmal subarachnoid haemorrhage. Brain. 2009;132:1866–1881. doi: 10.1093/brain/awp102. [DOI] [PMC free article] [PubMed] [Google Scholar]
- Durduran T, Zhou C, Buckley EM, Kim MN, Yu G, Choe R, Gaynor JW, Spray TL, Durning SM, Mason SE, Montenegro LM, Nicolson SC, Zimmerman RA, Putt ME, Wang J, Greenberg JH, Detre JA, Yodh AG, Licht DJ. Optical measurement of cerebral hemodynamics and oxygen metabolism in neonates with congenital heart defects. J Biomed Opt. 2010;15:037004. doi: 10.1117/1.3425884. [DOI] [PMC free article] [PubMed] [Google Scholar]
- Gerriets T, Stolz E, Walberer M, Muller C, Kluge A, Bachmann A, Fisher M, Kaps M, Bachmann G. Noninvasive quantification of brain edema and the space-occupying effect in rat stroke models using magnetic resonance imaging. Stroke. 2004;35:566–571. doi: 10.1161/01.STR.0000113692.38574.57. [DOI] [PubMed] [Google Scholar]
- Hertle DN, Dreier JP, Woitzik J, Hartings JA, Bullock R, Okonkwo DO, Shutter LA, Vidgeon S, Strong AJ, Kowoll C, Dohmen C, Diedler J, Veltkamp R, Bruckner T, Unterberg AW, Sakowitz OW. Effect of analgesics and sedatives on the occurrence of spreading depolarizations accompanying acute brain injury. Brain. 2012;135:2390–2398. doi: 10.1093/brain/aws152. [DOI] [PubMed] [Google Scholar]
- Hopwood SE, Parkin MC, Bezzina EL, Boutelle MG, Strong AJ. Transient changes in cortical glucose and lactate levels associated with peri-infarct depolarisations, studied with rapid-sampling microdialysis. J Cereb Blood Flow Metab. 2005;25:391–401. doi: 10.1038/sj.jcbfm.9600050. [DOI] [PubMed] [Google Scholar]
- Hossmann KA. Viability thresholds and the penumbra of focal ischemia. Ann Neurol. 1994;36:557–565. doi: 10.1002/ana.410360404. [DOI] [PubMed] [Google Scholar]
- Hossmann KA. Periinfarct depolarizations. Cerebrovasc Brain Metab Rev. 1996;8:195–208. [PubMed] [Google Scholar]
- Howells DW, Porritt MJ, Rewell SS, O’Collins V, Sena ES, van der Worp HB, Traystman RJ, Macleod MR. Different strokes for different folks: the rich diversity of animal models of focal cerebral ischemia. J Cereb Blood Flow Metab. 2010;30:1412–1431. doi: 10.1038/jcbfm.2010.66. [DOI] [PMC free article] [PubMed] [Google Scholar]
- Iijima T, Mies G, Hossmann KA. Repeated negative DC deflections in rat cortex following middle cerebral artery occlusion are abolished by MK-801: effect on volume of ischemic injury. J Cereb Blood Flow Metab. 1992;12:727–733. doi: 10.1038/jcbfm.1992.103. [DOI] [PubMed] [Google Scholar]
- Kietzmann T, Knabe W, Schmidt-Kastner R. Hypoxia and hypoxia-inducible factor modulated gene expression in brain: involvement in neuroprotection and cell death. Eur Arch Psychiatry Clin Neurosci. 2001;251:170–178. doi: 10.1007/s004060170037. [DOI] [PubMed] [Google Scholar]
- Luckl J, Baker W, Sun ZH, Durduran T, Yodh AG, Greenberg JH. The biological effect of contralateral forepaw stimulation in rat focal cerebral ischemia: a multispectral optical imaging study. Front Neuroenergetics. 2010;2 doi: 10.3389/fnene.2010.00019. [DOI] [PMC free article] [PubMed] [Google Scholar]
- Luckl J, Keating J, Greenberg JH. Alpha-chloralose is a suitable anesthetic for chronic focal cerebral ischemia studies in the rat: a comparative study. Brain Res. 2008;1191:157–167. doi: 10.1016/j.brainres.2007.11.037. [DOI] [PMC free article] [PubMed] [Google Scholar]
- Luckl J, Zhou C, Durduran T, Yodh AG, Greenberg JH. Characterization of periinfarct flow transients with laser speckle and Doppler after middle cerebral artery occlusion in the rat. J Neurosci Res. 2009;87:1219–1229. doi: 10.1002/jnr.21933. [DOI] [PubMed] [Google Scholar]
- Macleod MR, Fisher M, O’Collins V, Sena ES, Dirnagl U, Bath PM, Buchan A, van der Worp HB, Traystman R, Minematsu K, Donnan GA, Howells DW. Good laboratory practice: preventing introduction of bias at the bench. Stroke. 2009;40:e50–52. doi: 10.1161/STROKEAHA.108.525386. [DOI] [PubMed] [Google Scholar]
- Mies G, Ishimaru S, Xie Y, Seo K, Hossmann KA. Ischemic thresholds of cerebral protein synthesis and energy state following middle cerebral artery occlusion in rat. J Cereb Blood Flow Metab. 1991;11:753–761. doi: 10.1038/jcbfm.1991.132. [DOI] [PubMed] [Google Scholar]
- Moore LE, Traystman RJ. Role of oxygen free radicals and lipid peroxidation in cerebral reperfusion injury. Adv Pharmacol. 1994;31:565–576. doi: 10.1016/s1054-3589(08)60642-0. [DOI] [PubMed] [Google Scholar]
- Nakamura H, Strong AJ, Dohmen C, Sakowitz OW, Vollmar S, Sue M, Kracht L, Hashemi P, Bhatia R, Yoshimine T, Dreier JP, Dunn AK, Graf R. Spreading depolarizations cycle around and enlarge focal ischaemic brain lesions. Brain. 2010;133:1994–2006. doi: 10.1093/brain/awq117. [DOI] [PMC free article] [PubMed] [Google Scholar]
- Nedergaard M, Astrup J. Infarct rim: effect of hyperglycemia on direct current potential and [14C]2-deoxyglucose phosphorylation. J Cereb Blood Flow Metab. 1986;6:607–615. doi: 10.1038/jcbfm.1986.108. [DOI] [PubMed] [Google Scholar]
- Oliff HS, Weber E, Miyazaki B, Marek P. Infarct volume varies with rat strain and vendor in focal cerebral ischemia induced by transcranial middle cerebral artery occlusion. Brain Res. 1995;699:329–331. doi: 10.1016/0006-8993(95)01045-w. [DOI] [PubMed] [Google Scholar]
- Prass K, Ruscher K, Karsch M, Isaev N, Megow D, Priller J, Scharff A, Dirnagl U, Meisel A. Desferrioxamine induces delayed tolerance against cerebral ischemia in vivo and in vitro. J Cereb Blood Flow Metab. 2002;22:520–525. doi: 10.1097/00004647-200205000-00003. [DOI] [PubMed] [Google Scholar]
- Ruscher K, Freyer D, Karsch M, Isaev N, Megow D, Sawitzki B, Priller J, Dirnagl U, Meisel A. Erythropoietin is a paracrine mediator of ischemic tolerance in the brain: evidence from an in vitro model. J Neurosci. 2002;22:10291–10301. doi: 10.1523/JNEUROSCI.22-23-10291.2002. [DOI] [PMC free article] [PubMed] [Google Scholar]
- Saito R, Graf R, Hubel K, Fujita T, Rosner G, Heiss WD. Reduction of infarct volume by halothane: effect on cerebral blood flow or perifocal spreading depression-like depolarizations. J Cereb Blood Flow Metab. 1997;17:857–864. doi: 10.1097/00004647-199708000-00004. [DOI] [PubMed] [Google Scholar]
- Schneider A, Kuhn HG, Schabitz WR. A role for G-CSF (granulocyte-colony stimulating factor) in the central nervous system. Cell Cycle. 2005;4:1753–1757. doi: 10.4161/cc.4.12.2213. [DOI] [PubMed] [Google Scholar]
- Shin HK, Dunn AK, Jones PB, Boas DA, Moskowitz MA, Ayata C. Vasoconstrictive neurovascular coupling during focal ischemic depolarizations. J Cereb Blood Flow Metab. 2006;26:1018–1030. doi: 10.1038/sj.jcbfm.9600252. [DOI] [PubMed] [Google Scholar]
- Spratt NJ, Fernandez J, Chen M, Rewell S, Cox S, van Raay L, Hogan L, Howells DW. Modification of the method of thread manufacture improves stroke induction rate and reduces mortality after thread-occlusion of the middle cerebral artery in young or aged rats. J Neurosci Methods. 2006;155:285–290. doi: 10.1016/j.jneumeth.2006.01.020. [DOI] [PubMed] [Google Scholar]
- Strong AJ, Anderson PJ, Watts HR, Virley DJ, Lloyd A, Irving EA, Nagafuji T, Ninomiya M, Nakamura H, Dunn AK, Graf R. Peri-infarct depolarizations lead to loss of perfusion in ischaemic gyrencephalic cerebral cortex. Brain. 2007;130:995–1008. doi: 10.1093/brain/awl392. [DOI] [PubMed] [Google Scholar]
- Symon L, Branston NM, Strong AJ, Hope TD. The concepts of thresholds of ischaemia in relation to brain structure and function. J Clin Pathol Suppl (R Coll Pathol) 1977;11:149–154. doi: 10.1136/jcp.s3-11.1.149. [DOI] [PMC free article] [PubMed] [Google Scholar]
- Ueda S, Fujitsu K, Inomori S, Kuwabara T. Thrombotic occlusion of the middle cerebral artery. Stroke. 1992;23:1761–1766. doi: 10.1161/01.str.23.12.1761. [DOI] [PubMed] [Google Scholar]
- Yanamoto H, Hong SC, Soleau S, Kassell NF, Lee KS. Mild postischemic hypothermia limits cerebral injury following transient focal ischemia in rat neocortex. Brain Res. 1996;718:207–211. doi: 10.1016/0006-8993(96)00122-9. [DOI] [PubMed] [Google Scholar]
- Yanamoto H, Nagata I, Nakahara I, Tohnai N, Zhang Z, Kikuchi H. Combination of intraischemic and postischemic hypothermia provides potent and persistent neuroprotection against temporary focal ischemia in rats. Stroke. 1999;30:2720–2726. doi: 10.1161/01.str.30.12.2720. discussion 2726. [DOI] [PubMed] [Google Scholar]