

Abstract
The transcriptional repressor Bcl6 is a critical arbiter of T helper cell fate, promoting the follicular helper (Tfh) lineage while repressing other T helper cell lineages. Bcl6-deficient (Bcl6-/-) mice develop a spontaneous and severe Th2-type inflammatory disease, thus warranting assessment of Bcl6 in Treg cell function. Bcl6-/- Tregs were competent at suppressing T cell proliferation in vitro and Th1-type colitogenic T cell responses in vivo. In contrast, Bcl6-/- Treg cells strongly exacerbated lung inflammation in a model of allergic airway disease, and promoted higher Th2 responses, including systemic up-regulation of microRNA-21. Further, Bcl6-/- Tregs were selectively impaired at controlling Th2 responses but not Th1 and Th17 responses, in mixed chimeras of Bcl6-/- bone marrow with Foxp3-/- bone marrow. Bcl6-/- Tregs displayed increased levels of the Th2 transcription factor Gata3 and other Th2 and Treg genes. Bcl6 potently repressed Gata3 transcriptional transactivation, providing a mechanism for the increased expression of Th2 genes by Bcl6-/- Tregs. Gata3 has a critical role in regulating Foxp3 expression and functional fitness of Tregs, however, the signal that regulates Gata3 and restricts its transactivation of Th2 cytokines in Tregs has remained unexplored. Our results identify Bcl6 as an essential transcription factor regulating Gata3 activity in Tregs. Thus, Bcl6 represents a crucial regulatory layer in the Treg functional program, required for specific suppression of Gata3 and Th2 effector responses by Tregs.
Introduction
BCL6 is a potent sequence-specific transcriptional repressor originally identified as an oncogene in non-Hodgkin's B cell lymphoma. Insights about a role for Bcl6 in the T cell lineage first came from studies in Bcl6-deficient (Bcl6-/-) mice that develop spontaneous Th2-type inflammatory disease and also exhibit pronounced Th2 responses when challenged with an antigen (1-3). The most common manifestation of the inflammatory disease in Bcl6-/- mice is severe myocarditis, often accompanied by pulmonary vasculitis. Most Bcl6-/- mice die before 12 weeks of age, and these mice typically show severe inflammatory disease. The mechanism by which Bcl6 regulates Th2 responses is not well understood, but there is evidence for post-transcriptional regulation of the Th2 transcription factor Gata3 (4). Bcl6 is the lineage-defining transcription factor for follicular helper T cells (Tfh), a subset of T helper cells that provides help to B cells and promotes the germinal center reaction (5-7).
Regulatory T cells (Tregs) are an immune-regulatory subset of CD4+ T cells essential for the maintenance of peripheral tolerance and immune homeostasis. The transcription factor Foxp3 specifies the Treg lineage and maintains its functional program (8-10). Treg cells function as potent inhibitors of T cell proliferation and of T cell-mediated inflammation. Treg function is highly orchestrated such that specific transcription factors regulate the ability of Tregs to inhibit discrete types of T cell responses. Thus T-bet uniquely controls the ability of Tregs to suppress Th1 responses (11), IRF4 regulates the ability of Tregs to suppress Th2 responses (12) and Stat3 directs the ability of Tregs to suppress Th17 responses (13). The Th2 specific factor Gata3 has recently been revealed as a key regulator of Treg function and homeostasis (14, 15).
While Bcl6 has emerged as a central regulator of T helper cell differentiation, the role of Bcl6 in Treg cell function is not well understood, particularly with regard to suppression of inflammation. Bcl6-/- mice have normal percentages of “natural” Foxp3+ Treg cells (7) and Bcl6 has recently been demonstrated to be important for the development of Foxp3+ “TFR” cells that regulate germinal center responses (16, 17). However, the role of Bcl6 in Treg-mediated control of inflammatory T cell responses has not been elucidated. Here, we report that Treg cells deficient in Bcl6 are uniquely defective in their ability to suppress Th2 inflammation. Bcl6 is required to suppress Th2 genes in Tregs by limiting the transcriptional activity of Gata3. Thus, we have identified a novel pathway of gene regulation in Treg cells that is essential for Treg-mediated control of Th2 inflammation.
Materials and Methods
Mice
Bcl6-/- mice on a mixed C57BL/6-129Sv background have been previously described (1, 2). Bcl6-/- mice were used between 5 and 10 weeks of age, and mice used were active and relatively healthy. Foxp3-gfp mice where an IRES element links GFP expression to the FoxP3 transcript were obtained from Jackson labs (strain B6.Cg-Foxp3tm2Tch/J; Bar Harbor, ME). Bcl6-/- mice were mated onto this Foxp3gfp background. Rag1-/-, Il10-/- and Foxp3-/- mice were also originally obtained from Jackson labs. Bcl6-/- Tcrα-/- mice have been previously described (18). Wild-type (WT) and Bcl6-/- Foxp3gfp mice were genotyped by PCR as previously described. Mice were bred under specific pathogen-free conditions at the laboratory animal facility at IUSM and were handled according to protocols approved by the IUSM Animal Use and Care Committee.
Antibodies and FACS analysis
Flow cytometry analysis of intracellular transcription factors and cytokines was performed by staining the cells with flourochrome-conjugated anti-Foxp3 (FJK-16a; eBioscience), anti-Helios (22F6; BioLegend), anti-GATA3 (TWAJ; eBioscience) and anti-IL-4 (BD Biosciences) using the mouse Regulatory T cell staining kit (eBioscience). Cells were first stained with antibodies for the desired cell surface markers – CD4 (RM4-5; BD Biosciences) and CD25 (PC61.5; eBioscience), followed by permeabilization with Fixation/Permeabilization buffer and intracellular staining in Permeabilization buffer. Flow analysis was performed on a FACSCalibur and data analyzed using the FLOWJO software (Tree Star, Inc.).
Mouse T cell cultures and Treg cell assays
Naïve T cells (CD4+CD62L+) were purified from lymph nodes and spleen using magnetic beads (Miltenyi Biotech). Naïve CD4+ T cells (1×10⁶ cells/ml in DMEM medium supplemented with 10% FCS (Atlanta Biologicals), 2mM glutamine, 100 units/ml Penicillin-Streptomycin, MEM non-essential amino acids, 25mM HEPES and 55uM 2-mercaptoethanol (Gibco)) were activated with plate-bound anti-CD3 (5 μg/ml; 145-2C11; BD Biosciences) and anti-CD28 (10 μg/ml; 37.51; BD Biosciences). Antibodies to CD3 and CD28 were obtained from BD Biosciences. Recombinant human IL-2 was obtained from the Biological Resources Branch, Division of Cancer Treatment and Diagnosis, National Cancer Institute-Frederick Cancer Research and Development Center.
For Treg assays, CD4+CD25+ T cells were purified from wild-type and Bcl6-/- Foxp3gfp mice using magnetic beads, followed by FACS sorting for pure GFP+ Tregs using FACSAria cell sorter (Becton Dickinson). The CD4+CD25− T cell fraction from magnetic bead isolation was used as responder T cells (Tresps). Antigen-presenting cells (APCs) were prepared from the spleens of Tcrα-/- mice. For Treg suppression assays, wild-type or Bcl6-/- Tresps (50×103/well) were separately co-cultured with wild-type or Bcl6-/- Tregs at different ratios as indicated along-with Mitomycin-C (20 μg/ml) treated APCs (50x×103/well) plus anti-CD3 (2 μg/ml) or 10 μg/ml Ova for 72 hrs. Plates were pulsed with 1 μC of [3H] thymidine at 48 hrs of culture and cell proliferation in triplicate cultures was measured using a scintillation counter.
Induction of experimental colitis
Un-fractionated CD4+ T cells (Tresps) (1×10⁶) from Il10-/- mice isolated using magnetic bead selection were adoptively transferred intra-peritoneally (i.p.) into Rag-/- mice to induce a strong Th1-mediated colitogenic response in the recipients 4-8 wks post-transfer(19). Along with the transfer of Il10-/- Tresps, two cohorts of Rag-/- recipients were injected i.p. with FACS-sorted CD4+CD25+Foxp3+ Tregs (250×103) from Bcl6-/- or wild-type Foxp3gfp mice. The recipient mice were monitored for signs of intestinal pathology and weight loss over a period of 4-5 wks, following which mice were sacrificed to assess severity of colitis using the parameters of percent weight loss, changes in colon length and colon histology scores. Colon sections were stained with hematoxylin and eosin (H&E) and colitis severity was graded in a blinded fashion on a scale of 0-6 as described: 0 – Normal crypt architecture and occasional cell infiltration, 2 – Irregular crypt architecture and increasing number of cells in lamina propria (LP), 4 – Moderate crypt loss (10-50%) and confluence of cells extending to sub-mucosa, 6 – Severe crypt loss (50-90%) and transmural extension of infiltrate.
Induction of experimental allergic airway inflammation
Both wild-type B6 female mice (recipients) as well as the Bcl6-/- and wild-type Foxp3gfp mice (Treg donors) were sensitized intra-peritoneally (i.p.) with Ova (Sigma) adsorbed to alum (Sigma) at a dose of 20 μg Ova/2 mg alum on days 0 and 7 of the protocol(20). On day 14, CD4+CD25+Foxp3+ Tregs were FACS-sorted from Ova-sensitized Bcl6-/- and wild-type Foxp3gfp mice and then injected i.p. (350 × 103 cells/mouse) into the sensitized wild-type B6 female recipients (21). After 3 hrs following immunization, recipient mice were then challenged intranasally with Ova for 5 consecutive days (100 μg/ day). Mice were sacrificed by i.p. injection of pentobarbital (5 mg/mouse) 48 hrs after the final intranasal challenge. The trachea was cannulated and lungs were lavaged three times with 1 ml PBS to collect the bronchoalveolar lavage (BAL). Cells recovered in BAL fluid and the lung mediastinal lymph nodes (MLNs) were counted with a hemocytometer. Eosinophils, neutrophils, T cells, B cells and mononuclear cells in the BAL fluid were distinguished by cell size and by expression of CD3, B220, CCR3, CD11c and major histocompatibility complex class II, analyzed by flow cytometry as described(20). For quantitative PCR analysis, lung tissues were homogenized in a tissue lyser (Qiagen) and RNA isolated with an RNeasy kit (Qiagen) was used for synthesis of cDNA for subsequent analysis. Paraffin-embedded sections were stained with H & E for evaluation of the infiltration of inflammatory cells by light microscopy.
Airway hyper-reactivity to methacholine challenge was determined 24 hrs after the final intranasal challenge. Noninvasive unrestrained whole-body plethysmography (Buxco Research Systems) was used to record airway responsiveness with the dimensionless parameter ‘enhanced pause’ for estimation of total pulmonary resistance, an indicator of broncho-constriction. Mice were placed in whole-body plethysmographs and baseline measurements were recorded. Saline was administered by nebulization for 2 min, followed by increasing doses of methacholine, and the enhanced-pause parameter was recorded over 5 min.
In situ hybridization
In situ hybridizations were performed in 8μM cryosections from lungs of mice in the airway inflammation experiment using the miRCURY LNA microRNA ISH Optimization kit 2 (miR-21), according to the manufacturer's protocol (Exiqon). In brief, the FFPE slides were rinsed and digested with Proteinase K for 12 mins at 37°C. After protease digestion, the digoxin-labeled LNA-scrambled control probe and LNA miR-21 antisense probe (Exiqon) were hybridized to the slides at 52°C for 6 hrs. Following post-hybridization washes with SSC buffer at 47°C, 100 ul of rabbit anti-digoxin (Sigma-Aldrich) Ab, diluted 1/2000 was applied to the slides for 1 hr at room temperature. The slides were rinsed and then incubated with 100 ul anti-rabbit alkaline phosphatase and TNBS substrate for 2 hr at 30°C. Slides were counterstained with Nuclear Fast Red (Polyscientific), coverslipped, and mounted for viewing.
Generation of Bone Marrow Chimeras
Donor wild-type BoyJ (CD45.1+) and Bcl6-/- (CD45.1−) mice on Foxp3gfp background and Foxp3-/- mice were euthanized with CO2 asphyxiation and cervical dislocation, and femurs and tibias were removed aseptically. Bone marrow (BM) was flushed with DMEM complete media. Recipient Rag-/- mice were sub-lethally irradiated (350 Gy) 16-24 hrs prior to re-constitution. The recipients were then re-constituted with wild-type and Foxp3KO BM (WT:Foxp3KO chimeras), Bcl6-/- and Foxp3KO BM (KO:Foxp3KO chimeras) or wild-type and Bcl6-/- Foxp3gfp BM (WT:KO chimeras) (10×106) by intravenous injections (i.v.). Satisfactory re-constitution was achieved after 4-5 months. Mice were immunized with OVA/Alum i.p. two weeks prior to FACS sorting of the wild-type and Bcl6-/- CD25+Foxp3+ (Tregs) and CD25−Foxp3− (Tconv) based on CD45.1 expression for quantitative PCR analysis.
Affymetrix Microarrays and qRT-PCR
Total RNA was extracted from FACS-sorted CD4+CD25+Foxp3+ Tregs from Bcl6-/- and wild-type Foxp3gfp mice following 16 hr activation in vitro with plate-bound anti-CD3 (5 μg/ml) and anti-CD28 (10 μg/ml) using the RNeasy Mini kit, according to the manufacturer's protocol (Qiagen). The microarray studies were carried out using the facilities of the Center for Medical Genomics at Indiana University School of Medicine which process the samples employing the protocols recommended by Affymetrix in their GeneChip® Expression Analysis Technical Manual (Affymetrix, Santa Clara, CA). Biotinylated cRNA was hybridized to Affymetrix GeneChip Mouse Genome 430 2.0 arrays. Data analysis was performed using the MeV software. Microarray data files have been submitted to the NCBI GEO database: http://www.ncbi.nlm.nih.gov/geo/, accession #16622754.
To validate the expression array data, qPCR was performed on independently prepared Tregs from Bcl6-/- and wild-type Foxp3gfp mice.
Retroviral transductions
Naïve T cells (CD4+CD62L+) prepared from wild-type C57BL/6 or Stat6-/- mice using magnetic beads were activated in vitro with plate-bound anti-CD3 (5 μg/ml) and anti-CD28 (10 μg/ml) for 24 hrs. Cells were then transduced by spin infection with bicistronic retroviral vector (RV) supernatants encoding Bcl6 and H2Kk or GATA3 and hCD4(22, 23). Second or third day following transduction, cells infected with H2Kk RVs were stained with biotin-anti-H2Kk and streptavidin-APC, while those infected with hCD4 RVs were stained for anti-hCD4-PE and then FACS-sorted based on APC or PE expression, respectively. The sorted RV+ T cells were re-stimulated in vitro with anti-CD3 and anti-CD28 for 4-6 hrs for gene expression analysis.
Reporter assays
Jurkat T cells (10×106 cells/250ul) were electroporated as described (24) in serum-free RPMI 1640 medium with an IL-5 promoter-driven luciferase reporter vector (10μg) along with expression constructs (10μg) for CXN, CXN-GATA3, CXN-BCL6 or CXN-GATA3 plus CXN-BCL6 at the concentrations listed. After electroporation, cells were re-suspended in RPMI media supplemented with 10% FCS and rested overnight. Luciferase measurements were performed 24 hrs after transfection following 6 hr activation of cells with PMA (10 ng/ml) and Ionomycin (0.3 μM) using Luciferase Assay System (Promega). M12 B cells were electroporated as described(25) with the indicated plasmids as above. Luciferase measurements were performed following activation of cells with PMA and dibutyrl cAMP.
Gene expression analysis
Total cellular RNA was prepared using the Trizol method (Life Technologies), and cDNA prepared with the Transcriptor First Strand cDNA synthesis kit (Roche). Quantitative PCR reactions were run by assaying each sample in triplicates using the Fast Start Universal SYBR Green Mix (Roche Applied Science) with a Stratagene Mx3000P Real-Time QPCR machine. Samples with limiting RNA were assessed for gene expression using Taqman assays (ABI). Levels of mRNA expression were normalized to beta-tubulin mRNA levels, and differences between samples analyzed using the ddCT method. For qRT-PCR assessment of microRNAs, RNA was extracted from lung tissue or serum samples using MiRNeasy Mini kit, according to manufacturer's protocol (Qiagen). and gene expression assessed using TaqMan microRNA assays (Applied Biosystems). Normalization was performed using sno202, sno234 and U6 as controls, with U6 as the sole control for samples with limiting RNA. PCR primer sequences and Taqman assay IDs:
btub-- F: 5′-CTGGGAGGTGATAAGCGATGA-3′ R: 5′-CGCTGTCACCGTGGTAGGT-3′
Foxp3-- F: 5′-CCCTGCCCTTGACCTCAA-3′R: 5′-GCCTCAGTCTCATGGTTTTGG-3′
Il4— F: 5′-ACAGGAGAAGGGACGCCAT-3′ R: 5′-GAAGCCCTACAGACGAGCTCA-3′
Il5— F:5′-GCAGCTGGATTTTGGAAA-3′ R:5′-GTGGCTGGCTCTCATTCACA-3′
Il13— F:5′-CGCAAGGCCCCCACTAC-3′ R:5′AAAGTGGGCTACTTCGATT-3′
Il10— F:5′-GGTTGCCAAGCCTTATCGGA-3′ R:5′-ACCTGCTCCACTGCCTTGCT-3′
Tgfb1— F: 5′-GCAGTGGCTGAACCAAGGA-3′ R: 5′-AGCAGTGAGCGCTGAATCG-3′
Gzmb— F:5′-CCCAGGCGCAATGTCAAT-3′ R:5′-CCCCAACCAGCCACATAGC-3′
Ccr8— F:5′-TGTGGCTGGCTGCTGTCA-3′ R:5′-TCAGAGGCCACTTGGTAAAAAAC-3′
Tnfa— F: 5′-CACAAGATGCTGGGACAGTGA-3′ R: 5′-TCCTTGATGGTGGTGCATGA-3′
Gata3— F: 5′-GAAGGCATCCAGACCCGAAAC-3′ R: 5′-ACCCATGGCGGTGACCATGC-3′
Ifng— F:5′-TCAAGTGGCATAGATGTGGAAGAA-3′ R:5′-TGGCTCTGCAGGATTTTCATG-3′
QPCR Taqman assay IDs: tubb5 Mm00495806_g1; Gata3 Mm00484683_m1; Il12a Mm00434169_m1; Il4 Mm00445259_m1; miR-21 000397; U6 001973
Statistical analysis
p values were calculated using Students' T-test or One-way analysis of variance with Tukey's post test (for multiple sample comparisons). All calculations were done using GraphPad Prism software. A p value < 0.05 was considered to show a significant difference.
Results
Bcl6-/- Treg cells are able to suppress T cell proliferation in vitro and colitis in vivo
To verify previously published data that Bcl6 did not control Treg cell development in vivo (7), we stained CD4+CD25+ T cells from wild-type and healthy Bcl6-/- mice for Foxp3 expression, and found similar percentages of Tregs in both types of mice (Fig. 1A). Additionally, we tested Helios expression on Bcl6-/- Tregs, as Helios appears to denote recently activated or proliferating Tregs (26-29). Despite the spontaneous inflammatory disease that develops in the majority of Bcl6-/- mice, we found normal percentages of Helios-negative Treg cells in Bcl6-/- mice in vivo (Fig. 1A). Thus, at least as defined by FoxP3 and Helios expression, we observed normal Treg populations in Bcl6-/- mice. Mice deficient in the ability to generate extra-thymic Tregs develop abnormal Th2 inflammation at mucosal surfaces as they age (30), indicating that inducible Treg formation is critical for controlling Th2 responses. However, Bcl6-/- mice do not develop mucosal inflammation and instead succumb at an early age to myocarditis and pulmonary vasculitis. Thus, defects in inducible Treg generation probably does not account for the T cell-dependent spontaneous inflammatory disease that develops in Bcl6-/- mice (2, 18) (Supp. Table 1). The CD4+CD25+ T cell population in the Bcl6-/- mice contains a significant percentage of activated, Foxp3– cells that interfere with Treg activity in a suppression assay (D.V.S., A.L.D., data not shown). Therefore, we bred the Bcl6-/- mice to the Foxp3-gfp background so that Foxp3+CD4+CD25+ T cells could be purified by fluorescence-activated cell sorting. We then tested the functionality of Bcl6-/- Tregs in a standard in vitro suppression of T cell proliferation assay. Using highly purified CD4+CD25+Foxp3+ T cells, we found that Bcl6-/- Tregs consistently suppressed T cell proliferation better than wild-type Tregs (Fig. 1B). Bcl6-/- Tregs were also effective at suppressing the increased proliferation of Bcl6-/- CD4+CD25− (Tresps) as wild-type Tregs (Supp. Fig. 1A, B). These data indicate that Bcl6-/- Tregs are functionally suppressive, and further that Bcl6-/- Tresps are not resistant to Treg-mediated suppression.
Figure 1. Characterization of Treg cells from Bcl6-/- mice.

A. Analysis of Treg cell compartment in the peripheral lymphoid organs of Bcl6-/- (KO) mice (black bars) and their wild-type (WT) littermates (white bars). The frequency of CD4+CD25+Foxp3+ Tregs and Helios−CD4+CD25+Foxp3+ was quantified by flow analysis. n = 3 per group (p=0.30 (NS) for CD4+CD25+Foxp3+ T cells and p=0.67 (NS) for Helios−CD4+CD25+Foxp3+ cells. NS = non-significant (p > 0.05, Student's t-test).
B. Suppression of T cell proliferative responses by CD4+CD25+Foxp3+ Tregs sorted from Bcl6-/- (black bars) and wild-type (white bars) Foxp3-gfp mice following co-culture with wild-type CD25−Foxp3− (Tresps) cells (grey bar) at different ratios (Treg/Tresp ratios - 1:2 and 1:4). Proliferation assessed as [H3] thymidine incorporation. Data plotted as percent proliferation is representative of at least 3 independent experiments (mean and s.e.m. of triplicate cultures).
C. Suppression of Th1 inflammation in vivo by Bcl6-/- Tregs in a T cell transfer model of colitis. Colitis was induced following adoptive transfer of Il10-/- CD4+ T cells (Tresps) i.p. into Rag1-/- mice (dark grey line). Bcl6-/- Foxp3-gfp Tregs (black line) or their wild-type counterparts (light grey line) were co-transfered i.p. along with Il10-/- Tresps to separate cohorts of Rag1-/- mice to assess reversal of disease. Data represents percent weight change relative to initial weight averaged for 3-4 mice per cohort and assessed over a 4-wk time period (*p<0.05 and **p<0.01 for cohorts receiving Tresps alone relative to cohorts receiving Tresps with either wild-type or Bcl6-/- Tregs, p=NS between cohorts receiving wild-type and Bcl6-/- Tregs).
D. Severity of colitis assessed by changes in colon length 4 wks post-transfer to Rag1-/- mice as described in (C).
E. Representative colon histopathology for the 3 cohorts of Rag1-/- mice as described in (C) assessed by hematoxylin and eosin (H&E) staining 4 wks post-transfer (Original magnification - 200× for Rag-/- mice receiving Il10-/- Tresps alone and 400× for those receiving Il10-/- Tresps plus either Bcl6-/- or wild-type Tregs).
F. Colon sections from the 3 cohorts of Rag1-/- mice were scored 4 wks post-transfer in a blinded-fashion on a scale of 0-6.
(B-F) *p<0.05, **p<0.01, ***p<0.001 (One-way analysis of variance) (error bars=s.e.m.)
Since Treg activity in vitro does not necessarily correlate with in vivo suppressive activity, we tested the ability of CD4+CD25+Foxp3+ Bcl6-/- Tregs to suppress inflammation in vivo in a T cell transfer model of colitis established following adoptive transfer of Il10-deficient CD4+ T cells into Rag1-deficient mice (19). This system is known to provoke a strong Th1-mediated colitogenic inflammation 4-8 wks post T cell transfer. As measured by weight loss, changes in colon length and histological assessment, Bcl6-/- Tregs suppressed the development of disease as effectively as wild-type Tregs (Fig. 1C-F). Together, these data show that Bcl6-/- Tregs are competent at suppressing T cell proliferation in vitro and Th1-type colitogenic responses in vivo.
Bcl6-/- Tregs fail to suppress allergic airway inflammation in vivo
Since Bcl6-/- mice develop spontaneous Th2-type inflammation, we next tested whether Bcl6-/- Tregs were defective in their ability to suppress Th2 responses. We used a model where Th2 airway inflammation is induced by repeated intranasal administration of Ovalbumin (Ova) following initial i.p. priming with Ova (20, 21). Prior to the Ova challenge, Ova-primed CD4+CD25+Foxp3+ Tregs from wild-type or Bcl6-/- mice with intact suppressor function in vitro (Supp. Fig. 1C) were injected to test their ability to suppress airway inflammation. After the last Ova challenge, the mice were analyzed for airway hyper-reactivity by plethysmography. As shown in Figure 2A, wild-type Tregs suppressed the increased Penh (enhanced Pause) response induced by methacholine, compared to control mice that did not receive Tregs. In contrast, Bcl6-/- Tregs displayed a similar Penh response as the control mice with airway disease, and at the highest dose of methacholine, showed a higher Penh reading than control mice with airway disease. These data indicate that Bcl6-/- Tregs were not functioning to suppress airway hyper-responsiveness. To further analyze the airway inflammatory response, we measured the cellularity of bronchoalveolar lavage (BAL) and of the draining mediastinal lymph nodes (MLN) for the three treatment groups. Strikingly, whereas wild-type Tregs suppressed BAL and MLN cell counts compared to control mice with airway disease, Bcl6-/- Tregs promoted a several fold increase in BAL and MLN cellularity compared to control mice (Fig. 2B). Analysis of the specific types of cells in the BAL revealed that the bulk of the increase in cellularity was due to eosinophils, a cell type characteristic of Th2 responses (Fig. 2C). Next, we examined the lung inflammation by histology, and scored the inflammation by differential cell counts. As shown in Figures 2D and 2E, whereas wild-type Tregs suppressed inflammatory cell accumulation around the airways, Bcl6-/- Tregs failed to suppress the inflammation. These data indicate that Bcl6-/- Tregs are not just severely defective in the ability to suppress Th2 inflammation, but that Bcl6-/- Tregs actively exacerbate Th2 inflammation, leading to greater recruitment of eosinophils and reduced lung function.
Figure 2. Bcl6-/- Tregs fail to suppress allergic airway inflammation in vivo.

A. Assessment of lung function in Ova-sensitized and intranasally challenged wild-type recipient mice immunized i.p. with or without Bcl6-/- or wild-type Tregs or left non-challenged (NC) (n = 5 per group). Airway hyper-reactivity was measured by the enhanced pause (Penh) value by whole body plethysmography of the recipient mice 24 hrs after the final intranasal challenge, tested at baseline (B), and following inhalation of increasing doses of aerosolized methacholine (horizontal axis). *p<0.05 (Student's t-test) between mice receiving Bcl6-/- vs. wild-type Tregs.
B. Cellularity in the bronchoalveolar lavage (BAL) and the lung mediastinal lymph nodes (MLNs) for the Ova-sensitized and challenged recipient mice immunized with or without Bcl6-/- or wild-type Tregs as in (A).
C. Cellular composition of the BAL for the mice challenged as in (A) assessed by flow cytometry (Eos=Eosinophils, Neu=Neutrophils, Mac=Macrophages, DC=Dendritic cells).
D. Differential cell counts of specific inflammatory cell types in 10 different fields of H & E-stained lung sections of the mice treated as in (A).
E. Lung histopathology assessed by H & E staining of paraffin-embedded lung sections for mice challenged as in (A) or left non-challenged (NC). Original magnification, 100 × (left) and 400 × (right).
(B-D) *p<0.05, **p<0.01, ***p<0.001 (One-way analysis of variance) (error bars= s.e.m.)
Bcl6-/- Tregs exacerbate Th2 immune responses in allergic inflammation in vivo
To further characterize the Th2 inflammatory response mediated by Bcl6-/- Tregs in the airway inflammation model, we analyzed gene expression in the lungs by QPCR. We found that the Th2 cytokines Il4, Il5 and Il13 were most strongly expressed in the lungs of mice that received Bcl6-/- Tregs (Fig. 3A). The increased Th2 cytokines can explain the increased infiltration of eosinophils, impaired lung function and increased IgE levels in the mice that received the Bcl6-/- Tregs (Supp. Fig. 2A). We tested Foxp3 expression as a marker for Tregs, and found highest Foxp3 expression in the lungs from mice injected with Bcl6-/- Tregs (Fig. 3B). Thus, defective homing of the Bcl6-/- Tregs to the inflamed lungs or loss of Treg stability in the context of the inflammatory Th2 milieu is unlikely to account for the augmented Th2 responses seen with Bcl6-/- Tregs.
Figure 3. Bcl6-/- Tregs exacerbate Th2 responses in allergic airway inflammation associated with systemic increase in microRNA-21.

A. Quantitative PCR analysis of Th2 cytokine genes (Il4, Il5, Il13) in the total lung RNA of Ova-sensitized and intranasally challenged wild-type recipient mice (grey bars) or immunized i.p. with Bcl6-/- Tregs (black bars) or wild-type Tregs (white bars). Results are normalized to β2-microglobulin.
B. Quantitative PCR analysis of Foxp3 in the total lung RNA for mice treated as in (A), normalized to β2-microglobulin.
C. Quantitative PCR analysis of miR-21 in the total lung RNA for the mice treated as in (A), normalized using U6 as control.
D. Expression of miR-21 in the paraffin-embedded lung sections of mice treated as in (A) as determined by LNA-based in situ hybridization. (Left, 100×; Right, 400×). Sections are representative of hybridization results from at least 3 different experiments.
E. Quantitative PCR analysis of miR-21 in the sera of mice treated as in (A), normalized using U6 as control.
(A-C, E) *p<0.05, **p<0.01, ***p<0.001 (One-way analysis of variance) (error bars= s.e.m.)
A previous study associated increased microRNA-21 (miR-21) with Th2 inflammatory responses in three different mouse models of allergic airway inflammation (31). MiR-21 was mainly localized to cells of the myeloid lineage and the increased miR-21 was shown to indirectly prime for Th2 responses by targeting the Il12a subunit of the Th1 cytokine, IL12. To test the relevance of this finding to the exacerbated Th2 responses following transfer of Bcl6-/- Tregs, we assessed miR-21 expression in the lungs of mice in our airway inflammation model. Surprisingly, while miR-21 expression was not different between control and wild-type Treg-treated mice, miR-21 was greatly increased in the total RNA of lungs taken from the Bcl6-/- Treg-treated mice (Fig. 3C). The increased miR-21 in the lungs of Bcl6-/- Treg-treated mice therefore strongly support the idea that Bcl6-/- Tregs actively promote severe Th2 inflammation, as miR-21-/- mice develop reduced allergic inflammation (32). While miR-21 was detected at a low level in myeloid inflammatory cells in our model of airway inflammation, similar to Lu et al (31), we also observed very high miR-21 expression in airway epithelium cells (Fig. 3D, Supp. Fig. 2B). Mice given Bcl6-/- Tregs showed a similar lung pattern of miR-21 expression as control and wild-type Treg-injected mice, but had more intense miR-21 staining, correlating with higher overall lung miR-21 expression. Further, expression of the reported miR-21 target gene, Il12a, was reduced in the lungs of Bcl6-/- Treg-treated mice (Supp. Fig 2C), consistent with increased lung miR-21 levels in this group. Interestingly, we also observed a significant increase in circulating or serum miR-21 in Bcl6-/- Treg-treated group (Fig. 3E). Thus Bcl6-/- Tregs promote exacerbated Th2 responses in the airway inflammatory setting, associated with a novel systemic up-regulation of miR-21 that can further augment Th2 responses by inhibiting Th1 differentiation (32).
Bcl6-/- Tregs are selectively impaired in controlling systemic Th2 responses
To test the ability of Bcl6-/- Tregs to control inflammatory T cell responses in another in vivo setting, we set up mixed bone marrow chimeras where bone marrow from Foxp3KO (scurfy) mice was injected into irradiated Rag1-/- recipient mice along with bone marrow from wild-type Foxp3-gfp mice (WT:Foxp3KO chimeras) or Bcl6-/- Foxp3-gfp mice (KO:Foxp3KO chimeras) (Fig. 4A). Because of a spontaneous mutation in Foxp3, Foxp3KO or scurfy mice lack functional Tregs and develop a severe autoimmune pathology mediated by both Th1 and Th2 cells (11, 33, 34). WT:Foxp3KO chimeric mice have a mixture of wild-type and Foxp3-/- conventional T cells (Tconv cells) and a functional wild-type Treg subset, while KO:Foxp3KO chimeric mice have a mixture of Bcl6-/- and Foxp3-/- conventional T cells (Tconv cells) and complete deficiency of Bcl6 in the Treg subset. After 16-20 weeks to allow lymphoid constitution, both types of chimeric mice were immunized with Ova-Alum to provoke an immune response, and Tconv cells were purified and tested for gene expression, following activation with anti-CD3 and anti-CD28 Abs in vitro. As shown in Figure 4B and Supp. Fig. 3A, Tconv cells from KO:Foxp3KO chimeras showed a striking increase in the expression of Th2 cytokines, compared to Tconv from WT: Foxp3KO chimeras, while Ifng and Il17a levels were not significantly different between the two chimera types. These findings further confirm that Bcl6-/- Tregs have a selective failure to control Th2 responses but not Th1 and Th17 responses, despite the presence of Bcl6-sufficient Foxp3-/- lymphoid and myeloid cells. Additionally, considering the abnormal development of Th1 and Th2 cells in Foxp3-/- mice (11, 33, 34), the specific increase in Th2 cytokines but not Th1 cytokines with the KO:Foxp3KO chimeras is especially noteworthy. Thus, our results with the KO:Foxp3KO chimeras and the Th1 and Th2 disease models clearly demonstrate a critical role for Bcl6 in Treg-mediated control of Th2 inflammatory responses in vivo.
Figure 4. Bcl6-/- Tregs are selectively impaired in the control of systemic Th2 inflammatory responses in vivo.

A. Scheme depicting the two types of bone marrow (BM) chimeras generated with Rag1 KO mice as recipients: wild-type BM mixed with Foxp3KO BM (WT:Foxp3KO) and Bcl6-/- BM mixed with Foxp3KO BM (KO:Foxp3KO).
B. Quantitative PCR analysis of Th2 genes (Il4, Il13), Ifng and Il17a in Foxp3KO bone marrow chimera-derived wild-type and Bcl6-/- Tconv cells with expression normalized to tubb5. Data show average expression from 4 mice for (WT: Foxp3KO) group and 3 mice for (KO:Foxp3KO) group.
**p<0.01, ****p<0.0001 (Student's t-test) (error bars=s.e.m.)
Bcl6 represses the expression of both Treg and Th2 genes in the Treg lineage
In order to understand the functional defects that can explain the selective failure of Bcl6-/- Tregs to control Th2 inflammatory responses, we performed a gene expression microarray using mRNA from highly purified CD4+CD25+Foxp3+ Tregs from wild-type and Bcl6-/- mice, activated in vitro. We found a large number of gene differences between wild-type and Bcl6-/- Tregs, with 833 genes being up-regulated more than 1.5-fold in Bcl6-/- Treg cells in a statistically significant manner. Several of these up-regulated genes were genes critical for Treg function, such as Foxp3, Il2ra, Ctla4 and Tgfb1 (Fig. 5A, B). Transcript for Ebi3, a component of the suppressive cytokine IL-35 (35, 36), was elevated, where as Il12a, encoding the other component of IL-35 was mildly decreased. Il10 and Granzyme b (gzmb) were markedly up-regulated in Bcl6-/- Tregs (Fig. 5A, B), and have been previously reported as Bcl6 targets in T cells (4, 37), indicating that Bcl6 is a repressor of gene expression in Treg cells. Many of the genes increased in Bcl6-/- Tregs were also increased in CD25hiCD4+ T cells isolated from Bcl6-/- mice (17). However, CD25hiCD4+ T cells in Bcl6-/- mice are contaminated with Foxp3neg Th2 effector cells, and are not a pure Treg population (data not shown). Our data with purified CD4+CD25+Foxp3+ Tregs identifies genes regulated by Bcl6 specifically in Tregs. The increased expression of Treg suppressor genes, particularly Il10, in Bcl6-/- Treg cells can explain the enhanced ability of Bcl6-/- Tregs to limit T cell proliferation in vitro and colitis in vivo, but does not explain the effect of Bcl6-/- Tregs on Th2 inflammation. Strikingly, however, we noted increased expression of multiple Th2 lineage genes in Bcl6-/- Tregs (Fig. 5A, B), most notably Gata3, c-maf, Ccr8, and the Th2 cytokines Il4, Il5 and Il13. Importantly, only Th2 lineage genes, but not Th1 and Th17 lineage genes, were significantly up-regulated in Bcl6-/- Tregs (Fig. 5A). Several chemokine receptor genes were up-regulated in the Bcl6-/- Tregs, as well as other genes with important immune functions such as Csf1, Batf and Klrg1. These data indicate that Bcl6 is critical for limiting the effector profile of Treg cells, and specifically that Bcl6 is required for repression of the Th2 gene program in Tregs. Moreover, the specific up-regulation of Th2 cytokines, multiple chemokine receptors and the macrophage growth factor Csf1 might all contribute to the promotion of augmented Th2 responses by Bcl6-/- Tregs in the airway inflammation model and the KO:Foxp3KO chimeras. In the microarray, “KO2” showed a much higher expression of both Treg genes and Th2 genes than “KO1” consistent with KO2 having a greater severity of Th2 inflammation than KO1 as assessed by histology of the heart and lungs (D.V.S., A.L.D., data not shown). Th1 and Th17 genes were also modestly up-regulated in KO2, but not KO1, consistent with the reported role for Bcl6 in inhibiting Th1 and Th17 differentiation (6, 7). However, the role of Bcl6 in inhibiting Th2 responses is more dominant for the inflammatory phenotype of Bcl6-/- mice, as Tregs from both the healthy and sick Bcl6-/- mice show an increase in Th2 gene expression. This indicates that, in addition to an intrinsic role for Bcl6 in regulating Th2 gene expression in Tregs (as shown by healthier KO1), the Th2 inflammatory disease further contributes to “remodeling” of the Treg cells (as shown by sicker KO2) and both these effects contribute to defective control of Th2 responses by Bcl6-/- Tregs.
Figure 5. Bcl6-/- Tregs exhibit a hybrid Treg-Th2 phenotype.
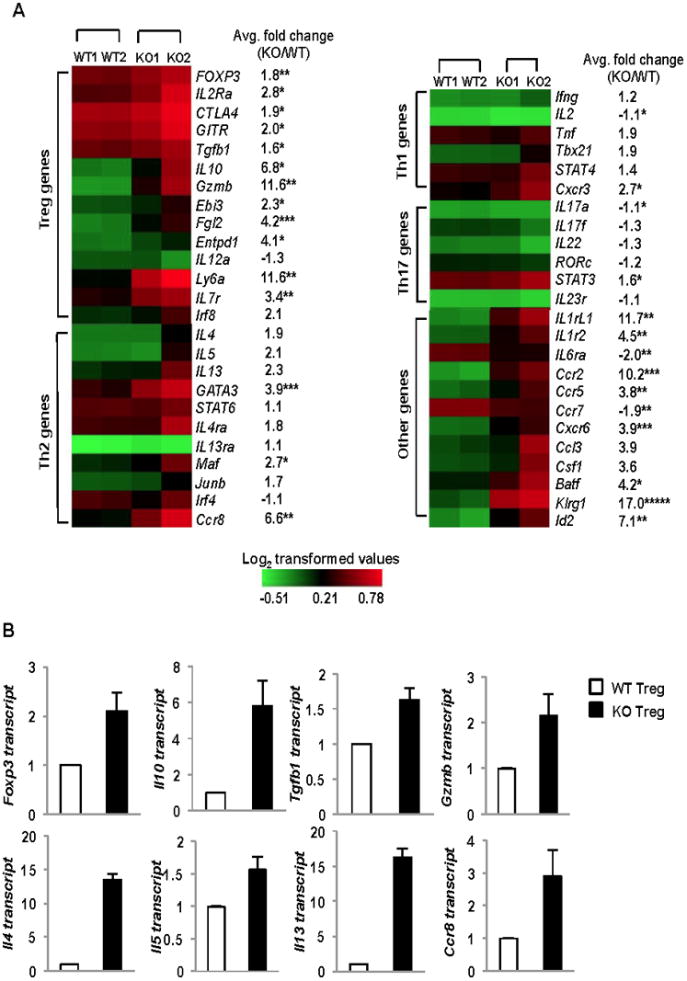
A. Heat map depiction of gene transcripts differentially expressed between sorted Tregs from Bcl6-/- or wild-type Foxp3-gfp mice, analyzed by expression microarrays. Gene expression represented as Log2 transformed values with red color representing expression greater than mean and green color representing expression less than the mean as shown in the color scale on the right (n= 2 mice per group, with 2 replicates each mouse represented as an average, KO1 – healthy, KO2 - sick). Average fold-change of KO/WT gene expression noted next to each gene row. *p<0.05, **p<0.01, ***p<0.001, ****p<0.0001 (Student's t-test for average fold-change KO/WT)
B. Quantitative PCR validation of differentially expressed genes between Bcl6-/- Tregs (black bars) and wild-type Tregs (white bars) selected from the microarray analysis following activation for 16 hrs with anti-CD3 and anti-CD28 (Treg genes - Foxp3, Il10, Tgfb1 and Gzmb) and Th2 genes (Il4, Il5, Il13 and Ccr8), with expression normalized to btub. Data are average expression from at least 3 different mice per group.
Th2 genes are intrinsically repressed by Bcl6 in Tregs
Under inflammatory conditions, Treg cells can down-regulate Foxp3 expression and convert to pro-inflammatory cells capable of producing effector cytokines (38). Using intracellular staining, we determined that the elevated GATA-3 and IL-4 expression in the Bcl6-/- Treg population was in the Foxp3+ cells, and not simply due to Tregs that lost Foxp3 expression following activation or contaminating Th2 effector cells (Fig. 6A, B, C). Thus, Foxp3+ Tregs in the Bcl6-/- mice up-regulate Th2 genes, suggesting that Bcl6 represses Th2 genes in Tregs via a Foxp3-independent mechanism. The next question was to definitively address if the up-regulated Th2 genes in Bcl6-/- Tregs were due to intrinsic regulation by Bcl6 in the Treg lineage, or were due to an indirect effect from the Th2 inflammatory disease in the Bcl6-/- mice. To test this, we generated mixed bone marrow chimeras where bone marrow from CD45.1+ wild-type Foxp3-gfp mice was injected into irradiated Rag1-/- recipient mice along with bone marrow from CD45.1– Bcl6-/- Foxp3-gfp mice (WT:KO chimeras) (Fig. 7A). After 16-20 weeks of immune reconstitution, chimeric mice were immunized with Ova-Alum to promote a Th2-type immune response, and CD45.1+ wild-type Foxp3-gfp and CD45.1– Bcl6-/- Foxp3-gfp Tregs and Tconv cells were purified and tested for gene expression following activation in vitro. As shown in Fig. 7B and Supp. Fig. 3B, Gata3 expression was increased specifically in Bcl6-/- Treg cells but not Bcl6-/- Tconv cells. Intrinsic regulation of Gata3 in Bcl6-/- Treg cells is consistent with the augmented Gata3 expression in Bcl6-/- Treg cells shown in Figure 5A and 6B, and may reflect increased auto-activation by Gata3 in the absence of Bcl6 (39). Il4 and Il10 were up-regulated 2-fold in Bcl6-/- Tregs from the chimera compared to wild-type Tregs in the same chimera, indicating that these genes are intrinsically repressed by Bcl6 in Tregs. Il5, Ifng and foxp3 genes were also higher in the Bcl6-/- Tregs, but not to the same extent as Il4 and Il10 (Fig. 7B). We also observed increased intrinsic expression of Il4, Il13 and Il10 in conventional Bcl6-/- T cells from the chimeric mice relative to wild-type Tconv cells, validating our previous work demonstrating Bcl6 as an inhibitor of Th2 responses (Supp. Fig. 3B). Consistent with the effect on Gata3, Il4 was increased to a higher relative amount in Tregs than in Tconv, indicating a greater role for Bcl6 in controlling Il4 in Tregs than in Tconv cells. Overall, the up-regulation of Th2 genes in the Bcl6-/- Treg and Tconv cells derived from mixed bone marrow chimeras was less strong compared to Th2 responses in germline Bcl6-/- mice, likely reflecting less severe Th2 inflammation in the chimeras due to the presence of functional wild-type Treg counterparts. Nevertheless, the significant up-regulation of Th2 genes in the Bcl6-/- Tregs in the chimeras strongly support an intrinsic role for Bcl6 in repressing Th2 gene expression in Tregs and their conversion to pro-inflammatory Th2 effector-like Tregs.
Figure 6. Bcl6 represses Th2 genes in Tregs, independent of Foxp3 expression.

A. (Left) Representative FACS plot depicting expression of GATA3 in freshly isolated Foxp3+ and Foxp3− CD4+CD25+ fractions from Bcl6-/- and wild-type mice. (Right) Bar graph representing % GATA3+Foxp3+ Treg cells in Bcl6-/- (black bar) and wild-type (white bar) mice (n = 3 per group).
B. (Left) Representative histogram depicting expression of GATA3 on freshly isolated Bcl6-/- and wild-type cells gated on CD4+CD25+Foxp3+ T cells. (Right) Mean fluorescence intensity (MFI) for GATA3 staining in the Bcl6-/- (black bar) and wild-type (white bar) Foxp3+ fraction is quantified (n = 3 per group)
C. (Left) Representative FACS plot depicting expression of IL-4 on Bcl6-/- and wild- type CD4+CD25+Foxp3+ fraction following stimulation with PMA and Ionomycin (Right) Scatter plot represents % IL-4+Foxp3+ Treg cells in Bcl6-/- and wild-type mice (n = 5 per group).
(A-C) *p<0.05 (Student's t-test) (error bars=s.e.m.)
Figure 7. Bcl6 intrinsically represses Th2 genes in Tregs.

A. Scheme for mixed bone marrow chimeras (WT:KO); Tregs were gated as CD4+CD25+Foxp3+ (GFP+) T cells, prior to gating WT and KO based on CD45.1 expression.
B. Quantitative PCR analysis of Gata3, Il4, Il10, Il5, Ifng and Foxp3 in sorted bone marrow chimera-derived Bcl6-/- (CD45.1−) and wild-type (CD45.1+) Tregs with expression normalized to tubb5. Data show average expression from 6 different mice per group. *p<0.05, ***p<0.001 (Student's t-test) (error bars=s.e.m.)
Bcl6 represses Gata3 transcriptional activity
To mechanistically understand how Bcl6 intrinsically regulates Th2 cytokine expression, we analyzed the regulation of Gata3 by Bcl6. While previous work from our lab showed that Bcl6 could repress Gata3 protein expression in a post-transcriptional manner (4), the degree to which Bcl6 repressed Gata3 transcriptional function has remained unclear. We therefore tested the ability of Bcl6 to repress Gata3 transactivation. We initially used an approach where Stat6-/- T cells were transduced with Gata3-expressing retrovirus, with and without co-transduction of Bcl6-expressing retroviruses. As shown in Figure 8A, transduction of Bcl6 essentially ablated the induction of Il4 and Il5 by Gata3, showing that Bcl6 could strongly repress Gata3-dependent Th2 cytokine expression. Bcl6 did not repress Tnfa, indicating a restricted role for Bcl6 in repression of Th2 cytokine genes that are activated by Gata3. To further examine the repression of Gata3 function by Bcl6, we utilized a transient transfection assay where luciferase expression is under control of the Il5 promoter. As shown in Figure 8B and 8C, Gata3 alone strongly activates the Il5 promoter, and Bcl6 alone weakly represses Il5 promoter activity. When expressed together, Bcl6 potently represses Gata3-induced Il5 promoter activity, showing that Bcl6 can directly target and inhibit the transcriptional activity of Gata3. This repressive function occurs even in B cells (Fig. 8C), thus showing that Bcl6 inhibits Gata3 independent of endogenous Gata3 and does not require other T cell specific factors. These data indicate a model wherein Treg cells, increased levels of Gata3 transcriptional activity in the absence of Bcl6 would lead to increased Th2 lineage gene expression in Tregs. Also since Gata3 can autoactivate its own expression (39), this could further solidify the Th2 lineage gene program in Bcl6-/- Tregs.
Figure 8. Bcl6 represses Gata3 transcriptional activity.

A. Quantitative PCR analysis of relative cytokine gene expression (Il4, Il5, Tnfa) for Stat6-/- T cells retrovirally transduced with control RV, hCD4-Gata3 RV alone and double transduction of hCD4-Gata3 RV and H2Kk-Bcl6 RV. Transduced cells were sorted using RV markers - hCD4 and H2Kk and then re-stimulated with anti-CD3 and anti-CD28 for 4 hrs for analysis of gene expression. Expression normalized to btub. **p<0.01 (One-way analysis of variance)
B. Luciferase activity in Jurkat T cells co-transfected with IL-5 promoter driven luciferase reporter and expression constructs for CXN, CXN-Gata3, CXN-Bcl6 and CXN-Gata3 plus CXN-Bcl6. Following electroporation, cells were stimulated with PMA and Ionomycin for 24 hrs prior to harvest and luciferase measurement. Results representative of 5 independent experiments.
C. Luciferase activity in M12 B cells electroporated with IL-5 promoter driven luciferase reporter plus expression constructs for Gata3 alone, Bcl6 alone or Gata3 plus Bcl6. After electroporation, cells were stimulated with PMA plus dibutyryl cAMP for 24hrs prior to harvest and luciferase measurement. Results representative of 2 independent experiments.
(B-C) **p<0.01, ***p<0.001 (Student's t-test) (error bars= s.e.m.).
Discussion
In the past few years, Bcl6 has emerged as a central regulator of T helper cell differentiation. However the role of Bcl6 in Treg cell function has not been completely elucidated, particularly in terms of controlling inflammation. In this study, we have shown that Bcl6 function in Tregs is specifically required for the ability of Treg cells to suppress Th2-type inflammation. These results provide an explanation for the Th2-type inflammation that is a hallmark of Bcl6-/- mice (1-3). The inflammatory disease in Bcl6-/- mice is dependent upon T cells (Suppl. Table 1), and our results here indicate that the Th2 inflammatory responses increase in severity due to defective Treg activity in Bcl6-/- mice. Moreover, in the absence of Bcl6, Tregs develop a Th2-type pro-inflammatory phenotype, showing that Bcl6 is a key transcriptional regulator of Treg function.
Other transcription factors have been shown to control the ability of Tregs to regulate specific types of T cell responses. Irf4-/- Tregs fail to suppress autoimmune Th2 responses (12). Unlike Bcl6-/- Tregs, Irf4-/- Tregs have decreased expression of Th2 genes, and the inability of Irf4-/- Tregs to control Th2 responses fits with a model where Tregs co-opt the regulatory program of the specific T helper cell response they are suppressing (11-13). Additionally, Irf4 expression is not changed in Bcl6-/- Tregs (Fig. 5A), consistent with Bcl6 and Irf4 operating through distinct mechanisms in Tregs. Foxp3 itself is a critical inhibitor of Th2 cytokine expression; in two different mouse models of attenuated Foxp3 expression, Tregs expressed Th2 cytokines and promoted Th2 responses (40-42). Bcl6-/- Tregs express both Th2 cytokines and elevated levels of Foxp3 (Fig 5). Thus, Bcl6 represses Th2 gene expression by a Foxp3-independent pathway, by repressing Gata3 function.
An important issue is how Bcl6-/- Tregs exacerbate Th2 responses in the airway inflammation model. The fact that Foxp3 expression is higher in lungs receiving Bcl6-/- Tregs than wild-type Tregs (Fig. 3B) indicates that Bcl6-/- Tregs are not simply down-regulating Foxp3 when exposed to an inflammatory environment. Thus, one possibility is that Bcl6-/- Tregs promote Th2 inflammation by secreting Th2 cytokines that mimic Th2 effector activity and/or amplify further Th2 differentiation, and that in vivo this effect over-rides the suppressive functions. While we have observed that supernatants from Bcl6-/- Tregs can promote Th2 differentiation of naïve CD4+ T cells, the amount of IL-4 and IL-5 secreted by Bcl6-/- Treg cells is much less than what is made by activated Th2 cells in vitro (D.V.S., A.M., A.L.D., data not shown) and is unlikely to be higher than what is produced by activated Th2 cells in vivo. Another possibility is that Bcl6-/- Tregs migrate more efficiently to the inflamed organ than other cell types, due to increased expression of several chemokine receptors (Figure 5). Once in the lungs, the increased Th2 cytokines made by the Bcl6-/- Tregs are likely to upset the normal regulatory balance. For instance, IL-4 can desensitize effector T cells to the inhibitory effects of Tregs (43). Bcl6-/- Tregs may produce other factors besides IL-5 that promote eosinophil recruitment, however neither eotaxin-1 (Ccl11), eotaxin-2 (Ccl24) or eotaxin-3 (Ccl26) mRNAs were significantly increased in the Bcl6-/- Tregs (D.V.S., A.L.D., data not shown). Interestingly, we see a several fold increase in miR-21 expression in the lungs of Bcl6-/- Treg-treated mice, which has been linked to promotion of Th2 responses by inhibiting Th1 polarization (32). Thus, by targeting Il12a, miR-21 may be part of a positive feedback loop for Th2 inflammation, and thus increased miR-21 and reduced Il12a in the lungs of Bcl6-/- Treg-treated mice can explain the augmented Th2 responses. We have found that miR-21 is also increased in Bcl6-/- Tregs (D.V.S., A.L.D., manuscript in preparation), and reduced Il12a expression in Bcl6-/- Tregs due to miR-21 targeting may lead to less production of the Treg immuno-suppressive cytokine IL-35 (36) (despite increased levels of Ebi3 expression in Bcl6-/- Tregs; Fig. 5A). Bcl6-/- Tregs may have impaired ability to control Th2 responses, as IL-35 has been shown to potently suppress Th2-type allergic airway inflammation (44). Several of these mechanisms can also explain the lack of repression of Th2 responses in the KO:Foxp3KO chimeric mice.
The Th2 factor Gata3 plays a key role in Treg fitness by maintaining high levels of Foxp3 expression (14, 15). Gata3-/- Tregs have lower Foxp3 expression and decreased expression of Foxp3 target genes (14, 15). Mice with Gata3-/- Tregs develop Th1- and Th17-type inflammation likely due to reduced Treg activity (14). Wohlfert et al reported that Gata3 is induced in Tregs at mucosal surfaces (15), however wild-type Gata3-expressing Tregs do not express Th2 cytokines. In both mouse and human Tregs, Gata3 expression is regulated by IL-2 and TCR signals, independent of IL-4/Stat6 signaling (15). Previously, we demonstrated that Bcl6 regulates Gata3 and Th2 responses independently of IL-4 and Stat6 (1). Here we show that Bcl6 can potently repress Gata3 transcriptional activity and is required to inhibit Th2 cytokine expression by Tregs. The increased Gata3 expression seen in Bcl6-/- Tregs may be partially explained by an augmented ability of Gata3 to auto-activate its expression in the absence of Bcl6 (39), but also probably reflects the Th2 environment and the degree of Treg stimulation through the TCR. From our current findings, we propose that Bcl6 controls Gata3 expression in Tregs independently of IL-4 and Stat6, by dampening Gata3 transcriptional activity and modulating the ability of Gata3 to auto-activate its own expression.
Acquisition of specific T effector transcriptional programs allows Tregs to effectively curb immune responses, (11-13), however this regulatory mechanism can lead to pathogenic consequences, due to the presence of self-reactive TCRs on Tregs. Thus, Treg-acquired effector features need to be under tight control, and here we have shown that a Bcl6-mediated brake on Gata3 activity in Tregs is essential for the ability of Tregs to control Th2-type inflammation. Bcl6 is unique among transcription factors that regulate the ability of Tregs to control Th2 responses; in that Bcl6 represses Gata3 and Th2 responses in Tregs at the same time that Bcl6 is required for Tregs to properly control Th2 cell responses. Bcl6 thus prevents Tregs from acquiring Th2 effector-like characteristics, by repressing Gata3 function.
Supplementary Material
Acknowledgments
We would like to thank Susan Rice and Kim Stoner of the IU Cancer Center Flow cytometry facility for help with cell sorting. We appreciate the contributions of Arpita Mondal and Paulla Teuscher for mouse genotyping PCR assays. We would like to thank Carl McKinley for help with the airway inflammation model, and Keith Condon for histology advice and service. We acknowledge Jeanette McClintick and the Indiana University Center for Medical Genomics for their microarray services.
This work was supported by NIAID grants 1R21AI079349-01A1, 1R21AI090150-01 and 1R21AI092212-01 to A.L.D., AHA pre-doctoral fellowship 10PRE4620001 to D.V.S., and NIAID grant U19 AI070448 to M.H.K.
References
- 1.Dent AL, Hu-Li J, Paul WE, Staudt LS. T helper type 2 inflammatory disease in the absence of IL-4 and STAT6. Proc Natl Acad Sci U S A. 1998;95:13823–13828. doi: 10.1073/pnas.95.23.13823. [DOI] [PMC free article] [PubMed] [Google Scholar]
- 2.Dent AL, Shaffer AL, Yu X, Allman D, Staudt LM. Control of inflammation, cytokine expression, and germinal center formation by BCL-6. Science. 1997;276:589–592. doi: 10.1126/science.276.5312.589. [DOI] [PubMed] [Google Scholar]
- 3.Ye BH, Cattoretti G, Shen Q, Zhang J, Hawe N, de Waard R, Leung C, Nouri-Shirazi M, Orazi A, Chaganti RS, Rothman P, Stall AM, Pandolfi PP, Dalla-Favera R. The BCL-6 proto-oncogene controls germinal-centre formation and Th2- type inflammation. Nat Genet. 1997;16:161–170. doi: 10.1038/ng0697-161. [DOI] [PubMed] [Google Scholar]
- 4.Kusam S, Toney LM, Sato H, Dent AL. Inhibition of Th2 differentiation and GATA-3 expression by BCL-6. J Immunol. 2003;170:2435–2441. doi: 10.4049/jimmunol.170.5.2435. [DOI] [PubMed] [Google Scholar]
- 5.Johnston RJ, Poholek AC, DiToro D, Yusuf I, Eto D, Barnett B, Dent AL, Craft J, Crotty S. Bcl6 and Blimp-1 are reciprocal and antagonistic regulators of T follicular helper cell differentiation. Science. 2009;325:1006–1010. doi: 10.1126/science.1175870. [DOI] [PMC free article] [PubMed] [Google Scholar]
- 6.Nurieva RI, Chung Y, Martinez GJ, Yang XO, Tanaka S, Matskevitch TD, Wang YH, Dong C. Bcl6 mediates the development of T follicular helper cells. Science. 2009;325:1001–1005. doi: 10.1126/science.1176676. [DOI] [PMC free article] [PubMed] [Google Scholar]
- 7.Yu D, Rao S, Tsai LM, Lee SK, He Y, Sutcliffe EL, Srivastava M, Linterman M, Zheng L, Simpson N, Ellyard JI, Parish IA, Ma CS, Li QJ, Parish CR, Mackay CR, Vinuesa CG. The transcriptional repressor Bcl-6 directs T follicular helper cell lineage commitment. Immunity. 2009;31:457–468. doi: 10.1016/j.immuni.2009.07.002. [DOI] [PubMed] [Google Scholar]
- 8.Hori S, Nomura T, Sakaguchi S. Control of regulatory T cell development by the transcription factor Foxp3. Science. 2003;299:1057–1061. doi: 10.1126/science.1079490. [DOI] [PubMed] [Google Scholar]
- 9.Fontenot JD, Gavin MA, Rudensky AY. Foxp3 programs the development and function of CD4+CD25+ regulatory T cells. Nat Immunol. 2003;4:330–336. doi: 10.1038/ni904. [DOI] [PubMed] [Google Scholar]
- 10.Fontenot JD, Rasmussen JP, Williams LM, Dooley JL, Farr AG, Rudensky AY. Regulatory T cell lineage specification by the forkhead transcription factor foxp3. Immunity. 2005;22:329–341. doi: 10.1016/j.immuni.2005.01.016. [DOI] [PubMed] [Google Scholar]
- 11.Koch MA, Tucker-Heard G, Perdue NR, Killebrew JR, Urdahl KB, Campbell DJ. The transcription factor T-bet controls regulatory T cell homeostasis and function during type 1 inflammation. Nat Immunol. 2009;10:595–602. doi: 10.1038/ni.1731. [DOI] [PMC free article] [PubMed] [Google Scholar]
- 12.Zheng Y, Chaudhry A, Kas A, deRoos P, Kim JM, Chu TT, Corcoran L, Treuting P, Klein U, Rudensky AY. Regulatory T-cell suppressor program co-opts transcription factor IRF4 to control T(H)2 responses. Nature. 2009;458:351–356. doi: 10.1038/nature07674. [DOI] [PMC free article] [PubMed] [Google Scholar]
- 13.Chaudhry A, Rudra D, Treuting P, Samstein RM, Liang Y, Kas A, Rudensky AY. CD4+ regulatory T cells control TH17 responses in a Stat3-dependent manner. Science. 2009;326:986–991. doi: 10.1126/science.1172702. [DOI] [PMC free article] [PubMed] [Google Scholar]
- 14.Wang Y, Su MA, Wan YY. An essential role of the transcription factor GATA-3 for the function of regulatory T cells. Immunity. 2011;35:337–348. doi: 10.1016/j.immuni.2011.08.012. [DOI] [PMC free article] [PubMed] [Google Scholar]
- 15.Wohlfert EA, Grainger JR, Bouladoux N, Konkel JE, Oldenhove G, Ribeiro CH, Hall JA, Yagi R, Naik S, Bhairavabhotla R, Paul WE, Bosselut R, Wei G, Zhao K, Oukka M, Zhu J, Belkaid Y. GATA3 controls Foxp3 regulatory T cell fate during inflammation in mice. J Clin Invest. 2011;121:4503–4515. doi: 10.1172/JCI57456. [DOI] [PMC free article] [PubMed] [Google Scholar]
- 16.Linterman MA, Pierson W, Lee SK, Kallies A, Kawamoto S, Rayner TF, Srivastava M, Divekar DP, Beaton L, Hogan JJ, Fagarasan S, Liston A, Smith KG, Vinuesa CG. Foxp3(+) follicular regulatory T cells control the germinal center response. Nat Med. 2011;17:975–982. doi: 10.1038/nm.2425. [DOI] [PMC free article] [PubMed] [Google Scholar]
- 17.Chung Y, Tanaka S, Chu F, Nurieva RI, Martinez GJ, Rawal S, Wang YH, Lim H, Reynolds JM, Zhou XH, Fan HM, Liu ZM, Neelapu SS, Dong C. Follicular regulatory T cells expressing Foxp3 and Bcl-6 suppress germinal center reactions. Nat Med. 2011;17:983–988. doi: 10.1038/nm.2426. [DOI] [PMC free article] [PubMed] [Google Scholar]
- 18.Toney LM, Cattorretti G, Graf JA, Merghoub T, Pandolfi PP, Dalla-Favera R, Ye BH, Dent AL. BCL-6 regulates chemokine gene transcription in macrophages. Nat Immunol. 2000;1:214–220. doi: 10.1038/79749. [DOI] [PubMed] [Google Scholar]
- 19.Ostanin DV, Bao J, Koboziev I, Gray L, Robinson-Jackson SA, Kosloski-Davidson M, Price VH, Grisham MB. T cell transfer model of chronic colitis: concepts, considerations, and tricks of the trade. Am J Physiol Gastrointest Liver Physiol. 2009;296:G135–146. doi: 10.1152/ajpgi.90462.2008. [DOI] [PMC free article] [PubMed] [Google Scholar]
- 20.Chang HC, Sehra S, Goswami R, Yao W, Yu Q, Stritesky GL, Jabeen R, McKinley C, Ahyi AN, Han L, Nguyen ET, Robertson MJ, Perumal NB, Tepper RS, Nutt SL, Kaplan MH. The transcription factor PU.1 is required for the development of IL-9-producing T cells and allergic inflammation. Nat Immunol. 2010;11:527–534. doi: 10.1038/ni.1867. [DOI] [PMC free article] [PubMed] [Google Scholar]
- 21.Presser K, Schwinge D, Wegmann M, Huber S, Schmitt S, Quaas A, Maxeiner JH, Finotto S, Lohse AW, Blessing M, Schramm C. Coexpression of TGF-beta1 and IL-10 enables regulatory T cells to completely suppress airway hyperreactivity. J Immunol. 2008;181:7751–7758. doi: 10.4049/jimmunol.181.11.7751. [DOI] [PubMed] [Google Scholar]
- 22.Chang HC, Zhang S, Thieu VT, Slee RB, Bruns HA, Laribee RN, Klemsz MJ, Kaplan MH. PU.1 Expression Delineates Heterogeneity in Primary Th2 Cells. Immunity. 2005;22:693–703. doi: 10.1016/j.immuni.2005.03.016. [DOI] [PubMed] [Google Scholar]
- 23.Mondal A, Sawant D, Dent AL. Transcriptional repressor BCL6 controls Th17 responses by controlling gene expression in both T cells and macrophages. J Immunol. 2010;184:4123–4132. doi: 10.4049/jimmunol.0901242. [DOI] [PubMed] [Google Scholar]
- 24.Vasanwala FH, Kusam S, Toney LM, Dent AL. Repression of AP-1 function: a mechanism for the regulation of Blimp-1 expression and B lymphocyte differentiation by the B cell lymphoma-6 protooncogene. J Immunol. 2002;169:1922–1929. doi: 10.4049/jimmunol.169.4.1922. [DOI] [PubMed] [Google Scholar]
- 25.Zhang DH, Yang L, Ray A. Differential responsiveness of the IL-5 and IL-4 genes to transcription factor GATA-3. J Immunol. 1998;161:3817–3821. [PubMed] [Google Scholar]
- 26.Zabransky DJ, Nirschl CJ, Durham NM, Park BV, Ceccato CM, Bruno TC, Tam AJ, Getnet D, Drake CG. Phenotypic and functional properties of Helios+ regulatory T cells. PLoS One. 2012;7:e34547. doi: 10.1371/journal.pone.0034547. [DOI] [PMC free article] [PubMed] [Google Scholar]
- 27.Verhagen J, Wraith DC. Comment on “Expression of Helios, an Ikaros transcription factor family member, differentiates thymic-derived from peripherally induced Foxp3+ T regulatory cells”. J Immunol. 2010;185:7129. doi: 10.4049/jimmunol.1090105. author reply 7130. [DOI] [PubMed] [Google Scholar]
- 28.Gottschalk RA, Corse E, Allison JP. Expression of Helios in peripherally induced Foxp3+ regulatory T cells. J Immunol. 2011;188:976–980. doi: 10.4049/jimmunol.1102964. [DOI] [PubMed] [Google Scholar]
- 29.Akimova T, Beier UH, Wang L, Levine MH, Hancock WW. Helios expression is a marker of T cell activation and proliferation. PLoS One. 2011;6:e24226. doi: 10.1371/journal.pone.0024226. [DOI] [PMC free article] [PubMed] [Google Scholar]
- 30.Josefowicz SZ, Niec RE, Kim HY, Treuting P, Chinen T, Zheng Y, Umetsu DT, Rudensky AY. Extrathymically generated regulatory T cells control mucosal TH2 inflammation. Nature. 2012;482:395–399. doi: 10.1038/nature10772. [DOI] [PMC free article] [PubMed] [Google Scholar]
- 31.Lu TX, Munitz A, Rothenberg ME. MicroRNA-21 is up-regulated in allergic airway inflammation and regulates IL-12p35 expression. J Immunol. 2009;182:4994–5002. doi: 10.4049/jimmunol.0803560. [DOI] [PMC free article] [PubMed] [Google Scholar]
- 32.Lu TX, Hartner J, Lim EJ, Fabry V, Mingler MK, Cole ET, Orkin SH, Aronow BJ, Rothenberg ME. MicroRNA-21 limits in vivo immune response-mediated activation of the IL-12/IFN-gamma pathway, Th1 polarization, and the severity of delayed-type hypersensitivity. J Immunol. 2011;187:3362–3373. doi: 10.4049/jimmunol.1101235. [DOI] [PMC free article] [PubMed] [Google Scholar]
- 33.Singh N, Chandler PR, Seki Y, Baban B, Takezaki M, Kahler DJ, Munn DH, Larsen CP, Mellor AL, Iwashima M. Role of CD28 in fatal autoimmune disorder in scurfy mice. Blood. 2007;110:1199–1206. doi: 10.1182/blood-2006-10-054585. [DOI] [PMC free article] [PubMed] [Google Scholar]
- 34.Liston A, Lu LF, O'Carroll D, Tarakhovsky A, Rudensky AY. Dicer-dependent microRNA pathway safeguards regulatory T cell function. J Exp Med. 2008;205:1993–2004. doi: 10.1084/jem.20081062. [DOI] [PMC free article] [PubMed] [Google Scholar]
- 35.Collison LW, Chaturvedi V, Henderson AL, Giacomin PR, Guy C, Bankoti J, Finkelstein D, Forbes K, Workman CJ, Brown SA, Rehg JE, Jones ML, Ni HT, Artis D, Turk MJ, Vignali DA. IL-35-mediated induction of a potent regulatory T cell population. Nat Immunol. 2010;11:1093–1101. doi: 10.1038/ni.1952. [DOI] [PMC free article] [PubMed] [Google Scholar]
- 36.Collison LW, Workman CJ, Kuo TT, Boyd K, Wang Y, Vignali KM, Cross R, Sehy D, Blumberg RS, Vignali DA. The inhibitory cytokine IL-35 contributes to regulatory T-cell function. Nature. 2007;450:566–569. doi: 10.1038/nature06306. [DOI] [PubMed] [Google Scholar]
- 37.Yoshida K, Sakamoto A, Yamashita K, Arguni E, Horigome S, Arima M, Hatano M, Seki N, Ichikawa T, Tokuhisa T. Bcl6 controls granzyme B expression in effector CD8+ T cells. Eur J Immunol. 2006;36:3146–3156. doi: 10.1002/eji.200636165. [DOI] [PubMed] [Google Scholar]
- 38.Zhou X, Bailey-Bucktrout SL, Jeker LT, Penaranda C, Martinez-Llordella M, Ashby M, Nakayama M, Rosenthal W, Bluestone JA. Instability of the transcription factor Foxp3 leads to the generation of pathogenic memory T cells in vivo. Nat Immunol. 2009;10:1000–1007. doi: 10.1038/ni.1774. [DOI] [PMC free article] [PubMed] [Google Scholar]
- 39.Ouyang W, Lohning M, Gao Z, Assenmacher M, Ranganath S, Radbruch A, Murphy KM. Stat6-Independent GATA-3 Autoactivation Directs IL-4-Independent Th2 Development and Commitment. Immunity. 2000;12:27–37. doi: 10.1016/s1074-7613(00)80156-9. [DOI] [PubMed] [Google Scholar]
- 40.Wan YY, Flavell RA. Regulatory T-cell functions are subverted and converted owing to attenuated Foxp3 expression. Nature. 2007;445:766–770. doi: 10.1038/nature05479. [DOI] [PubMed] [Google Scholar]
- 41.Wang Y, Souabni A, Flavell RA, Wan YY. An intrinsic mechanism predisposes Foxp3-expressing regulatory T cells to Th2 conversion in vivo. J Immunol. 2010;185:5983–5992. doi: 10.4049/jimmunol.1001255. [DOI] [PMC free article] [PubMed] [Google Scholar]
- 42.Kitoh A, Ono M, Naoe Y, Ohkura N, Yamaguchi T, Yaguchi H, Kitabayashi I, Tsukada T, Nomura T, Miyachi Y, Taniuchi I, Sakaguchi S. Indispensable role of the Runx1-Cbfbeta transcription complex for in vivo-suppressive function of FoxP3+ regulatory T cells. Immunity. 2009;31:609–620. doi: 10.1016/j.immuni.2009.09.003. [DOI] [PubMed] [Google Scholar]
- 43.Pillemer BB, Qi Z, Melgert B, Oriss TB, Ray P, Ray A. STAT6 activation confers upon T helper cells resistance to suppression by regulatory T cells. J Immunol. 2009;183:155–163. doi: 10.4049/jimmunol.0803733. [DOI] [PMC free article] [PubMed] [Google Scholar]
- 44.Huang CH, Loo EX, Kuo IC, Soh GH, Goh DL, Lee BW, Chua KY. Airway Inflammation and IgE Production Induced by Dust Mite Allergen-Specific Memory/Effector Th2 Cell Line Can Be Effectively Attenuated by IL-35. J Immunol. 2011;187:462–471. doi: 10.4049/jimmunol.1100259. [DOI] [PubMed] [Google Scholar]
Associated Data
This section collects any data citations, data availability statements, or supplementary materials included in this article.