Abstract
Surface topology, e.g. of cells growing on a substrate, is determined with nanometer precision by Variable-Angle Total Internal Reflection Fluorescence Microscopy (VA-TIRFM). Cells are cultivated on transparent slides and incubated with a fluorescent marker homogeneously distributed in their plasma membrane. Illumination occurs by a parallel laser beam under variable angles of total internal reflection (TIR) with different penetration depths of the evanescent electromagnetic field. Recording of fluorescence images upon irradiation at about 10 different angles permits to calculate cell-substrate distances with a precision of a few nanometers. Differences of adhesion between various cell lines, e.g. cancer cells and less malignant cells, are thus determined. In addition, possible changes of cell adhesion upon chemical or photodynamic treatment can be examined. In comparison with other methods of super-resolution microscopy light exposure is kept very small, and no damage of living cells is expected to occur.
Keywords: Bioengineering, Issue 68, Cellular Biology, Molecular Biology, Biophysics, Physics, Cell adhesion, fluorescence microscopy, TIRFM, nanotopology
Introduction
When a light beam propagating through a medium of refractive index n1 meets an interface to a second medium of refractive index n2 < n1, total internal reflection occurs at all angles of incidence Θ, which are greater than the critical angle Θc=arcsin(n2/n1). Despite being totally reflected the incident light beam evokes an evanescent electromagnetic field that penetrates into the second medium and decays exponentially with perpendicular distance z from the interface according to I(z) = I0 e-z/d(Θ). I(z) corresponds to the intensity of the electromagnetic field and d(Θ) to the penetration depth at wavelength λ, as given by d(Θ) = (λ/4π) (n12 sin2Θ - n22)-1/2
As reported in the literature1,2, I0 corresponds to the intensity of incident light Ie multiplied with the transmission factor T(Θ) and the ratio n2/n1. If the electric field vector of this light beam is polarized perpendicular to the plane of incidence (i.e. the plane spanned by the incident and the reflected beam), this transmission factor is given by T(Θ) = 4 cos2 Θ / [1 - (n2/nL1)2]
For the detected fluorescence intensity in TIRFM measurements, light absorption has to be integrated over all layers of the sample and multiplied with the fluorescence quantum yield η of the relevant dye as well as with the solid angle of detection Ω. As reported previously3, this intensity can be described by IF (Θ) = A T(Θ)òc(z) e-z/d(Θ) dz
if all factors which are independent from the angle of incidence Θ and the coordinate z are included within the experimental constant A. Equation 3 can be solved analytically, if the concentration c(z) of fluorophores is regarded to be almost constant
- either at all coordinates z ≥ Δ, e.g. within the cytoplasm of cells having a distance Δ from the interface. In this case, the integral has to be calculated from z= Δ to z= ∞ resulting in IF = A c T(Θ) d(Θ) e-Δ/d(Θ)
- or between z = Δ - t/2 and z = Δ + t/2, i.e. within a thin layer of thickness t, e.g. a cell membrane located at a distance Δ from the interface. In this case, the fluorescence intensity can be calculated as IF = A c T(Θ) t e-Δ/d(Θ), if t is small in comparison with Δ.
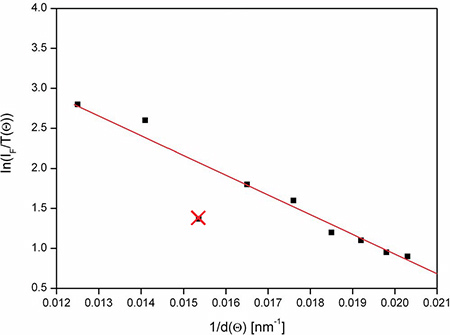
From Equations (4) and (5) cell-substrate distances Δ can be calculated, if images of fluorescence intensity IF are recorded for variable angles Θ, and if ln (IF / T d) (Eq. 4) or ln (IF / T) (Eq. 5) is evaluated as a function of 1/d for these angles. For the membrane marker laurdan used in this paper (s. below) the evaluation was performed according to Eq. 5.
As reported previously3, image acquisition and evaluation requires - homogenous distribution of excitation light over the sample, - validity of a 2-layer model (with the refractive indices n1 and n2 for the substrate and the cytoplasm, respectively). This holds, if the plasma membrane is very thin, and if the layer of the extracellular medium (between the cell and the substrate) is small compared with the wavelength of incident light.
In addition, a moderate numerical aperture (typically A ≤ 0.90) of the microscope objective lens is advantageous to avoid deviations of brightness due to anisotropy of radiation in the near field of the dielectric interface.
Protocol
1. Seeding and Incubation of Cells
Seed individual cells, e.g. U373-MG or U-251-MG glioblastoma cells at a typical density of 100 cells/mm2 on a glass slide and grow them for 4872 hr in culture medium (e.g. RPMI 1640 supplemented with 10% fetal calf serum and antibiotics) using an incubator at 37 °C and 5% CO2.
Incubate cells with a membrane marker, e.g. 6-dodecanoyl-2-dimethylamino naphthalene (laurdan) applied for 60 min at a concentration of 8 μM (in culture medium)4, or a cytoplasm marker, e.g. calcein acetomethlyester applied for 40 min at a concentration of 5 μM3, or a membrane associated photosensitizer, e.g. protoporphyrin IX induced upon 4 hr incubation with its precursor 5-aminolevulinic acid (5-ALA; 1 mM)4,5.
Wash the cells with culture medium or phosphate buffered saline (PBS) prior to fluorescence microscopy.
2. VA-TIRFM
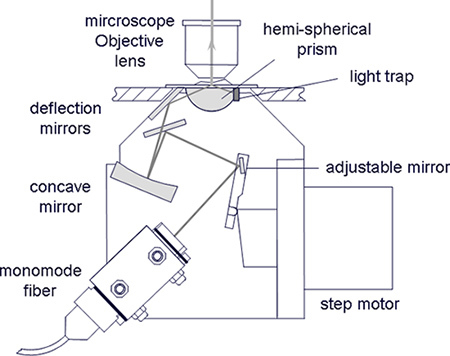
Use an upright microscope, e.g. Zeiss Axioplan, and replace its condenser by an illumination device, as described in Ref. 3 with a hemi-spherical or a hemi-cylindrical glass prism optically coupled to the object slide (see Figure 1).
Use a parallel collimated laser beam which after imaging by the glass prism and further optical components (e.g. concave mirror) again results in a parallel beam on the surface of the sample (telecentric pupil ray). Take care that the electrical field vector is polarized perpendicular to the plane of incidence.
Use an adjustable mirror located inside the condenser which is imaged in the sample plane and illuminates the sample under a variable angle of incidence (object ray). The adjustable mirror may be driven by a step motor, where each position corresponds to a well defined angle of incidence, as determined by goniometric measurements3.
Calibrate the angular position of the adjustable mirror using the critical angle Θc=61.3° for a glass-water transition as a fixed value. Θc can be visualized upon variation of Θ when a fluorescent dye (e.g. 1 mM flavin mononucleotide, FMN) is dissolved in water. The position of the mirror at Θ=Θc is stored in the mirror positioning program.
Set the parameters of the camera (back illuminated Andor Ixon EMCCD, DV887DC, ANDOR Technology, Belfast , U.K.6), including temperature, gain, recording time and shift speed.
Use an objective lens of appropriate magnification and preferentially moderate numeric aperture (e.g. 40×/0.75 or 63×/0.90 water immersion) and localize the object slide in the microscope. Use immersion oil to assure optical contact of the sample with the glass prism. Record fluorescence images of identical samples upon variation of the angle of illumination (Θ≥Θc with Θc corresponding to 64.5° for a cell-glass interface). An angular range of 66°-74° with steps of 0.5° or 1° is recommended. Use an appropriate long pass or band pass filter for fluorescence detection.
3. Data Analysis
Read the images (e.g. in ASCII format) recorded at various angles Θ, as well as the camera settings (for background discrimination), the excitation wavelength and the refractive indices for glass (n1 = 1.52) and cells (n2 = 1.37) into the evaluation program (LabView; NanoCell). For each set of parameters the penetration depth d(Θ) and the transmission factor T(Θ) are calculated automatically.
Select images used for evaluation of cell-substrate distances Δ according to Equation 5 (membrane marker) or Equation 4 (cytoplasm marker), Individual images with inhomogeneous illumination (revealing e,g. stripes) may be excluded.
Calculate images of cell-substrate topology and select an appropriate color code for display. During evaluation profiles of individual pixels can be displayed, as depicted in Figure 2. These profiles may be used as an indicator for the quality of the fit.
Store the evaluation protocol.
4. Representative Results
Representative experiments are carried out with genetically engineered U251-MG glioblastoma cells kindly supplied by Prof. Jan Mollenhauer, Dept. of Molecular Oncology, University of South Denmark, Odense. In two subclones of those U251 cells the tumour suppressor genes TP53 or PTEN are over-expressed using a Tet-On inducible expression system, such that these cells exhibit a reduced tumorigenic potential and may be regarded as less malignant. Highly malignant U251-MG cells without suppressor gene are used as controls, and U251-MG wild type cells serve for a further comparison. A laser diode emitting a quasi continuous series of picosecond pulses (LDH400 with driver PDL 800-B, Picoquant, Berlin, Germany; wavelength: 391 nm; pulse energy: 12 pJ; repetition rate: 40 MHz) is used as an excitation source.
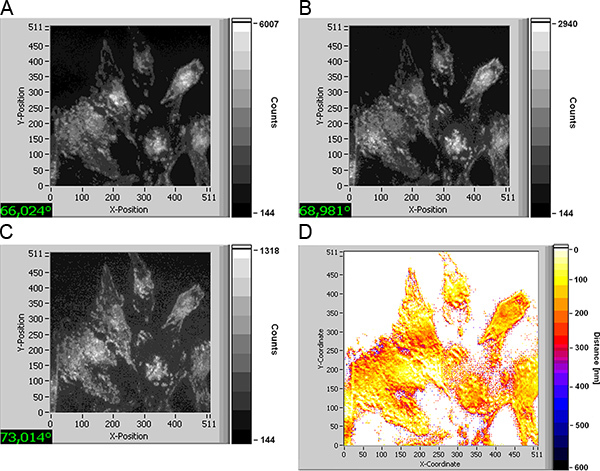
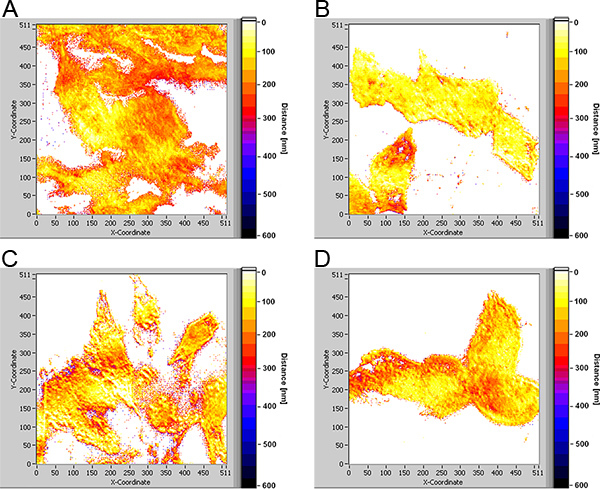
In Figure 3 TIRFM images of U251-MG glioblastoma cells with an activated TP53 tumour suppressor gene and incubated with laurdan (8 μM; 60 min) are depicted for angles of incidence of 66.0°, 69.0° and 73.0° corresponding to penetration depths of the evanescent electromagnetic field of about 140 nm, 75 nm and 60 nm, respectively. With decreasing penetration depth fluorescence decreases in intensity (see scales) and originates from more superficial sites of the cells (e.g. focal contacts on their edges). Cell-substrate distances (visualized in Figure 3d by a color code ranging from 0-600 nm) strongly vary over the cells between only a few nanometers (white-yellow) and 250-300 nm (dark red), i.e. focal contacts and larger cell-substrate distances are in close vicinity. The same holds for U251-MG glioblastoma cells with an activated suppressor gene PTEN (Figure 4d), while cell-substrate distances are rather constant for U251-MG control and wild type cells with typical values of 80-100 nm (yellow; Figure 4b) and 150-200 nm (orange-red; Figure 4a).
 Figure 1. Illumination device for VA-TIRFM in an upright microscope. An adjustable mirror driven by a step motor permits an angular resolution of ±0.25°.
 Figure 2. Evaluation profile for one pixel (schematic). When ln[IF/T(Θ)] is plotted as a function of 1/d(Θ), the slope represents the cell-substrate distance Δ. This slope is commonly determined with a precision of about ±10%. One value - resulting from inhomogeneous illumination - has been marked and excluded from evaluation.
 Figure 3. TIRFM images of U251-MG glioblastoma cells with activated TP53 suppressor gene upon incubation with laurdan (8 μM; 60 min) recorded at various angles of illumination (a-c); cell-substrate distances in the range of 0-600 nm shown by a color code (d); excitation wavelength: 391 nm, detection: ≥420 nm; image size: 210 μm × 210 μm. Click here to view larger figure.
 Figure 4. Cell-substrate distances of U251-MG glioblatoma cells in the range of 0-600 nm shown by a color code; (a) wild type (b) controls; (c) cells with activated suppressor gene TP53; (d) cells with activated suppressor gene PTEN; excitation wavelength: 391 nm, detection: ≥420 nm; image size: 210 μm × 210 μm. Click here to view larger figure.
Discussion
A method is described for measuring cell-substrate distances with nanometer precision. Presently, methods of super-resolution microscopy, e.g. based on structured illumination7 or on single molecule detection8-10 as well as stimulated emission depletion (STED) microscopy11 are of considerable interest. None of these techniques, however, permits an axial resolution below 50 nm. In addition, rather high irradiance of 50100 W/cm2 is needed for single molecule methods and more than 3,000 W/cm2 for STED microscopy. This exceeds solar irradiance (about 100 mW/cm2) by several orders of magnitude, so that rapid damage to living cells is likely to occur. In VA-TIRFM experiments, however, irradiance can be limited to less than 20 mW/cm2, permitting exposure times of several minutes or even hours without any harm to living cells12, so that long-lasting experiments with multiple exposures appear well possible. Main prerequisites for each experiment are good angular calibration and homogenous illumination of clean object slides.
VA-TIRFM may be applied to numerous topics related to technical or biological surfaces, e.g. measurements of cell adhesion to a transparent substrate. Cell growth, cell migration or cell death (e.g. apoptosis) can, therefore, be studied more in detail. Recently, the role of intracellular cholesterol on cell adhesion was examined4. In particular, it turned out that the number of cell-substrate contacts was reduced upon depletion of cholesterol by 3050 %, finally leading to detachment of a larger number of cells from their substrate. Cell adhesion was also studied upon application of photosensitizers commonly used in photodynamic therapy (PDT) of cancer and other diseases13. It turned out that upon irradiation with non-phototoxic light doses cell-substrate distances were slightly reduced (possibly due to some swelling of the cell), while focal adhesions were maintained4,5. Therefore, formation of metastases due to PDT was not likely to occur. Present experiments show differences of cell adhesion between tumour (glioblastoma) and less malignant cells. Only future experiments will prove whether this different behaviour can be used for diagnostic, pharmacological or therapeutic applications.
It should be emphasized that measurements of cell-substrate contacts date back to the beginning of TIRF microscopy14. Angular resolution, however, needed rather complex equipment15, so far, and only the development of a compact illumination device for variable-angle TIRFM3 permitted routine measurements of cell-substrate topology. In addition to this prism-type TIRFM, miniaturization was introduced by objective-type TIRFM16,17, where a single spot (or annulus) close to the edge of the aperture plane of the microscope objective lens is illuminated, so that light may fall onto the sample under an angle Θ≥ΘC. Therefore, high aperture objective lenses permitting an angular range of about 66-75° are needed. Tuning of the angle Θ, however, requires a defined shift of the laser focus within a distance of less than 100 μm, which is difficult to perform, even in a commercialized TIRFM microscope. Further disadvantages of high aperture (and high magnification) objective lenses are near field anisotropy and rather limited object fields. Therefore, in comparison with objective-type TIRFM experimental setups as described in this manuscript are preferable for measuring cell-substrate topology.
Disclosures
No conflicts of interest declared.
Acknowledgments
The authors thank the Land Baden-Württemberg and the Europäische Union -Europäischer Fonds für die regionale Entwicklung - for funding ZAFH-PHOTONn, the Bundesministerium für Bildung und Forschung (BMBF) for funding research grant no. 1792C08 as well as the Baden-Württemberg-Stiftung GmbH for financing the project "Aurami".
References
- Gingell D, Todd I. Interference reflection microscopy: a quantitative theory of image interpretation and its application to cell-substratum separation measurement. Biophys. J. 1979;26:507–526. doi: 10.1016/S0006-3495(79)85268-6. [DOI] [PMC free article] [PubMed] [Google Scholar]
- Reichert WM, Truskey GA. Total internal reflection fluorescence (TIRF) microscopy (I) Modelling cell contact region fluorescence. J. Cell Sci. 1990;96:219–230. doi: 10.1242/jcs.96.2.219. [DOI] [PubMed] [Google Scholar]
- Stock K, Sailer R, Strauss WSL, Lyttek M, Steiner R, Schneckenburger H. Variable-angle total internal reflection fluorescence microscopy (VA-TIRFM): realization and application of a compact illumination device. J. Microsc. 2003;211:19–29. doi: 10.1046/j.1365-2818.2003.01200.x. [DOI] [PubMed] [Google Scholar]
- Wagner M, Weber P, Strauss WSL, Lassalle H-P, Schneckenburger H. Nanotomography of cell surfaces with evanescent fields. Adv. Opt. Technol. 2008;2008:254317. [Google Scholar]
- Lassalle H-P, Baumann H, Strauss WSL, Schneckenburger H. Cell-substrate topology upon ALA-PDT using variable-angle total internal reflection fluorescence microscopy (VA-TIRFM) J. Environ. Pathol. Toxicol Oncol. 2007;26:83–88. doi: 10.1615/jenvironpatholtoxicoloncol.v26.i2.30. [DOI] [PubMed] [Google Scholar]
- Coates CG, Denvir DJ, McHale NG, Thornbury KD, Hollywood MA. Optimizing low-light microscopy with back-illuminated electron multiplying charge-coupled device: enhanced sensitivity, speed and resolution. J. Biomed. Opt. 2004;9:1244–1252. doi: 10.1117/1.1805559. [DOI] [PubMed] [Google Scholar]
- Gustafsson MGL, Shao L, Carlton PM, Wang CJR, Golubovskaya IN, Cande WZ, Agard DA, Sedat JW. Three-dimensional resolution doubling in wide-field fluorescence microscopy by structured illumination. Biophys. J. 2008;94:4957–4970. doi: 10.1529/biophysj.107.120345. [DOI] [PMC free article] [PubMed] [Google Scholar]
- Betzig E, Patterson GH, Sougrat R, Lindwasser OW, Olenych S, Bonifacino JS, Davidson MW, Lippincott-Schwartz J, Hess HF. Imaging intracellular fluorescent proteins at nanometer resolution. Science. 2006;313:1642–1645. doi: 10.1126/science.1127344. [DOI] [PubMed] [Google Scholar]
- Hess ST, Girirajan TPK, Mason MD. Ultra-high resolution imaging by fluorescence photoactivation localization microscopy. Biophys. J. 2006;91:4258–4272. doi: 10.1529/biophysj.106.091116. [DOI] [PMC free article] [PubMed] [Google Scholar]
- Rust MJ, Bates M, Zhuang X. Sub-diffraction-limit imaging by stochastic optical reconstruction microscopy (STORM) Nat. Meth. 2006;3:793–796. doi: 10.1038/nmeth929. [DOI] [PMC free article] [PubMed] [Google Scholar]
- Willig KI, Harke B, Medda R, Hell SW. STED microscopy with continuous wave beams. Nat. Meth. 2007;4:915–918. doi: 10.1038/nmeth1108. [DOI] [PubMed] [Google Scholar]
- Schneckenburger H, Wagner M, Weber P, Bruns T, Richter V, Strauss WSL, Wittig R. Multi-Dimensional Fluorescence Microscopy of Living Cells. J. Biophotonics. 2011;3:143–149. doi: 10.1002/jbio.201000098. [DOI] [PubMed] [Google Scholar]
- Dougherty TJ. Photosensitizers: therapy and detection of malignant tumours. Photochem. Photobiol. 1987;45:879–889. doi: 10.1111/j.1751-1097.1987.tb07898.x. [DOI] [PubMed] [Google Scholar]
- Axelrod D. Cell-substrate contacts illuminated by total internal reflection fluorescence. J. Cell Biol. 1981;89:141–145. doi: 10.1083/jcb.89.1.141. [DOI] [PMC free article] [PubMed] [Google Scholar]
- Ölveczky BP, Periasamy N, Verkman AS. Mapping fluorophore distribution in three dimensions by quantitstive multiple angle total internal reflection fluorescence microscopy. Biophys. J. 1997;73:2836–2847. doi: 10.1016/S0006-3495(97)78312-7. [DOI] [PMC free article] [PubMed] [Google Scholar]
- Axelrod D. Selective imaging of surface fluorescence with vry high aperture microscope objectives. J. Biomed. Opt. 2001;6:6–13. doi: 10.1117/1.1335689. [DOI] [PubMed] [Google Scholar]
- Schneckenburger H. Total internal reflection microscopy: technical innovations and novel applications. Curr. Opin. Biotechnol. 2005;16:13–18. doi: 10.1016/j.copbio.2004.12.004. [DOI] [PubMed] [Google Scholar]


