

Abstract
Male-biased genes—those expressed at higher levels in males than in females—are underrepresented on the X chromosome of Drosophila melanogaster. Several evolutionary models have been posited to explain this so-called demasculinization of the X. Here, we show that the apparent paucity of male-biased genes on the X chromosome is attributable to global X-autosome differences in expression in Drosophila testes, owing to a lack of sex chromosome dosage compensation in the male germline, but not to any difference in the density of testis-specific or testis-biased genes on the X chromosome. First, using genome-wide gene expression data from 20 tissues, we find no evidence that genes with testis-specific expression are underrepresented on the X chromosome. Second, using contrasts in gene expression profiles among pairs of tissues, we recover a statistical underrepresentation of testis-biased genes on the X but find that the pattern largely disappears once we account for the lack of dosage compensation in the Drosophila male germline. Third, we find that computationally “demasculinizing” the autosomes is not sufficient to produce an expression profile similar to that of the X chromosome in the testes. Our findings thus show that the lack of sex chromosome dosage compensation in Drosophila testes can explain the apparent signal of demasculinization on the X, whereas evolutionary demasculinization of the X cannot explain its overall reduced expression in the testes.
Keywords: Drosophila, X chromosome, sex-biased gene expression
Introduction
More than ∼4,000 genes in the Drosophila genome exhibit sex-biased gene expression, having higher transcript levels in one sex than the other (Gnad and Parsch 2006). In Drosophila melanogaster (Parisi et al. 2003, 2004) and closely related species (Ranz et al. 2003; Sturgill et al. 2007), genes with male-biased expression are overwhelmingly testes expressed and, curiously, underrepresented on the X chromosome. To explain the seemingly nonrandom genomic distribution of male-biased genes, two kinds of evolutionary models have been posited. First, a “demasculinized” X chromosome may reflect a history of sexually antagonistic natural selection (Parisi et al. 2003; Wu and Xu 2003; Sturgill et al. 2007). As the X chromosome spends two-thirds of its ancestry in females and only one-third in males, partially dominant genetic variants that are beneficial to males but deleterious to females can increase in populations when rare more readily on the autosomes than on the X (Rice 1984). Second, in many taxa, the X chromosome experiences meiotic sex chromosome inactivation (MSCI), the facultative heterochromatinization and transcriptional silencing of the sex chromosomes prior to the autosomes during early meiosis I (Lifschytz 1972; Turner 2007; Namekawa and Lee 2009). By restricting X-linked transcription in the germline, MSCI could in principle compromise optimal gene expression levels, thereby favoring the evolution of compensatory gene duplications and/or transpositions to the autosomes (Betran et al. 2002). Consistent with these models, the Drosophila genome harbors an excess of duplicated retrogenes on the autosomes that originated from parent copies on the X chromosome (Betran et al. 2002; Vibranovski et al. 2009). Both of these evolutionary models are based on the premise that the X chromosome is, for one reason or another, an unfavorable location for genes with male-specific functions.
These models describe evolved differences in the gene content of the X chromosome and the autosomes. However, the data indicating a demasculinized X come exclusively from gene expression assays (microarrays and RNA-seq) that compare relative transcript levels in males versus females or in testes versus ovaries. Previous studies reported that average relative expression from the X and the autosomes is statistically indistinguishable in the testes (Parisi et al. 2003; Gupta et al. 2006; Sturgill et al. 2007), and therefore the deficit of male-biased genes was inferred to result from a distinct gene content on the X. However, reanalysis of multiple gene expression datasets using both microarrays and RNA-seq shows that median expression levels of X-linked genes when assayed in whole testes are in fact approximately 1.5-fold lower than those of autosomal genes (Meiklejohn et al. 2011). It is therefore possible that the apparent paucity of genes with male-biased expression on the Drosophila X chromosome could result from differences in global expression levels between the X and the autosomes in testes versus ovaries, with little or no differences in evolved gene content.
Two competing models have been proposed to explain the lower overall X-linked gene expression levels in Drosophila testes. The first is that MSCI occurs in Drosophila as it does in mammals and C. elegans (Namekawa and Lee 2009), leading to reduced expression from the X chromosome versus the autosomes in the testes (Vibranovski et al. 2009). Under this hypothesis, the lower X chromosome expression in whole testis is the read-out of a mixed population of cells, including those in which the X is expressed at levels equal to the autosomes (implying X chromosome dosage compensation) and a small subset of cells, presumably early meiotic spermatocytes, in which the X is transcriptionally inactive (Vibranovski et al. 2009). However, aside from 1.5-fold lower median expression, gene expression assays show little to no evidence of stage-specific meiotic inactivation of the X (Meiklejohn et al. 2011; Mikhaylova and Nurminsky 2011), and there is no alternate, direct support for MSCI in Drosophila. The second model is that the X-autosome difference in expression results from a lack of sex chromosome dosage compensation in the Drosophila male germline (Meiklejohn et al. 2011). In the male soma of Drosophila, the sex chromosome dosage compensation complex (DCC) comprises at least five proteins and two RNAs that together facilitate hypertranscription of the single X chromosome (Gelbart and Kuroda 2009). In the male germline, however, the DCC is absent (Rastelli and Kuroda 1998), and the magnitude of the observed X-autosome expression difference in the testis is consistent with that predicted to result from haploid expression in Drosophila (Meiklejohn et al. 2011).
In this article, we revisit the observation of X chromosome demasculinization and examine the relationship between gene content and gene expression of the Drosophila X chromosome in the male germline. Specifically, we test the hypothesis that the apparent paucity of genes with male-biased expression on the Drosophila X chromosome is driven primarily by global differences in gene expression levels between the X and the autosomes, rather than differences in gene content. Our results show that global expression levels, not evolved gene content, cause the apparent underrepresentation of testis-biased genes on the X—with respect to the male germline, the Drosophila X chromosome is not demasculinized.
Materials and Methods
We compiled microarray assays of gene expression in 20 tissues and organs dissected from wild-type larval and adult D. melanogaster (FlyAtlas—Chintapalli et al. 2007; NCBI Gene Expression Omnibus accession GSE 7763), 11 tissues dissected from adult Anopheles gambiae (Baker et al. 2011; GSE 21689), and D. melanogaster bag-of-marbles (bam) mutant testis (Chen et al. 2011; GSE 28728). RNA-seq data (Gan et al. 2010) were analyzed as previously described (Meiklejohn et al. 2011). We used previously published estimates of the origination times of genes along the Drosophila phylogeny (Zhang, Vibranovski, et al. 2010).
All microarray probe sets with multiple matches to the Drosophila or Anopheles genome were excluded from the analysis. For genes with multiple probe sets, the probe set showing the strongest signal intensity across all samples was selected and all others were excluded. Signal intensities at probe sets with absent calls were arbitrarily set to 1. Array intensity values were log2 transformed and mean expression values were calculated from three or four replicate arrays for each sample. All of the microarray expression distributions were bimodal, with a lower mode that presumably corresponds to background microarray hybridization to probes matching lowly or nonexpressed genes. Microarray data sets were therefore truncated and expression values in the lower mode were excluded from all analyses except the calculation of τ. For each sample, we normalized expression distributions by the median expression level prior to identifying biased gene sets.
To ascertain the contribution of X-autosome differences in gene expression to the observed deficit of X-linked male-biased genes, we first identified genes expressed predominantly in specific tissues using a method that is less sensitive to gene expression levels than a single direct comparison between two samples (e.g., testes vs. ovaries; Parisi et al. 2003; Sturgill et al. 2007). In particular, we utilized microarray data from 20 different tissues together in a single analysis to identify broadly expressed genes versus those expressed in specific cells and tissues. To measure the degree of tissue specificity, we calculated the metric τ (Yanai et al. 2005) for each gene
 |
where Ei is log2 expression in sample i and max Ei is the maximal log2 expression level for that gene across all samples. Smoothed distributions in figure 2 were obtained using kernel density estimation and a bandwidth of one. Percent deviations (see tables 1, 3–6) were calculated as (O − E)/E × 100, where O is the observed number of X-linked or autosomal genes, and E is the expected number based on all genes in the genome. All analyses were performed in R (R Development Core Team 2011). Genes on the heterochromatic 4th chromosome were excluded from all analyses.
Fig. 2.—

A demasculinized chromosome was simulated by randomly resampling autosomal log2 gene expression values with an arbitrary fraction of testis-biased genes removed. 1,000 replicate distributions were generated by resampling autosomal genes with >2-fold greater expression in testes versus ovaries. For each distribution, we simulated a demasculinized X chromosome by sampling 1,793 genes (the number of X-linked genes in these data) with 20%, 40%, or 60% fewer testis-biased genes than would be expected given the proportion of testis-biased genes observed on the autosomes. The resampled distributions (dashed gray lines) are plotted alongside the distributions of expression profiles for all X-linked (orange) and autosomal (blue) genes. Following resampling, the median expression of the simulated demasculinized X is significantly greater (P < 0.05) than the median observed expression for the true X in all 1,000 replicates for all three levels of demasculinization.
Table 1.
Chromosomal Location of Tissue-Specific Genes (τ > 0.9)
| Tissue | X Chromosome |
Autosomes |
P (χ2 Test) | ||
|---|---|---|---|---|---|
| Observed | % Deviation | Observed | % Deviation | ||
| All genes | 1,793 | 9,321 | |||
| Adult brain | 24 | 27.1 | 93 | −5.2 | 0.1977 |
| Accessory gland | 5 | −77.9 | 135 | 15.0 | 0.0001 |
| Adult crop | 2 | −50.4 | 23 | 9.7 | 0.2689 |
| Adult eye | 11 | −28.2 | 84 | 5.4 | 0.2276 |
| Adult fatbody | 1 | −22.5 | 7 | 4.3 | 0.7800 |
| Adult hindgut | 3 | −31.1 | 24 | 6.0 | 0.4781 |
| Adult heart | 4 | −14.5 | 25 | 2.8 | 0.7319 |
| Adult midgut | 9 | −36.6 | 79 | 7.0 | 0.1320 |
| Adult salivary gland | 0 | −100.0 | 13 | 19.2 | 0.1138 |
| Adult thoracicoabdominal ganglion | 4 | 3.3 | 20 | −0.6 | 0.9433 |
| Ejaculatory duct | 5 | 0.0 | 26 | 0.0 | 0.9995 |
| Female (virgin) spermatheceae | 2 | −38.0 | 18 | 7.3 | 0.4559 |
| Larval CNS | 16 | 60.0 | 46 | −11.5 | 0.0384 |
| Larval hindgut | 4 | −51.4 | 47 | 9.9 | 0.1075 |
| Larval midgut | 13 | −26.7 | 97 | 5.1 | 0.2186 |
| Larval salivary gland | 13 | 34.3 | 47 | −6.6 | 0.2439 |
| Larval trachea | 11 | −31.8 | 89 | 6.1 | 0.1629 |
| Larval malpighian tubules | 5 | −49.2 | 56 | 9.5 | 0.0920 |
| Ovary | 37 | 104.8 | 75 | −20.2 | <0.0001 |
| Testis | 221 | −2.7 | 1187 | 0.5 | 0.6559 |
Note.—Values in boldface indicate significant P values at FDR = 0.05.
Table 3.
Chromosomal Distribution of Genes with >2-Fold Bias in Testis
| Comparison Tissue | X Chromosome |
X vs. A | |
|---|---|---|---|
| Observed | % Deviation | P (χ2 Test) | |
| Accessory gland | 128 | −31.1 | <0.0001 |
| Adult brain | 144 | −31.7 | <0.0001 |
| Adult crop | 125 | −30.9 | <0.0001 |
| Adult eye | 126 | −30.9 | <0.0001 |
| Adult fatbody | 141 | −25.9 | 0.0001 |
| Adult heart | 142 | −24.9 | 0.0002 |
| Adult hindgut | 120 | −34.6 | <0.0001 |
| Adult midgut | 138 | −28.3 | <0.0001 |
| Adult salivary gland | 137 | −27.9 | <0.0001 |
| Adult thoracicoabdominal ganglion | 131 | −32.9 | <0.0001 |
| Ejaculatory duct | 129 | −24.8 | 0.0004 |
| Female (virgin) spermatheceae | 153 | −22.7 | 0.0005 |
| Larval CNS | 126 | −33.7 | <0.0001 |
| Larval hindgut | 124 | −29.5 | <0.0001 |
| Larval malpighian tubules | 152 | −22.5 | 0.0006 |
| Larval midgut | 116 | −40.6 | <0.0001 |
| Larval salivary gland | 132 | −24.7 | 0.0004 |
| Larval trachea | 125 | −32.9 | <0.0001 |
| Ovary | 163 | −22.7 | 0.0003 |
| Testis | — | — | — |
Note.—All P values are significant at FDR = 0.05.
Table 4.
Chromosomal Distribution of Genes with >2-Fold Bias in Ovary
| Comparison Tissue | X Chromosome |
X vs. A | |
|---|---|---|---|
| Observed | % Deviation | P (χ2 Test) | |
| Accessory gland | 186 | 6.6 | 0.3443 |
| Adult brain | 215 | 19.8 | 0.0037 |
| Adult crop | 196 | 16.4 | 0.0203 |
| Adult eye | 219 | 15.5 | 0.0196 |
| Adult fatbody | 217 | 20.4 | 0.0028 |
| Adult heart | 240 | 18.9 | 0.0033 |
| Adult hindgut | 209 | 13.8 | 0.0406 |
| Adult midgut | 217 | 5.8 | 0.3621 |
| Adult salivary gland | 221 | 16.6 | 0.0126 |
| Adult thoracicoabdominal ganglion | 226 | 25.6 | 0.0002 |
| Ejaculatory duct | 230 | 19.9 | 0.0026 |
| Female (virgin) spermatheceae | 230 | 22.5 | 0.0008 |
| Larval CNS | 114 | 24.4 | 0.0107 |
| Larval hindgut | 177 | 8.7 | 0.2236 |
| Larval malpighian tubules | 218 | 8.1 | 0.2090 |
| Larval midgut | 216 | 3.9 | 0.5422 |
| Larval salivary gland | 180 | 12.7 | 0.0797 |
| Larval trachea | 162 | 13.9 | 0.0712 |
| Ovary | — | — | — |
| Testis | 392 | 50.1 | <0.0001 |
Note.—Values in boldface indicate significant P values at FDR = 0.05.
Table 5.
Chromosomal Distribution of Genes with >2-Fold Bias in Accessory Gland
| Comparison Tissue | X Chromosome |
X vs. A | |
|---|---|---|---|
| Observed | % Deviation | P (χ2 Test) | |
| Accessory gland | — | — | — |
| Adult brain | 220 | 3.9 | 0.5396 |
| Adult crop | 139 | 7.6 | 0.3477 |
| Adult eye | 173 | 11.9 | 0.1052 |
| Adult fatbody | 154 | 7.6 | 0.3197 |
| Adult heart | 180 | 14.3 | 0.0498 |
| Adult hindgut | 146 | 9.8 | 0.2159 |
| Adult midgut | 184 | 11.3 | 0.1135 |
| Adult salivary gland | 144 | 6.1 | 0.4352 |
| Adult thoracicoabdominal ganglion | 198 | 4.8 | 0.4704 |
| Ejaculatory duct | 137 | 9.2 | 0.2629 |
| Female (virgin) spermatheceae | 183 | 17.9 | 0.0148 |
| Larval CNS | 171 | −2.5 | 0.7190 |
| Larval hindgut | 120 | 6.4 | 0.4571 |
| Larval malpighian tubules | 185 | 9.3 | 0.1857 |
| Larval midgut | 169 | −4.6 | 0.5043 |
| Larval salivary gland | 102 | 0.8 | 0.9267 |
| Larval trachea | 122 | 3.7 | 0.6583 |
| Ovary | 245 | 6.8 | 0.2610 |
| Testis | 416 | 30.6 | <0.0001 |
Note.—Values in boldface indicate significant P values at FDR = 0.05.
Table 6.
Testis-Biased Genes Are Not Underrepresented on the X Chromosome after Transformation by Differences in Median X versus A Expression Levels
| Comparison Tissue | X Chromosome |
X vs. A | |
|---|---|---|---|
| Observed (N = 1,793) | % Deviation | P (χ2 Test) | |
| Accessory gland | 188 | 1.2 | 0.5565 |
| Adult brain | 212 | 0.5 | 0.4642 |
| Adult crop | 184 | 1.7 | 0.6055 |
| Adult eye | 173 | −5.3 | 0.1731 |
| Adult fatbody | 174 | −8.7 | 0.0882 |
| Adult heart | 185 | −2.2 | 0.3836 |
| Adult hindgut | 173 | −5.8 | 0.1316 |
| Adult midgut | 198 | 2.7 | 0.7318 |
| Adult salivary gland | 189 | −0.6 | 0.4572 |
| Adult thoracicoabdominal ganglion | 196 | 0.3 | 0.4533 |
| Ejaculatory duct | 185 | 7.7 | 0.7361 |
| Female (virgin) spermatheceae | 193 | −2.6 | 0.3773 |
| Larval CNS | 195 | 2.5 | 0.6258 |
| Larval hindgut | 185 | 5.0 | 0.9355 |
| Larval malpighian tubules | 211 | 7.5 | 0.6954 |
| Larval midgut | 177 | −9.5 | 0.0306 |
| Larval salivary gland | 181 | 3.1 | 0.8447 |
| Larval trachea | 194 | 4.0 | 0.7782 |
| Ovary | 253 | 19.9 | 0.0458 |
Note.—No P values are significant at FDR = 0.05.
Results
Genes Expressed Primarily in Testes Are Not Underrepresented on the X Chromosome
The distribution of τ—a measure of tissue specificity (Yanai et al. 2005)—in the FlyAtlas microarray data is bimodal (fig. 1): many genes are either broadly expressed or tissue-specific. Compared with other tissues, the testis is exceptional in the extent to which gene expression in these cells is tissue specific: 67% of all genes with τ > 0.95 are strongly testis biased or testis specific, and 15% of all genes expressed in testis have τ values >0.95 (supplementary table S1, Supplementary Material online; see also Fuller 1998; Chintapalli et al. 2007; Mikhaylova and Nurminsky 2011). In contrast, ∼0.5% of genes expressed in other tissues, on average, show τ > 0.95. Tissue specificity is not, however, a general property of germline expression, as ovaries show no enrichment for tissue-specific genes (fig. 1 and supplementary table S1, Supplementary Material online). Instead, gene expression in ovaries is largely characterized by upregulation of broadly expressed genes (Meisel 2011).
Fig. 1.—
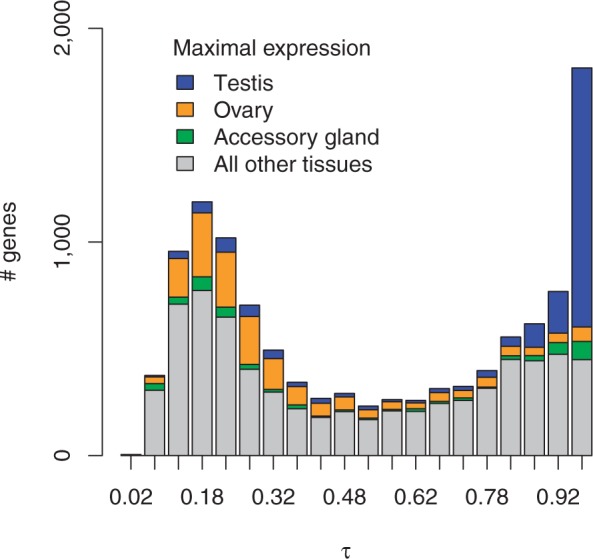
The distribution of τ values, a metric of tissue-specific expression, is distinctly bimodal for 11,186 genes measured across 20 larval and adult structures, organs, and tissues. The lower mode corresponds to broadly expressed genes, and the upper mode to highly biased or tissue-specific genes. The distributions of τ values for genes with maximal expression in testis, ovary, or accessory gland are shown in color. The testis is unusual in the number of genes that are expressed exclusively in these cells, whereas ovaries transcribe broadly expressed genes at high levels.
We compared the chromosomal locations of tissue-specific genes with that expected by chance. Across three arbitrary values of τ chosen as cutoffs to define tissue specificity, testis-specific genes show no significant departure from expected proportions on the X chromosome versus the autosomes (independently observed by Meisel et al. 2012). In contrast, ovary-specific genes are significantly overrepresented on the X at all three τ cutoffs after correcting for multiple tests, whereas accessory gland-specific genes are significantly underrepresented on the X (table 1 and supplementary table S2, Supplementary Material online). Ovary-specific genes show the largest deviation from random expectation, an enrichment of 105% on the X chromosome at τ > 0.9. We conclude that, using τ as an indicator of tissue-specific expression, there is no evidence for a deficit of X-linked testis-specific genes in D. melanogaster. In the germline, the Drosophila X chromosome is, if anything, feminized (Parisi et al. 2003; Meisel et al. 2012).
Young genes—those acquired recently by retroduplication, DNA-based duplication or de novo origination—are distributed throughout the genome differently than long-established old genes (Zhang, Vibranovski, et al. 2010). In particular, old male-biased genes are underrepresented on the X chromosome, whereas young male-biased genes are overrepresented on the X chromosome (Zhang, Vibranovski, et al. 2010). We examined the relationship between gene age and expression specific to the male germline. Young genes (defined as <63 Myr old, following Zhang, Vibranovski, et al. [2010]) are both significantly more tissue specific (supplementary fig. 1, Supplementary Material online) and more likely to be testis-specific in expression than old genes (>63 Myr old): 10% of old genes and 39% of young genes are testis specific at a τ cutoff of 0.9 (supplementary table S3, Supplementary Material online). We find that, as with male-biased genes (Zhang, Vibranovski, et al. 2010), young testis-specific genes are significantly overrepresented on the X, whereas old testis-specific genes are significantly underrepresented on the X (supplementary table S4, Supplementary Material online). Together, these complementary deviations balance, such that overall, the number of X-linked testis-specific genes is not different from that expected by chance (table 1).
No Sex Chromosome Dosage Compensation in the Drosophila Testis
There are conflicting reports in the literature concerning the status of X chromosome dosage compensation in the Drosophila male germline. The first claims of X chromosome demasculinization inferred that average expression levels from the X and autosomes are equal in male and female somatic and germline tissues (using whole testis dissections; Parisi et al. 2003; Gupta et al. 2006; Sturgill et al. 2007). It has become clear, however, that X-linked genes have significantly lower expression, on average, than autosomal genes in the Drosophila testis (Meiklejohn et al. 2011). Four independent data sets, using two different microarray platforms as well as RNA-seq, and assaying gene expression from whole testes and subtestis dissections, all show that median gene expression values differ significantly between X-linked and autosomal genes (Mann–Whitney PMW < 0.001), with X-linked genes showing 1.43- to 1.51-fold (0.52–0.59 on a log2 scale) lower median expression (table 2). This X-autosome difference is not attributable to the unusual, highly tissue-specific gene expression profile of testis, as the same ∼1.5-fold X-autosome difference in expression holds for broadly expressed genes (i.e., those with low τ; table 2). A similar magnitude of differential expression between X-linked and autosomal genes is seen in Drosophila male-like somatic cells in culture when the DCC is knocked down by RNAi (Hamada et al. 2005; Zhang, Malone, et al. 2010), in early embryos before the DCC is active (Lott et al. 2011), and between aneuploid autosomal genes that differ by 2-fold in copy number (Stenberg et al. 2009; Zhang, Malone, et al. 2010), consistent with an absence of X chromosome dosage compensation in the Drosophila male germline (Meiklejohn et al. 2011).
Table 2.
Gene Expression Is Buffered with Respect to Gene Copy Number in Drosophila, and X: A Expression Ratios Are Consistent with Haploid Expression in the Male Germline
| Cell Type | Log2 Ploidy Effecta | Data Source |
|---|---|---|
| Wild-type male germline cells | A–X | |
| Whole testes | 0.52 | Gan et al. (2010) |
| Whole testes | 0.59 | Chintapalli et al. (2007) |
| Whole testes | 0.45 | Chen et al. (2011) |
| Testis apical tips | 0.56 | Meiklejohn et al. (2011) |
| Broadly expressed genes | ||
| Whole testes; τ < 0.50 | 0.67 | Chintapalli et al. (2007) |
| Whole testes; τ < 0.40 | 0.77 | Chintapalli et al. (2007) |
| Whole testes; τ < 0.20 | 0.64 | Chintapalli et al. (2007) |
| Cells lacking dosage compensation | ||
| S2 cells (msl2 RNAi) | 0.51 | Hamada et al. (2005) |
| S2 cells (msl2 or mof RNAi) | 0.43 | Zhang, Malone, et al. (2010) |
| early embryos | 0.54 | Lott et al. (2011) |
| Aneuploid cells | 2-fold copy | |
| Deficiency heterozygotesb | 0.64 | Stenberg et al. (2009) |
| Chromosome 4 monosomyb | 0.52 | Stenberg et al. (2009) |
| S2-cell aneuploidies | 0.58 | Zhang, Malone, et al. (2010) |
aMedian A–X expression; all values are significantly different from 0 (P < 0.001) by Mann–Whitney test.
bRNA extracted from whole adult females.
Expression assays using testes from spermatogenesis mutants has, however, raised the possibility that some form of X chromosome dosage compensation may exist in the small population of undifferentiated mitotic spermatogonial cells at the tip of testis (Meiklejohn et al. 2011; Deng et al. 2011). In bam-mutant testes, spermatogonia proliferate but fail to differentiate into primary spermatocytes (McKearin and Spradling 1990). An initial analysis of bam mutant testes revealed that, instead of a ∼1.5-fold X-autosome difference in gene expression, only a ∼1.13-fold difference exists (Meiklejohn et al. 2011), leading one study to postulate some form of X chromosome dosage compensation in Drosophila spermatogonia (Deng et al. 2011). However, data from an independent study of testis gene expression, using a different bam mutant genotype (Chen et al. 2011), reveals the expected 1.5-fold difference (supplementary table S5, Supplementary Material online). These findings have two important implications. First, X-autosome expression differences in bam mutant testes clearly depend on the particular bam alleles used. Second, while we cannot say definitively which bam genotype most accurately reflects expression in wild-type spermatogonia (and which is aberrant), it seems more parsimonious to infer that a 1.5-fold difference is established in spermatogonia and then subsequently maintained throughout the male germline. We therefore conclude that X chromosome dosage compensation is absent from the vast majority of cells in the testis and, most likely, absent from spermatogonia as well. Further studies using bona fide amorphic alleles of bam or, alternatively, expression assays on perfectly isolated spermatogonial cells, will be required to definitively assay X-linked and autosomal expression in spermatogonia and male germline stem cells in Drosophila. Importantly, whether sex chromosome dosage compensation occurs in the small population of spermatogonial cells has little bearing on the analyses that follow, as it remains clear that most cells in the testes show a ∼1.5-fold X-autosome difference in expression.
Global Expression Differences between the X and Autosomes in the Testes Explain the Deficit of Testes-Biased Genes on the X
Consistent with previous reports (Parisi et al. 2003, 2004; Ranz et al. 2003; Sturgill et al. 2007; Gan et al. 2010), direct pairwise comparison of gene expression levels between testis and all other FlyAtlas samples shows a pattern consistent with X chromosome demasculinization—a paucity of X-linked genes overexpressed ≥2-fold in testes—that is highly significant (χ2 ≥ 11.8, P < 0.001) and consistent in magnitude (22–40%; tables 3–5; see supplementary table S6, Supplementary Material online; for results with 4- and 8-fold testis-biased genes). The fact that X chromosome demasculinization is seen when using a 2-fold cutoff to identify testis-biased genes but not when using τ raises the possibility that this observation reflects differential gene expression rather than differential gene content. To test this possibility, we transformed X-linked log2 expression values for each FlyAtlas tissue by the difference between median X and autosomal expression in that tissue (supplementary table S7, Supplementary Material online), equalizing global X and autosomal expression. Following this transformation, testis-biased genes are no longer underrepresented on the X chromosome (table 6 and supplementary table S8, Supplementary Material online). X chromosome demasculinization in the Drosophila testis thus appears to depend on the small overall difference in median X versus autosome expression level in the testis.
We performed a second test of the hypothesis that global differences in X versus autosomal expression, specifically a lack of germline X chromosome dosage compensation in testes, can account for apparent X chromosome demasculinization. Experimental impairment of the DCC by RNAi against msl2 in male-like S2 cell culture combined with whole-genome expression profiling shows that loss of DCC-mediated dosage compensation results in a global decrease in X chromosome expression (Hamada et al. 2005; Zhang, Malone, et al. 2010). We transformed testis gene expression values by the change in expression measured in S2 cells upon RNAi against msl2 (Hamada et al. 2005). Following this transformation, genes with a 2-fold or greater testis bias are significantly underrepresented (χ2 ≥ 7.56, P < 0.01) on the X in 7 of 20 comparisons versus FlyAtlas tissues (supplementary table S9, Supplementary Material online), and the magnitude of the underrepresentation versus these seven tissues ranges from 18% to 22%. This transformation thus reduces but does not wholly eliminate the X chromosome demasculinization. These results suggest either that the lack of sex chromosome dosage compensation explains a large fraction, but not all, of the demasculinized X; or alternatively, that RNAi knock-down of msl2 in these experiments may not completely abolish MSL-dependent dosage compensation (Hamada et al. 2005).
Simulating a Demasculinized X Chromosome Does Not Recapitulate X Autosome Differences in Expression in the Testes
So far, these analyses show that the lack of sex chromosome dosage compensation in the male germline can account for most, if not all, of the underrepresentation of testis-biased genes on the X chromosome. We next tested the inverse hypothesis: can the difference in median expression between the X and the autosomes be explained by an evolved difference in the density of testis-biased or testes-specific genes? We tested this possibility by simulating a demasculinized X chromosome from the FlyAtlas testis microarray data. We randomly sampled autosomal genes, filtered an arbitrary fraction (20%, 40%, or 60%) of testis-biased genes, and then compared the distributions of log2 expression values from the simulated demasculinized chromosome with that observed for the X chromosome. The range of demasculinization simulated (20–60%) encompasses previously inferred degrees of demasculinization (Parisi et al. 2003; Ranz et al. 2003; Sturgill et al. 2007), as well as those estimated here (table 3). We find that after removing 20%, 40%, or 60% of testis-biased genes (≥2-fold overexpressed in testes relative to ovaries), the distribution of expression levels for the remaining genes shifts (fig. 2), but the median remains significantly greater (PMW < 0.05) than that for X-linked genes in 1,000/1,000 resampled distributions for each reduction in testis-biased gene content (20%, 40%, or 60%). Similar results hold for genes with a ≥4-fold or ≥8-fold testis bias (data not shown). These analyses show that this method of demasculinizing the autosomes does not produce a gene expression profile like that of the X chromosome in the testes.
Drosophila Accessory Gland and Anopheles Testis Show X Chromosome Demasculinization
Somatic tissues in Drosophila have been reported to show a deficit of X-linked male-biased genes (Parisi et al. 2003; Sturgill et al. 2007; Bachtrog et al. 2010), and accessory gland proteins in particular are underrepresented on the X chromosome (table 1; Wolfner et al. 1997; Swanson et al. 2001). However, unlike the testis, the accessory gland shows a clear deficit of X-linked genes that cannot be explained by globally reduced expression of the X (tables 1 and 5, supplementary table S7, Supplementary Material online). This observation indicates that both X chromosome regulation and gene content differ between male-specific germline and somatic cells in Drosophila, as in the testis the X chromosome is neither dosage compensated nor demasculinized for gene content, whereas in the accessory gland the X is both dosage compensated and demasculinized.
As a complementary comparison, we performed a phylogenetically independent test of X chromosome demasculinization in the mosquito, A. gambiae, a species that diverged from D. melanogaster >250 Ma (Gaunt and Miles 2002) and that has an independently evolved heteromorphic XY sex chromosome system (Toups and Hahn 2010). By analyzing recently published gene expression data from adult A. gambiae tissues, including testis, ovaries, and male accessory glands (Baker et al. 2011), we confirm that—in contrast to Drosophila—a strong and significant underrepresentation (76–88% below expectation, P < 0.0001) of testis-specific genes exists on the Anopheles X chromosome (Baker et al. 2011). This pattern is restricted to testis-specific genes, as the Anopheles X shows a significant overrepresentation of tissue-specific genes expressed in accessory gland, male and female heads, female salivary gland, and female malpighian tubules, suggesting that tissue-specific genes may be generally enriched on the Anopheles X chromosome (supplementary table S10, Supplementary Material online).
In Anopheles testes, median X chromosome expression is 1.78-fold lower than median autosomal expression (PMW < 0.0001; supplementary table S11, Supplementary Material online), suggesting that, as in Drosophila, the X chromosome is not dosage compensated in the male germline (Baker and Russell 2011). As in Drosophila, we observe a significant deficit of X-linked genes with ≥2-fold testis-bias in Anopheles (supplementary table S12, Supplementary Material online). However, unlike Drosophila, we observe a significant deficit of testis-biased genes on the Anopheles X even after normalization for median X versus autosomal expression levels (supplementary table S13, Supplementary Material online). Anopheles X chromosome demasculinization therefore does not depend on differences in X versus autosomal expression in the male germline. These analyses from other tissues and species show that demasculinization can occur when the X and autosomes have equal expression levels (e.g., Drosophila accessory gland) or disparate expression levels (e.g., Anopheles testis).
Discussion
Three kinds of analysis fail to support the notion that gene content on the Drosophila X chromosome is demasculinized in the testis. First, when testis-specific genes are identified in D. melanogaster via microarray analysis of 20 different larval and adult structures (Chintapalli et al. 2007), as opposed to via pairwise comparison of testes versus ovaries or whole males versus whole females, there is no evidence for a demasculinized X chromosome (table 1; Meisel et al. 2012). Second, normalizing for the global difference in X-autosome expression in the testis largely eliminates its seemingly demasculinized expression profile (table 6 and supplementary table S8, Supplementary Material online). Third, simulating demasculinization on the autosomes by simply removing testis-biased genes fails to produce a gene expression profile similar to that observed for the X chromosome in the testis (fig. 2). We therefore conclude that the apparent demasculinization of the Drosophila X chromosome—at least for genes expressed in testis, which account for the vast majority of sex-biased genes assayed in whole flies (Parisi et al. 2003, 2004; Ranz et al. 2003; Sturgill et al. 2007)—is largely explained by the overall reduced expression from the X chromosome.
We further conclude that the globally reduced expression from the X relative to the autosomes in the testis is most simply explained by an absence of sex chromosome dosage compensation in the male germline. If this conclusion is correct, once the simple ploidy difference between the X and the autosomes is accounted for, the statistical underrepresentation of testis-biased genes on the X chromosome disappears. In contrast, other male-specific tissues appear to show robust evidence for demasculinized gene content regardless of whether they are dosage compensated (Drosophila accessory gland and Anopheles testis, respectively). The Anopheles–Drosophila comparison shows, further, that the genomic distributions of genes with sex- and tissue-specific expression can evolve to be lineage specific.
These results bear on our understanding of sex chromosome evolution and gene expression in Drosophila. Sex chromosome dosage compensation in Drosophila involves large-scale chromatin remodeling of the X chromosome (Gelbart and Kuroda 2009), and this has been hypothesized to impose constraints on the evolution of X-linked gene expression (Vicoso and Charlesworth 2009; Bachtrog et al. 2010; Mikhaylova and Nurminsky 2011). Our results suggest a reinterpretation of some of these consequences of sex chromosome dosage compensation. First, a recent study (Mikhaylova and Nurminsky 2011) suggested that all tissue-specific genes—not just testis-specific ones—are underrepresented on the X chromosome because sex chromosome dosage compensation interferes with tissue-specific regulation of X-linked genes. Using τ cutoffs of 0.85, 0.90, and 0.95, we find that only the accessory gland shows a significant deficit of tissue-specific genes on the X (table 1 and supplementary table S2, Supplementary Material online). Pooling across all tissues, we find no significant difference in the proportion of tissue-specific genes on the X and the autosomes (χ2 ≤ 1.99, P > 0.158), although we do find a significant excess of broadly expressed X-linked genes (τ < 0.4, χ2 = 5.26, P = 0.022), which is consistent with the hypothesis that dosage compensation interferes with repression of tissue-specific genes in the wrong cell types (Mikhaylova and Nurminsky 2011).
Second, two comparisons of previously published data on sex-biased gene expression and DCC binding in cell culture concluded that dosage compensation may specifically limit the evolution of male-biased gene expression (Vicoso and Charlesworth 2009; Bachtrog et al. 2010). Both studies relied on previous reports that sex chromosome dosage compensation exists in the testes (Parisi et al. 2003; Gupta et al. 2006; Sturgill et al. 2007). Vicoso and Charlesworth (2009) found that male-biased genes with higher absolute expression are more strongly depleted from the X than lowly expressed male-biased genes. We suggest that the negative relationship between absolute expression of male-biased genes and X-linkage is more simply explained by the absence of dosage compensation in the testes. Bachtrog et al. (2010) found that both germline and somatic male-biased genes are located significantly farther from sequence motifs that recruit the DCC to the X chromosome and less likely to be bound by the DCC than either unbiased or female-biased genes. The underlying causes of this pattern may differ between the testes and the soma. In the testes, there may be no selection to maintain DCC recruitment motifs near genes expressed primarily in spermatocytes, as DCC-mediated dosage compensation is absent in the male germline (Rastelli and Kuroda 1998). In the soma, if this pattern is largely due to the accessory gland—which shows both X chromosome dosage compensation and demasculinization—then constraint resulting from DCC function would seem a viable hypothesis. However, it is also possible that both germline and somatic male-biased genes are not bound by the DCC in cell culture simply because they are not expressed in the particular cells in culture, as the DCC, once it has localized to the X chromosome, largely binds to expressed genes (Alekseyenko et al. 2006).
Finally, two other observations that raise doubts about the rationale for the evolutionary demasculinization of the X chromosome are made more explicable in light of the present results. One is that a curious and unexplained discrepancy has existed between the distributions of genes with testis-biased or testis-specific expression, which supposedly avoid the X, and genes that are essential for male fertility, which are uniformly distributed throughout the genome and do not avoid the X (Lindsley and Lifschytz 1972). The present results suggest that there is no discrepancy—testis-biased, testis-specific, and male-fertility essential genes are all uniformly distributed. The other is that multiple patterns of gene movement and origination are difficult to reconcile with X chromosome demasculinization. Recent studies of interchromosomal retroduplication in Drosophila have confirmed the previously established X→autosome formation bias but show that when the parent copies are lost, both parent genes and retroduplicates tend to be female biased (Metta and Schlotterer 2010). When parent copies are retained, retroduplicates tend to be testis biased regardless of the direction of movement (i.e., autosome→X and autosome→autosome; (Meisel et al. 2009). Thus, sexual antagonism may not be necessary to explain the X→autosome bias in retrogene formation, and it is unclear what role, if any, biased gene movement has in shaping X chromosome gene content. The lack of detectable MSCI in Drosophila (Meiklejohn et al. 2011; Mikhaylova and Nurminsky 2011) indicates that it is unlikely to provide the selective force behind biased gene movement in this genus. Furthermore, the excess of X linkage and testis expression observed among young, recently evolved genes (Zhang, Vibranovski, et al. 2010; supplementary tables S3 and S4, Supplementary Material online), particularly those that form de novo from previously noncoding sequences (Levine et al. 2006), seems difficult to reconcile with the notion that the X chromosome is an unfavorable location for genes that function primarily in the male germline.
Taken together, our results imply that, at least in Drosophila, models based on MSCI and sexual antagonism are not necessary to explain the X-autosome difference in the density of genes with testis-biased expression. Indeed, the best evidence for the sex-specific adaptation of the sex chromosomes in Drosophila comes from the concentration of male fertility-essential genes on the Y chromosome (Brosseau 1960; Kennison 1981), which resides in males exclusively, and from the enrichment of ovary-specific genes on the X chromosome (table 1 and supplementary table S2, Supplementary Material online; see also Parisi et al. 2003; Sturgill et al. 2007; Meisel et al. 2012), which resides in females two-thirds of the time.
Supplementary Material
Supplementary figure S1 and tables S1–S13 are available at Genome Biology and Evolution online (http://www.gbe.oxfordjournals.org/).
Acknowledgments
The authors thank Sarah Kingan, Amanda Larracuente, Rich Meisel, Matt Hahn, and three anonymous reviewers for discussions and comments that improved the manuscript. This work was supported by the National Science Foundation grant DEB-0839348 to C.D.M. and by the National Institutes of Health grant GM79543, the Alfred P. Sloan Foundation, the David and Lucille Packard Foundation, and the University of Rochester to D.C.P.
Literature Cited
- Alekseyenko AA, Larschan E, Lai WR, Park PJ, Kuroda MI. High-resolution ChIP-chip analysis reveals that the Drosophila MSL complex selectively identifies active genes on the male X chromosome. Genes Dev. 2006;20:848–857. doi: 10.1101/gad.1400206. [DOI] [PMC free article] [PubMed] [Google Scholar]
- Bachtrog D, Toda NRT, Lockton S. Dosage compensation and demasculinization of X chromosome in Drosophila. Curr Biol. 2010;20:1476–1481. doi: 10.1016/j.cub.2010.06.076. [DOI] [PMC free article] [PubMed] [Google Scholar]
- Baker DA, et al. A comprehensive gene expression atlas of sex- and tissue-specificity in the malaria vector, Anopheles gambiae. BMC Genomics. 2011;12:296. doi: 10.1186/1471-2164-12-296. [DOI] [PMC free article] [PubMed] [Google Scholar]
- Baker DA, Russell S. Role of testis-specific gene expression in sex-chromosome evolution of Anopheles gambiae. Genetics. 2011;189:1117–1120. doi: 10.1534/genetics.111.133157. [DOI] [PMC free article] [PubMed] [Google Scholar]
- Betran E, Thornton K, Long M. Retroposed new genes out of the X in Drosophila. Genome Res. 2002;12:1854–1859. doi: 10.1101/gr.604902. [DOI] [PMC free article] [PubMed] [Google Scholar]
- Brosseau GE. Genetic analysis of the male fertility factors on the Y chromosome of Drosophila melanogaster. Genetics. 1960;45:257–274. doi: 10.1093/genetics/45.3.257. [DOI] [PMC free article] [PubMed] [Google Scholar]
- Chen X, Lu C, Prado JR, Eun SH, Fuller MT. Sequential changes at differentiation gene promoters as they become active in a stem cell lineage. Development. 2011;138:2441–2450. doi: 10.1242/dev.056572. [DOI] [PMC free article] [PubMed] [Google Scholar]
- Chintapalli VR, Wang J, Dow JA. Using FlyAtlas to identify better Drosophila melanogaster models of human disease. Nat Genet. 2007;39:715–720. doi: 10.1038/ng2049. [DOI] [PubMed] [Google Scholar]
- Deng X, et al. Evidence for compensatory upregulation of expressed X-linked genes in mammals, Caenorhabditis elegans and Drosophila melanogaster. Nat Genet. 2011;43:1179–1185. doi: 10.1038/ng.948. [DOI] [PMC free article] [PubMed] [Google Scholar]
- Fuller MT. Genetic control of cell proliferation and differentiation in Drosophila spermatogenesis. Semin Cell Dev Biol. 1998;9:433–444. doi: 10.1006/scdb.1998.0227. [DOI] [PubMed] [Google Scholar]
- Gan Q, et al. Dynamic regulation of alternative splicing and chromatin structure in Drosophila gonads revealed by RNA-seq. Cell Res. 2010;20:763–783. doi: 10.1038/cr.2010.64. [DOI] [PMC free article] [PubMed] [Google Scholar]
- Gaunt MW, Miles MA. An insect molecular clock dates the origin of the insects and accords with palaeontological and biogeographic landmarks. Mol Biol Evol. 2002;19:748–761. doi: 10.1093/oxfordjournals.molbev.a004133. [DOI] [PubMed] [Google Scholar]
- Gelbart ME, Kuroda MI. Drosophila dosage compensation: a complex voyage to the X chromosome. Development. 2009;136:1399–1410. doi: 10.1242/dev.029645. [DOI] [PMC free article] [PubMed] [Google Scholar]
- Gnad F, Parsch J. Sebida: a database for the functional and evolutionary analysis of genes with sex-biased expression. Bioinformatics. 2006;22:2577–2579. doi: 10.1093/bioinformatics/btl422. [DOI] [PubMed] [Google Scholar]
- Gupta V, et al. Global analysis of X-chromosome dosage compensation. J Biol. 2006;5:3. doi: 10.1186/jbiol30. [DOI] [PMC free article] [PubMed] [Google Scholar]
- Hamada FN, Park PJ, Gordadze PR, Kuroda MI. Global regulation of X chromosomal genes by the MSL complex in Drosophila melanogaster. Genes Dev. 2005;19:2289–2294. doi: 10.1101/gad.1343705. [DOI] [PMC free article] [PubMed] [Google Scholar]
- Kennison JA. The genetic and cytological organization of the Y chromosome of Drosophila melanogaster. Genetics. 1981;98:529–548. doi: 10.1093/genetics/98.3.529. [DOI] [PMC free article] [PubMed] [Google Scholar]
- Levine MT, Jones CD, Kern AD, Lindfors HA, Begun DJ. Novel genes derived from noncoding DNA in Drosophila melanogaster are frequently X-linked and exhibit testis-biased expression. Proc Natl Acad Sci U S A. 2006;103:9935–9939. doi: 10.1073/pnas.0509809103. [DOI] [PMC free article] [PubMed] [Google Scholar]
- Lifschytz E, Lindsley DL. The role of the X-chromosome inactivation during spermatogenesis. Proc Natl Acad Sci. 1972;69:182–186. doi: 10.1073/pnas.69.1.182. [DOI] [PMC free article] [PubMed] [Google Scholar]
- Lindsley DL, Lifschytz E. The genetic control of spermatogenesis in Drosophila. In: Beatty RA, Gluecksohn-Waelsh S, editors. Proceedings of the International Symposium on the Genetics of the Spermatozoon. Copenhagen: Bogtrykkeriet Forum; 1972. pp. 203–222. [Google Scholar]
- Lott SE, et al. Noncanonical compensation of zygotic X transcription in early Drosophila melanogaster development revealed through single-embryo RNA-seq. PLoS Biol. 2011;9:e1000590. doi: 10.1371/journal.pbio.1000590. [DOI] [PMC free article] [PubMed] [Google Scholar]
- McKearin DM, Spradling AC. Bag-of-marbles: a Drosophila gene required to initiate both male and female gametogenesis. Genes Dev. 1990;4:2242–2251. doi: 10.1101/gad.4.12b.2242. [DOI] [PubMed] [Google Scholar]
- Meiklejohn CD, Landeen EL, Cook JM, Kingan SB, Presgraves DC. Sex chromosome-specific regulation in the Drosophila male germline but little evidence for chromosomal dosage compensation or meiotic inactivation. PLoS Biol. 2011;9:e1001126. doi: 10.1371/journal.pbio.1001126. [DOI] [PMC free article] [PubMed] [Google Scholar]
- Meisel RP. Towards a more nuanced understanding of the relationship between sex-biased gene expression and rates of protein-coding sequence evolution. Mol Biol Evol. 2011;28:1893–1900. doi: 10.1093/molbev/msr010. [DOI] [PMC free article] [PubMed] [Google Scholar]
- Meisel RP, Han MV, Hahn MW. A complex suite of forces drives gene traffic from Drosophila X chromosomes. Genome Biol Evol. 2009;1:176–188. doi: 10.1093/gbe/evp018. [DOI] [PMC free article] [PubMed] [Google Scholar]
- Meisel RP, Malone JH, Clark AG. Disentangling the relationship between sex-biased gene expression and X-linkage. Genome Res. 2012;22:1255–1265. doi: 10.1101/gr.132100.111. [DOI] [PMC free article] [PubMed] [Google Scholar]
- Metta M, Schlotterer C. Non-random genomic integration—an intrinsic property of retrogenes in Drosophila? BMC Evol Biol. 2010;10:114. doi: 10.1186/1471-2148-10-114. [DOI] [PMC free article] [PubMed] [Google Scholar]
- Mikhaylova LM, Nurminsky DI. Lack of global meiotic sex chromosome inactivation, and paucity of tissue-specific gene expression on the Drosophila X chromosome. BMC Biol. 2011;9:29. doi: 10.1186/1741-7007-9-29. [DOI] [PMC free article] [PubMed] [Google Scholar]
- Namekawa SH, Lee JT. XY and ZW: is meiotic sex chromosome inactivation the rule in evolution? PLoS Genet. 2009;5:e1000493. doi: 10.1371/journal.pgen.1000493. [DOI] [PMC free article] [PubMed] [Google Scholar]
- Parisi M, et al. A survey of ovary-, testis-, and soma-biased gene expression in Drosophila melanogaster adults. Genome Biol. 2004;5:R40. doi: 10.1186/gb-2004-5-6-r40. [DOI] [PMC free article] [PubMed] [Google Scholar]
- Parisi M, et al. Paucity of genes on the Drosophila X chromosome showing male-biased expression. Science. 2003;299:697–700. doi: 10.1126/science.1079190. [DOI] [PMC free article] [PubMed] [Google Scholar]
- Ranz JM, Castillo-Davis CI, Meiklejohn CD, Hartl DL. Sex-dependent gene expression and evolution of the Drosophila transcriptome. Science. 2003;300:1745–1747. doi: 10.1126/science.1085881. [DOI] [PubMed] [Google Scholar]
- Rastelli L, Kuroda MI. An analysis of maleless and histone H4 acetylation in Drosophila melanogaster spermatogenesis. Mech Dev. 1998;71:107–117. doi: 10.1016/s0925-4773(98)00009-4. [DOI] [PubMed] [Google Scholar]
- Rice W. Sex chromosomes and the evolution of sexual dimorphism. Evolution. 1984;38:735–742. doi: 10.1111/j.1558-5646.1984.tb00346.x. [DOI] [PubMed] [Google Scholar]
- R Development Core Team. R: A language and environment for statistical computing. 2011 [Internet] Vienna: R Foundation for Statistical Computing [cited 2012 Sep. 26]. Available from: http://www.R-project.org/ [Google Scholar]
- Stenberg P, et al. Buffering segmental and chromosomal aneuploidies in Drosophila melanogaster. PLoS Genet. 2009;5:e1000465. doi: 10.1371/journal.pgen.1000465. [DOI] [PMC free article] [PubMed] [Google Scholar]
- Sturgill D, Zhang Y, Parisi M, Oliver B. Demasculinization of X chromosomes in the Drosophila genus. Nature. 2007;450:238–241. doi: 10.1038/nature06330. [DOI] [PMC free article] [PubMed] [Google Scholar]
- Swanson WJ, et al. Evolutionary EST analysis identifies rapidly evolving male reproductive proteins in Drosophila. Proc Natl Acad Sci U S A. 2001;98:7375–7379. doi: 10.1073/pnas.131568198. [DOI] [PMC free article] [PubMed] [Google Scholar]
- Toups MA, Hahn MW. Retrogenes reveal the direction of sex-chromosome evolution in mosquitoes. Genetics. 2010;186:763–766. doi: 10.1534/genetics.110.118794. [DOI] [PMC free article] [PubMed] [Google Scholar]
- Turner JMA. Meiotic sex chromosome inactivation. Development. 2007;134:1823–1831. doi: 10.1242/dev.000018. [DOI] [PubMed] [Google Scholar]
- Vibranovski MD, Lopes HF, Karr TL, Long M. Stage-specific expression profiling of Drosophila spermatogenesis suggests that meiotic sex chromosome inactivation drives genomic relocation of testis-expressed genes. PLoS Genet. 2009;5:e1000731. doi: 10.1371/journal.pgen.1000731. [DOI] [PMC free article] [PubMed] [Google Scholar]
- Vicoso B, Charlesworth B. The deficit of male-biased genes on the D melanogaster X chromosome is expression-dependent: a consequence of dosage compensation? J Mol Evol. 2009;68:576–583. doi: 10.1007/s00239-009-9235-4. [DOI] [PubMed] [Google Scholar]
- Wolfner MF, et al. New genes for male accessory gland proteins in Drosophila melanogaster. Insect Biochem Mol Biol. 1997;27:825–834. doi: 10.1016/s0965-1748(97)00056-8. [DOI] [PubMed] [Google Scholar]
- Wu C-I, Xu EY. Sexual antagonism and X inactivation—the SAXI hypothesis. Trends Genet. 2003;19:243–247. doi: 10.1016/s0168-9525(03)00058-1. [DOI] [PubMed] [Google Scholar]
- Yanai I, et al. Genome-wide midrange transcription profiles reveal expression level relationships in human tissue specification. Bioinformatics. 2005;21:650–659. doi: 10.1093/bioinformatics/bti042. [DOI] [PubMed] [Google Scholar]
- Zhang Y, Malone JH, et al. Expression in aneuploid Drosophila S2 Cells. PloS Biol. 2010;8:e1000320. doi: 10.1371/journal.pbio.1000320. [DOI] [PMC free article] [PubMed] [Google Scholar]
- Zhang YE, Vibranovski MD, Krinsky BH, Long M. Age-dependent chromosomal distribution of male-biased genes in Drosophila. Genome Res. 2010;20:1526–1533. doi: 10.1101/gr.107334.110. [DOI] [PMC free article] [PubMed] [Google Scholar]