

Abstract
Myelination is a complex process requiring coordination of directional motility and an increase in glial cell size to generate a multilamellar myelin sheath. Regulation of actin dynamics during myelination is poorly understood. However, it is known that myelin thickness is related to the abundance of neuregulin-1 (NRG1) expressed on the axon surface. Here we identify cofilin1, an actin depolymerizing and severing protein, as a downstream target of NRG1 signaling in rat Schwann cells (SCs). In isolated SCs, NRG1 promotes dephosphorylation of cofilin1 and its upstream regulators, LIM kinase (LIMK) and Slingshot-1 phosphatase (SSH1), leading to cofilin1 activation and recruitment to the leading edge of the plasma membrane. These changes are associated with rapid membrane expansion yielding a 35–50% increase in SC size within 30 min. Cofilin1-deficient SCs increase phosphorylation of ErbB2, ERK, focal adhesion kinase, and paxillin in response to NRG1, but fail to increase in size possibly due to stabilization of unusually long focal adhesions. Cofilin1-deficient SCs cocultured with sensory neurons do not myelinate. Ultrastructural analysis reveals that they unsuccessfully segregate or engage axons and form only patchy basal lamina. After 48 h of coculturing with neurons, cofilin1-deficient SCs do not align or elongate on axons and often form adhesions with the underlying substrate. This study identifies cofilin1 and its upstream regulators, LIMK and SSH1, as end targets of a NRG1 signaling pathway and demonstrates that cofilin1 is necessary for dynamic changes in the cytoskeleton needed for axon engagement and myelination by SCs.
Introduction
Myelination is a highly specialized form of cell motility in which protrusive expansion of the leading edge of the inner mesaxon, accompanied by high rates of membrane synthesis, drives the glial membrane repeatedly around the axon to generate the myelin sheath. The hypothesis that movement of the leading edges in cell motility and myelination involve similar mechanisms is supported by experiments from the author showing a requirement for actin polymerization in myelination (Fernandez-Valle et al., 1997). This idea is supported by the essential role of Rho GTPases, molecular switches that regulate actin dynamics during cell motility, in myelination (Hall, 2005; Nodari et al., 2007).
A plethora of signaling pathways controlling actin polymerization have been identified in motile processes ranging from chemotaxis to growth cone path finding (von Philipsborn and Bastmeyer, 2007). However, the pathways linking axon contact to expansion of the Schwann cell (SC) or oligodendrocyte leading edge have not been elucidated. Key molecules directly regulating actin dynamics and organization include cofilin and actin-depolymerizing factor (ADF), also known as destrin (Oser and Condeelis, 2009). These proteins sever and depolymerize actin filaments to generate new barbed ends to initiate actin polymerization. Although the activities of cofilin and ADF are similar and the proteins are often coexpressed in cells, they have significant functional and regulatory differences (Bernstein and Bamburg, 2010).
Cofilin1, the major form expressed in nonmuscle cells, is regulated in several ways; the best characterized is phosphorylation on serine 3 (pS3-cofilin1) that inhibits its F-actin activity (Huang et al., 2006). LIM kinases (LIMKs) 1 and 2, and the related testis kinase phosphorylate cofilin1 S3. LIMKs are serine/threonine kinases containing two LIM (Lin-11, Isl-1, and Mec3) domains and a PDZ domain. They are activated by phosphorylation on T505/508 by p21-activated kinase (PAK1 and 4) downstream of Cdc42 and Rac (Edwards et al., 1999; Dan et al., 2001), and by Rho-dependent kinase (ROCK) (Ohashi et al., 2000). Cofilin1 activity is also inhibited by binding phosphatidylinositol 4,5-bisphosphate (PIP2) at the plasma membrane (Yonezawa et al., 1990) and the scaffold protein 14-3-3 (Gohla and Bokoch, 2002). Stimulation of cofilin1 activity by dephosphorylation of serine 3 is conducted by Slingshot1 (SSH1) (Niwa et al., 2002) and chronophin phosphatases (Gohla et al., 2005). Previous studies revealed a role for pS3-cofilin1 in phospholipid signaling (Han et al., 2007; Bernstein and Bamburg, 2010). Therefore, both the phosphorylated and dephosphorylated forms of cofilin1 have potential functional activities in SCs.
A key molecule controlling myelination is neuregulin-1 (NRG1)-type III. Myelin thickness is influenced by the amount of NRG1-type III expressed on the axon's surface (Michailov et al., 2004; Taveggia et al., 2005). This membrane-anchored NRG1 isoform activates ErbB3/ErbB2 receptors that likely regulate SC motility around the axon, in addition to SC precursor survival and proliferation (Birchmeier and Nave, 2008).
Here we report that cofilin1 is activated downstream of NRG1 signaling. Isolated cofilin1-deficient SCs activate NRG1 and laminin (LAM) signaling pathways, proliferate normally, assume a bipolar phenotype, and form focal adhesions. However, when cocultured with sensory neurons, cofilin1-deficient SCs fail to effectively engage or align on axons, assemble a typical basal lamina, or produce myelin.
Materials and Methods
Materials.
Mission shRNAi lentiviral transduction particles targeting mouse cofilin1, control TurboGFP and nontarget shRNAi transduction particles, and puromycin were purchased from Sigma-Aldrich. 2.5S nerve growth factor (NGF) was purchased from Harlan. AG825 (C19H15N3O3S2) was purchased from Calbiochem (manufactured by EMD) and dissolved in DMSO. Recombinant human NRG1-β1-ECD (neuregulin 1-beta 1 extracelluar domain; referred to as NRG1) was purchased from R & D Systems and dissolved in in PBS with 0.2% BSA (fatty acid free; Sigma-Aldrich) to yield a 100 μg/ml stock solution. Reagents and antibodies for the following proteins were purchased from these sources: mouse neurofilament-H (SMI-31 and SMI-32), vinculin (hVIN-1), destrin (ADF), integrin α1, integrin β 4, collagen type IV (CTIV), and chicken neurofilament-H from Abcam; S100 from Dako; cofilin1 and pS3-cofilin1 from Novus Biologicals; pT505/508-LIMK1/2 and integrin α6 from Cell Signaling Technology; LIMK2 and laminin from Sigma-Aldrich; slingshot-1L and pS978 slingshot-1L from ECM Biosciences; Krox-20/Egr2 and myelin basic protein (MBP) from Covance; ErbB2, pY1248-ErbB2, ERK1, and pT204ERK from Santa Cruz Biotechnology; DAPI, myelin-associated glycoprotein (MAG), pY576 focal adhesion (FA) kinase (FAK), pY118 paxillin, Alexa Fluor-conjugated secondary antibodies, and Alexa Fluor 633-phalloidin from Invitrogen; paxillin, N-cadherin, FAK, and integrin β1 from BD Biosciences; and GAPDH from Millipore. All cell culture reagents were purchased from Invitrogen except for pituitary extract, purchased from Biomedical Technologies, Inc. (bti), and fetal bovine serum (FBS), purchased from Atlanta Biologicals. The LIMK inhibitor BMS-5 (C17H14Cl2F2N4OS) was purchased from Synkinase.
Preparation of primary rat SCs.
Primary rat (Rattus norvegicus) SCs were isolated from sciatic nerves of 1-d-old Sprague Dawley (Charles River Laboratories) pups of both sexes using the Brockes method (Brockes et al., 1979) with modifications described previously (Thaxton et al., 2011). Purified rat SCs were routinely cultured at 37°C and 5% CO2 on 200 μg/ml poly-l-lysine (PLL)-coated (Sigma-Aldrich) dishes (Corning) in D10M [DMEM supplemented with 10% heat-inactivated FBS (HIFBS), 15 μm forskolin (Sigma-Aldrich), 20 μg/ml bovine pituitary extract, and penicillin/streptomycin (P/S; Invitrogen)].
Generation of cofilin1-deficient Schwann cell lines.
Freshly harvested and purified rat SCs were plated onto PLL-coated (200 μg/ml) six-well dishes, cultured in D10M, and maintained at 37°C and 5% CO2. When the cultures reached 70–80% confluency, lentiviral transduction particles expressing various cofilin1 shRNAi were added at various multiplicities of infection (MOIs) ranging from 0.5 to 10 in D10M plus 8 μg/ml hexadimethrine bromide (Sigma-Aldrich). After 18–20 h, the infection medium was replaced with fresh D10M for 24 h. D10M was then replaced with D10M containing 1 μg/ml puromycin (Sigma-Aldrich) for the selection of transduced cells. SCs were maintained in D10M plus puromycin and passaged (1:3 split) to expand the populations. During expansion, the cofilin1 expression level was assessed by extracting SCs directly in SDS-PAGE sample buffer and conducting Western blot analysis. ShRNAi target 94 was found to be the most efficient in reducing cofilin1 levels and was used to generate several independently derived SC lines (SC-94). SCs expressing scrambled (SCR) shRNAi did not consistently grow well. Therefore, SCs expressing shRNAi target 97 (SC-97) were used in most experiments to control for the effects of lentiviral transduction, puromycin selection, and passage number. SC-97 cells remained functional as long as cofilin1 expression dropped by no more than 30% of normal levels and cells were passaged no more than 10 times. The presence of puromycin in the culture medium had the added benefit of eliminating fibroblasts. Independent SC lines were created on seven different occasions with different batches of lentiviral transduction particles. The degree of cofilin1 knockdown and cell function obtained with each target shRNAi was similar each time.
Preparation of dissociated rat DRG neuron/SC cocultures.
Dorsal root ganglia (DRGs) were harvested from Sprague Dawley rat (Charles River Laboratories) embryos at 17 d of gestation [embryonic day 17 (E17)] and were dissociated as described previously (Thaxton et al., 2011). Dissociated DRG neurons (DRGNs) were plated on PLL (200 μg/ml) plus laminin (50 μg/ml; Invitrogen) or PLL plus collagen-coated (3.4 mg/ml, type I; BD Biosciences) 12 mm German glass coverslips (Carolina Biological) in CB5 medium (MEM, 0.4% glucose, 50 ng/ml 2.5S NGF and 5% HIFBS). For myelination assays, dissociated DRGN cultures were seeded with primary rat SCs or cofilin1-deficient SCs at 2 × 10⁵ SCs per coverslip in CB10 medium (CB with 10% HIFBS). Cocultures were then switched to myelin-permissive medium (CB with 15% HIFBS plus 0.05 mg/ml l-ascorbic acid) and were fixed 10–14 d later for ultrastructural analysis, immunostaining, or Sudan black staining.
NRG1 stimulation and Western blot analysis.
Normal [wild-type (WT)] SCs and cofilin1-deficient SC lines were plated on PLL-coated (200 μg/ml) six-well dishes and were grown in D10M to 50–60% confluency (typically 72–96 h after plating). Cultures were starved of serum and mitogens by rinsing twice in warmed HBSS (Invitrogen) and incubating in D0.5 (DMEM plus P/S plus 0.5% HIFBS). Eighteen to 22 h later, duplicate wells were stimulated for the indicated times at 37°C and 5% CO2 with D0.5 plus NRG1 carrier (PBS plus 0.02% BSA; mock medium) or D0.5 plus 10–25 ng/ml NRG1-ECD (NRG medium). For the AG825 inhibitor treatment, starved cultures were preincubated with AG825 (10 μm) in D0.5 for 1 h at 37°C and 5% CO2 and stimulated in the presence of the inhibitor. Following stimulation, wells were washed twice in PBS (Invitrogen) with phosphatase inhibitors (PIC3; Sigma-Aldrich) and were extracted directly in SDS sample buffer (Fermentas). Equal sample volumes were loaded on 4–20% precast (Pierce) or 10% self-cast polyacrylamide gels and transferred to Immobilon-P membranes (Millipore). HRP-conjugated goat secondary antibodies (Jackson ImmunoResearch) and SuperSignal West Pico Chemiluminescent Substrate (Pierce) were used for detection. Western blots were quantified using Carestream Molecular Imaging software (version 5.0). The net intensity of equivalent-sized regions of interest for phosphorylated and total proteins was obtained and normalized to GAPDH. Statistical analysis was performed from four independent experiments with GraphPad Prism 5. Stimulation experiments were analyzed using two-way ANOVA and Bonferroni's multiple comparison test. Stimulation experiments using the AG825 inhibitor were analyzed using one-way ANOVA and Tukey's multiple comparison test. We found that multiple factors influenced the consistency of the amount of phosphorylation changes. These included cell confluency, passage number, length of the starvation period, and activity of NRG1. The activity of the NRG1 was titered before use and stored no longer than 2–3 weeks after reconstitution of the lyophilized compound. The strongest responses were observed with SC cultures at no more than 60% confluency, passaged no more than five times (1:3 splits), and starved for a minimum of 20 h. Nonstimulated WT SCs and cofilin1-deficient lines were seeded on six-well dishes coated with PLL (200 μg/ml) or PLL (200 μg/ml) plus LAM (25 μg/ml) and were grown to 60–70% confluency in D10M. Proteins were extracted in chilled TAN buffer (10 mm Tris-acetate, 1% IGEPAL, and 100 mm NaCl, with a mixture of inhibitors) following two washes in chilled PBS on ice. Three to 5 μg of total protein was loaded on 4–20% precast polyacrylamide gels (Pierce) and transferred to Immobilon-FL membranes (Millipore). Odyssey blocking buffer (LI-COR Biosciences), and secondary IRDye antibodies (LI-COR Biosciences) were used, and membranes were scanned and quantified using LI-COR Odyssey scanner and software.
Immunofluorescence staining of cultures.
WT-SC, SC-94, and SC-97 cultures and DRGN/SC cocultures were immunostained as described previously (Thaxton et al., 2007). After fixation with 4% paraformaldehyde in 0.1 m phosphate buffer, myelinating cocultures were acetone treated at −20°C with sequential exposure to 50%/100%/50% acetone for 5 min each. They were rehydrated in 0.1 m phosphate buffer and blocked for 1 h in block buffer: 0.1 m phosphate buffer plus 10% normal goat serum (Invitrogen). Myelinating cocultures immunostained for extracellular matrix proteins were neither permeabilized nor acetone treated. Following blocking, SC-only and nonmyelinating cocultures were incubated with primary antibody for 1 h, while multilayered myelinating cocultures were incubated overnight at 4°C. Secondary antibodies (goat-Alexa Fluor; Invitrogen) diluted 1:500 in block buffer were applied for 30 min. Cultures were postfixed in 4% paraformaldehyde for 5 min, stained with DAPI and, if applicable, Alexa 633-phalloidin, and were mounted in Fluorogel (Electron Microscopy Sciences). All cultures were analyzed with a Zeiss LSM710 microscope and ZEN 2009 software. Image acquisition was optimized for each antibody in triple- or quadruple-stained cultures, and fluorescence was collected on separate channels. Images were identically acquired and processed for WT-SC, SC-94, and SC-97 cocultures, and are either single planes or maximum intensity projections as indicated in the figure legends. Focal contact/adhesion (n = 14–32 whole cells per condition) and phalloidin mean intensity (sum pixel intensity divided by the number of pixels above background; n = 6–9 fields with 5–12 cells per field) was obtained from three independent experiments and analyzed using one-way ANOVA and Tukey's multiple comparison test with GraphPad Prism 5. Krox-20 quantification was obtained from one experiment analyzed from Z stacks (7–11 slices at a 0.5 μm interval) acquired with a 40× objective. Stacks were analyzed with Volocity 5.5 software to acquire Krox-20 cytoplasmic (sum of pixel intensities above background in a Z series minus the sum of pixel intensities colocalized with DAPI-stained nuclei) and nuclear (sum of pixel intensities colocalized with DAPI-stained nuclei) expression. Five fields were analyzed for both sets of cocultures. Data were analyzed with GraphPad Prism 5, Student's t test.
NRG1 stimulation-cell size assay.
WT SCs were seeded onto PLL-coated (200 μg/ml) 12 mm round coverslips at 5000 SCs per coverslip in D10M. Twenty-four hours later, cultures were starved for 16–18 h and then stimulated as described above for 30 min, fixed, and immunostained. For analysis, 50 individual SCs from three cultures per condition were imaged using a 20× objective. Images were analyzed using Volocity 5.5 software to measure the two-dimensional size of individual cells lacking contacts with neighboring SCs. The area was averaged for both mock- and NRG1-stimulated groups, and NRG-stimulated SC size was normalized to mock SCs. Four independent experiments were performed; p values (unpaired t test) were calculated using GraphPad Prism 5. SC-94 and SC-97 cells were seeded onto PLL- and PLL/laminin-coated 12 mm coverslips, grown for 24 h, starved for 16–18 h, and then stimulated as above for 30 min and immunostained as described above. Phalloidin-Alexa 633 fluorescence was used to calculate cell area from isolated cells (n = 16–40 cells in each condition) in three independent experiments. Statistical analysis was performed using GraphPad Prism 5, one-way ANOVA, and Tukey's multiple comparison test.
Live imaging, cell attachment, and spreading assay.
WT SCs and SC-97 and SC-94 cells were lifted by incubation in 0.05% trypsin, allowed to recover in D10M for 1 h at 37°C and 5% CO2, and seeded onto a MatTek 12-well plate coated with PLL (200 μg/ml) and laminin (25 μg/ml), with a 10 mm glass insert at 5000 cells per insert. They were immediately placed on a Zeiss wide-field microscope with full incubation control. Three to five fields were selected for each cell type, and images were collected with a Hamamatsu ORCA camera every 3 min for 3 h using a10× phase objective and Zeiss AxioVision 4.8.2 software. Volocity 5.5 software was used to quantitate size (number of pixels) of individual cells. Four experiments were analyzed, and the mean number of pixels, SEM (n = 7 for each field), and p values (unpaired t test) were calculated using GraphPad Prism 5.
Sudan black staining.
DRGN/SC cocultures were prepared and analyzed as described by Chen et al. (2000). For analysis, coverslips were photographed with a 20× objective; nine of the most heavily myelinated fields were imaged on 4–16 coverslips of each WT-SC, SC-97, and SC-94 coculture. Myelin segments in each image were manually counted and summed for each coverslip in four independent experiments. The mean, SEM, and p values (unpaired t test) were calculated using GraphPad QuickCalcs Software.
Electron microscopy.
DRGN/SC cocultures were prepared essentially as described by Fernandez-Valle et al. (1997). The glass coverslips were removed by dissolving them in hydrofluoric acid under a fume hood. Areas of cocultures containing neurite fascicles were selected for analysis and were either cross-sectioned or sectioned en face. Three independent cocultures with WT SCs and SC-94 and SC-97 cells prepared with an MOI of 5 were analyzed by electron microscopy.
Schwann cell–axon alignment assays.
DRGNs cultures were seeded with WT SCs and SC-97 and SC-94 cells labeled with CellTracker Green (CTG; Invitrogen). Labeling was performed according to the manufacturer's protocol. For experiments using the LIMK inhibitor (BMS-5), labeled SCs were washed once in CB10 containing 1 μm BMS-5 before seeding in the same medium. After 24 h, the cocultures were immunostained with neurofilament antibody and mounted as usual. For analysis, 10 randomly selected fields spanning the entire culture were imaged with a 20× objective from three cultures per condition. SC morphology was visually assessed for ∼100 SCs in each type of coculture as bipolar, tripolar, or multipolar by counting the number of processes emanating from the SC soma. The results shown for the noninhibitor study is a mean of three experiments, while the BMS-5 study is representative of two experiments. The mean, SEM, and p values (unpaired t test) were calculated using GraphPad Prism 5. For clarity, in Figure 10B, the expression of pS3-cofilin1 is shown only for SCs (pS3-cofilin1 fluorescence that colocalized with neurofilament fluorescence was subtracted after acquisition using ZEN 2009 software). pS3-Cofilin mean fluorescence intensity per cell was quantified using Volocity 5.5 software from 30 fields per condition.
Figure 10.
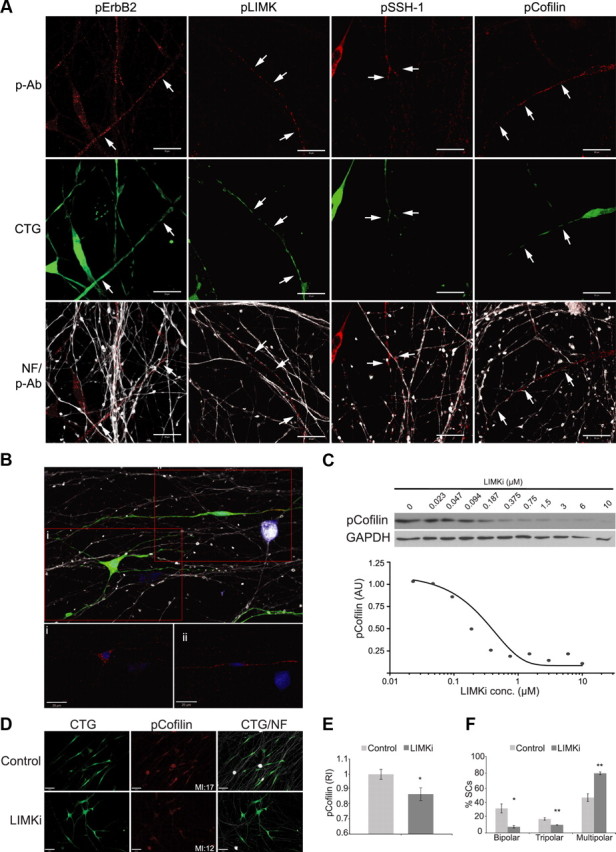
Cofilin S3 phosphorylation is necessary for SC alignment on axons. DRGN cultures were seeded with CTG-labeled WT SCs. Cocultures were fixed 24 h later and immunostained with antibodies to phosphorylated ErbB2, cofilin, LIMK, and SSH1 (all shown in red) and neurofilament (NF; white) to visualize axons. All Images are single planes optimized for each antibody. A, Phosphorylated forms of cofilin, LIMK, and SSH1 are present in the bipolar processes of SCs aligned along axons (arrows indicate protein in axon-aligned SCs). B, A single image of cocultures reveals pS3-cofilin is present in processes of bipolar, aligned WT SCs, but not in those of multipolar SCs (insets i, ii). Only pS3-cofilin expression in the SC is shown. C, BMS-5, a LIMK inhibitor (LIMKi), inhibits cofilin phosphorylation in a dose-dependent manner. WT SCs were incubated for 4 h with serial dilutions of the inhibitor, and total cell extracts were assessed for pS3-cofilin levels and GAPDH as a loading control. The expression level of pS3-cofilin relative to GAPDH expression is plotted as a function of BMS-5 concentration. D, Representative images of a 24 h axon alignment assay conducted with SCs grown in the absence (DMSO control) and presence of 1 μm BMS-5 (LIMKi) and pS3-cofilin (red) is shown. The mean pixel intensity (MI) for pS3-cofilin in the image shown is provided. E, Quantification of pS3-cofilin immunofluorescence for the experiment shows a statistically significant reduction in pS3-cofilin in LIMK inhibitor-treated cultures compared to controls (mean ± SEM; 30 fields per condition). F, Quantification of SC morphology reveals fewer bipolar, aligned WT SCs in cocultures grown in the presence of LIMKi than in controls. A graph of a representative experiment of three is shown with mean ± SEM. *p < 0.05; **p < 0.01. Scale bars: 20 μm.
Inhibitor dose response and Western blot analysis.
WT SCs were seeded on PLL-coated (200 μg/ml) six-well plates and incubated at 37°C and 5% CO2 to 80–90% confluency in D10M. The medium was then replaced with fresh medium with and without serial dilutions of the LIMK inhibitor, BMS-5, and incubated for an additional 4 h. The control condition received only 0.1% of DMSO, the BMS-5 carrier. Western blot analysis was performed as described above and quantified using ImageJ software for three separate experiments. Quantitative analysis was done in Microsoft Excel software.
Results
NRG1 promotes dephosphorylation of cofilin, SSH1, and LIMK2 in SCs
To determine whether NRG1 modulates actin dynamics by regulating cofilin1 (hereafter referred to as cofilin) activity, we stimulated subconfluent starved normal SCs (WT SCs) with NRG1 for 5, 15, 30, and 60 min. WT SCs were also mock stimulated with the NRG1 carrier alone (mock). Equivalent volumes of lysate were analyzed by Western blot for phosphorylated and total levels of ErbB2 and cofilin (Fig. 1A). ErbB2 phosphorylation increased within 5 min of NRG1 stimulation and remained at three times the basal level for at least 1 h. pS3-Cofilin levels decreased by 50% within 5 min of NRG1 stimulation and remained at 30–50% of basal levels throughout the 1 h time course (Fig. 1B). To confirm that cofilin was dephosphorylated in response to ErbB2 activation, WT SCs were stimulated with NRG1 for 30 min in the presence and absence of an ErbB2 kinase inhibitor, AG825 (Osherov et al., 1993) (Fig. 1C,D). AG825 (10 μm) inhibited both the phosphorylation of ErbB2 and the dephosphorylation of pS3-cofilin associated with NRG1 stimulation. NRG1 also promoted dephosphorylation of LIMK2 (T508) and SSH1 (S978) within 30 min of stimulation. Dephosphorylation of each protein was partially inhibited by AG825. The predominant isoform of LIMK detected in SCs was found to be LIMK2, and dephosphorylation of T508 reduced its kinase activity. SSH1 was expressed in SCs, and dephosphorylation of S978 activated its phosphatase activity. Thus, NRG1 promotes rapid dephosphorylation and activation of cofilin's actin depolymerizing and severing activity by regulating the activities of both LIMK2 and SSH1.
Figure 1.

NRG1 promotes dephosphorylation of cofilin, LIMK2, and SSH1 in SCs. A, Subconfluent normal (WT-SC) cultures grown on PLL-coated wells were starved of serum and mitogens overnight by incubation in DMEM containing 0.5% FBS (D0.5). They were stimulated with D0.5 plus NRG1 (NRG) or with fresh D0.5 plus NRG1 carrier (Mock) for the indicated times and were extracted in SDS sample buffer. Equal volumes were used in Western blot analysis with the indicated antibodies recognizing total and phosphorylated epitopes (pS3-cofilin and pY1248-ErbB2) and GAPDH. S100 was used as an SC marker. B, Quantification of the global changes in phosphorylation following NRG1 stimulation is shown. The graph depicts the mean and SEM of the ratio of normalized phosphorylated/total protein in four independent experiments for each time point. C, Subconfluent WT SCs grown on PLL were starved and stimulated as above for 30 min in the presence and absence of (20 μm) AG825, an ErbB2 inhibitor. Western blots were performed with total and phospho-antibodies (pS978-SSH1 and pT505/508-LIMK1/2). D, The mean and SEM of the normalized ratio of phosphorylated to total protein after normalization of each to the Mock condition is shown for four independent experiments. NRG1 promotes ErbB2 phosphorylation and cofilin dephosphorylation with similar time courses. AG825 inhibits ErbB2 phosphorylation and decreases dephosphorylation of cofilin, LIMK, and SSH1. *p < 0.05; **p < 0.01; ***p < 0.001; ****p < 0.0001.
NRG1 promotes SC spreading and recruitment of cofilin to the leading edge
We next analyzed the cellular response of WT SCs to 30 min of NRG1 stimulation. WT SCs were immunostained with antibodies to total cofilin, ErbB2, SSH1, LIMK2, and paxillin, and F-actin was visualized with phalloidin. We observed that NRG1 induced formation of membrane protrusions and cell spreading. We used paxillin immunofluorescence to measure cell size and observed a 35 ± 6% (p < 0.01; n = 4 experiments) increase in the size of NRG1-stimulated SCs compared to mock-stimulated SCs. Cofilin was present at the leading edge of the plasma membrane and membrane protrusions in NRG1-stimulated but not in mock-stimulated SCs (Fig. 2). pS3-Cofilin antibody did not label the plasma membrane of NRG1-stimulated SCs (data not shown), suggesting that plasma membrane-associated cofilin is active. ErbB2 and SSH1 were present at the leading edge of stimulated SCs, whereas LIMK2 was not detected at the leading edge and remained in the cytosol and processes. These results are consistent with the conclusion that NRG1 induces expansion of the SC plasma membrane by promoting cofilin recruitment, dephosphorylation, and activation at the leading edge.
Figure 2.
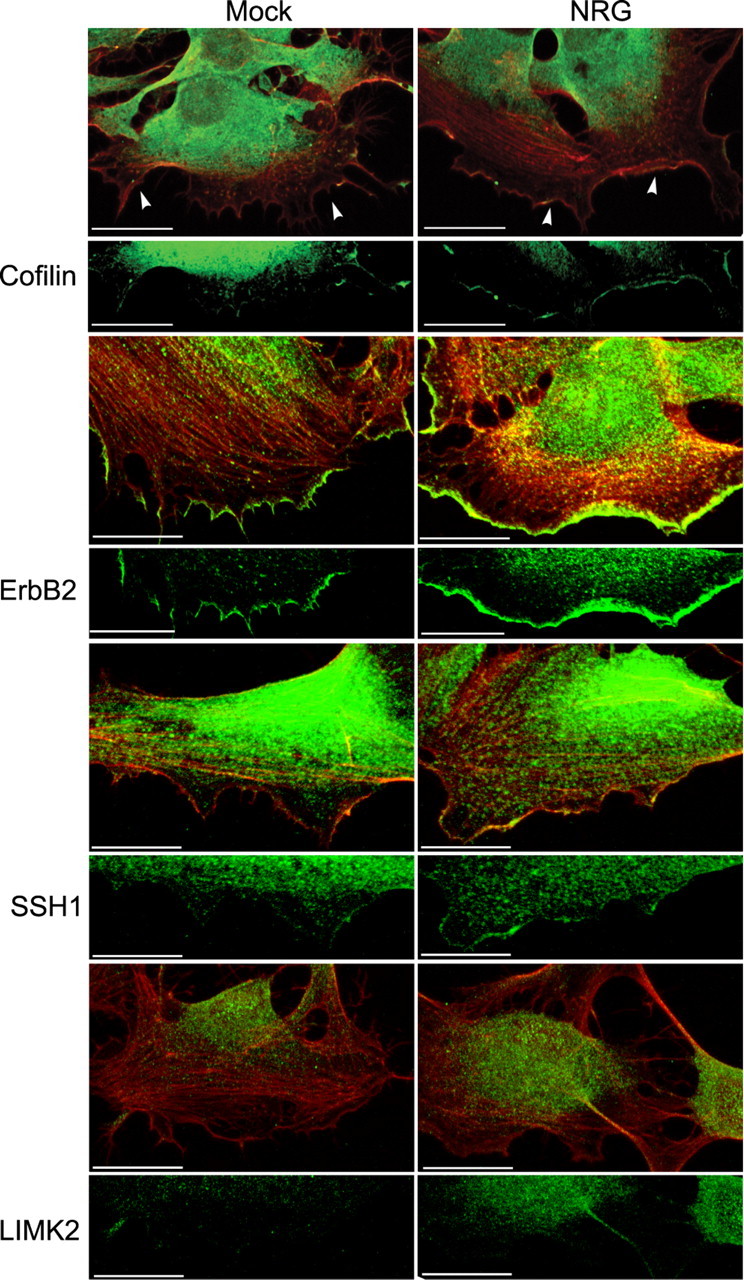
Cofilin is recruited to the leading edge in response to NRG1. Subconfluent SC cultures grown on PLL-coated glass coverslips were starved and stimulated as described in Figure 1 for 30 min. They were immunostained with antibodies to total cofilin, ErbB2, SSH1, and LIMK2 (all shown in green) and with phalloidin (red). In mock-stimulated cells, only ErbB2 was present at the plasma membrane. In NRG1-stimulated cells, cofilin, ErbB2, and SSH1 were present in the cytosol as well as at the leading edge of plasma membrane protrusions. LIMK2 was localized predominantly in the cytosol and in processes in NRG-stimulated cells, and was not observed at the leading edge. All images are maximum intensity projections of six-slice Z stacks using a 0.5 μm interval. Arrowheads indicate the leading edge of the plasma membrane. Scale bars: 20 μm.
Cofilin is essential for SC myelination
To test the role of cofilin during myelination, we created cofilin-deficient SC lines using lentiviral delivery of cofilin shRNAi. Of the five target shRNAi tested, we found that shRNAi 94 reliably reduced cofilin protein levels by 80–90% of normal levels at an MOI of 5 (Fig. 3A–C). Cofilin shRNAi targets 95, 96, 97, and SCR promoted modest reductions in cofilin expression (10 to 30% decrease) at an MOI of 5. ShRNAi targets 94, 97, and SCR were used to generate passage-matched SC lines for analysis. Phalloidin staining and cofilin immunofluorescence revealed an increase in F-actin stress fibers and cell size in freshly plated, PLL-adherent, cofilin-deficient SC-94 cells compared to control SC-97 cells (Fig. 3D). In adhesion and spreading studies, we found that SC-94 cells adhered to laminin more quickly than SC-97 cells (compare sizes at 0.5 h) and elaborated more plasma membrane than SC-97 cells, becoming twice as large as SC-97 cells at 3.5 h of plating (Fig. 3F,G). However, when SC-94 cells reached a high cell density, they aligned with each other as bipolar cells and were morphologically indistinguishable from SC-97 (Fig. 3H) and WT SCs (data not shown). We also did not observe differences among SC-94, SC-97, and passage-matched WT SCs in proliferation rates and cell-cycle progression as assessed with propidium iodide staining and flow cytometry (data not shown).
Figure 3.

Generation of cofilin-deficient Schwann cells. Lentiviral delivery of cofilin shRNAi was used to create cofilin-deficient SCs. A, Schematic alignment of the shRNAi targets 93–97 on rat (Rattus norvegicus) cofilin-1 (NM017147) is shown. B, Western blots reveal the protein levels of cofilin and GAPDH in stable lentiviral-transduced (5 MOI) WT SCs expressing SCR and TurboGFP and shRNAi targets 93–97. C, Quantification of cofilin levels (B) normalized to GAPDH and expressed relative to WT SCs. D, Immunofluorescence staining for cofilin and F-actin using phalloidin in WT SCs and stable SC-97 and SC-94 lines verifies that SC-94 cells express low levels of cofilin, while WT SCs and SC-97 cells express cofilin. Phalloidin staining shows an increase in F-actin stress fibers and cell size in SC-94 compared to controls. E, Quantification of cofilin levels (D) of 20–30 individual WT SCs and SC-97 and SC-94 cells show a distribution of cofilin expression levels. F, SC-94 and SC-97 cells were seeded onto laminin-coated glass coverslips and imaged in real time for 3.0 h beginning 0.5 h after seeding in five separate experiments. Frames captured at 0.5 and 3.5 h are shown and reveal that SC-94 cells attach to laminin more quickly and spread more plasma membrane than control SC-97 cells. G, Quantification of cell size is shown in F. *p < 0.05; **p < 0.002. H, Images of SC-94 and SC-97 grown on PLL-coated glass coverslips reveal that cofilin deficiency in SC-94 cells does not interfere with acquisition of a bipolar morphology at high cell density. Scale bars: 20 μm.
To assess the role of cofilin in myelination, we seeded dissociated DRGN cultures with SC-94 and SC-97 and allowed them to develop for 10–14 d in myelination-permissive medium. Sudan black stained myelin sheaths were quantified in four experiments (Fig. 4A; Table 1). We found that SC-94 cells were largely unable to produce myelin under conditions that supported myelination by SC-97 and WT SCs (data not shown). In areas of the coculture with large axon fascicles, SC-94 cells appeared to associate with axons but did not elongate along them. An easily observable change in morphology that accompanies SC alignment and differentiation into the myelinating phenotype is nuclear elongation. This change in nuclear morphology was infrequently observed in SC-94 cells maintained for 10–14 d in myelination-permissive medium (Fig. 4A). MAG was expressed at a low level by SC-94 cells, but it was not assembled into myelin (Fig. 4B). An occasional MBP-positive SC was observed in SC-94 cocultures; however, the immunostaining pattern of the MBP-positive segments was abnormally thin and short (Fig. 4C). The occasional myelin segments could have been synthesized by SC-94 cells expressing relatively higher cofilin levels (Fig. 3E) or residual normal SCs from the purified DRGN cultures. In contrast, SC-97 and SC-SCR cells expressed MAG and MBP that were assembled into typical myelin sheaths. We also assessed whether SC-94 cells expressed Krox-20/Egr2, a myelin-specific transcription factor. Surprisingly, the Krox-20 expression level was higher in SC-94 than in SC-97 cocultures; however, it largely localized to the cytosol rather than the nucleus (Fig. 4D,E). Last, the number of SCs in the cocultures was counted to determine whether SC-94 cells failed to proliferate in contact with axons. Cell number was determined on the day after seeding onto neuron cultures as well as at the end of the 10 d myelinating period (Table 2). No differences in the number of SC-94 and SC-97 cells in the cocultures were found. These results indicate that SC-94 cells proliferate in response to axonal NRG1 and express cytosolic Krox-20 and MAG, but fail to assemble a myelin sheath.
Figure 4.
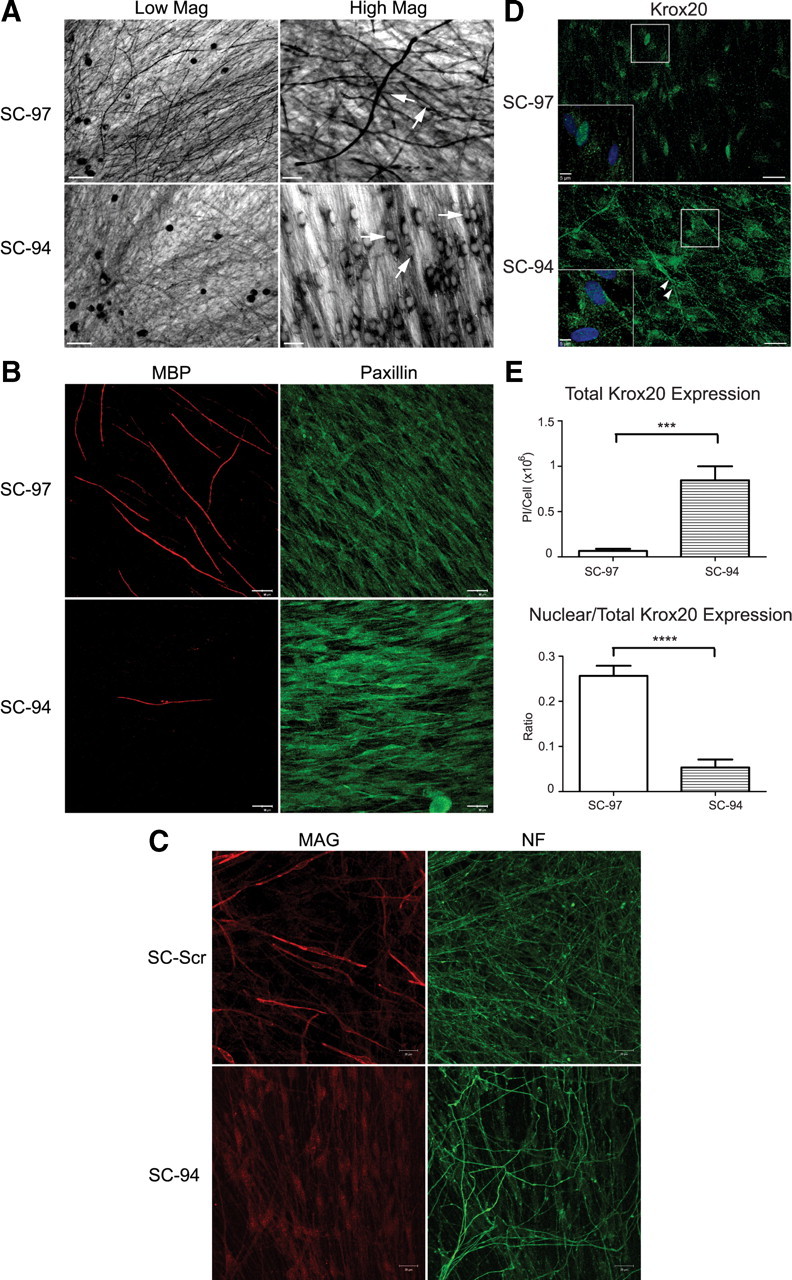
Cofilin is required for SC myelination. A, In four separate experiments, DRGN/SC cocultures were assessed for myelination by Sudan black staining after 10–14 d of growth in myelin-permissive medium. SC-97 (top) robustly myelinated sensory axons, whereas SC-94 (bottom) myelinated very infrequently. At higher magnification (right), SC-94 cells have rounded nuclei rather than oval nuclei as is typical for myelinating SCs. The oval nuclear shape of myelinating SC-97 is somewhat obscured but is visible in the cells indicated with arrows. Cocultures grown for 10 d in myelination-permissive medium were also immunostained for MBP, MAG, paxillin, neurofilament (NF), and Krox-20 expression. B, SC-97 cells produced MBP-positive myelin segments with normal appearance; however, some SC-94 cells expressing higher cofilin levels produced occasional MBP-segments that were abnormally thin and short. C, A subpopulation of SC-SCR (expressing scrambled shRNAi) cells expressed MAG and incorporated it into normal-appearing myelin segments, whereas all SC-94 cells expressed low levels of MAG that was not assembled into myelin. D, Single-plane images of DRGN/SC cocultures are shown. Krox-20 was expressed in the nuclei of SC-97 cells with only limited expression in the perinuclear region (inset). In contrast, Krox-20 immunoreactivity in SC-94 cells was largely cytoplasmic (see arrowheads), even extending into processes with low levels present in the nucleus (inset). DAPI-stained nuclei are shown in blue. E, Quantification of total Krox-20 intensity and ratio of nuclear/total intensity normalized to the number of nuclei (mean of 5 Z stacks with 7–11 slices using a 0.5 μm interval). SC-94 cells expressed more Krox-20 than SC-97 cells, but it is predominantly localized in the cytosol. ***p < 0.001, ****p < 0.0001. Scale bars: A, low magnification, 50 μm; high magnification, 20 μm; B, C, D, 20 μm; inset in D, 5 μm.
Table 1.
Quantification of Sudan black-stained myelin segments
| Experiment | Cell type | Na | Mean ± SEM | % Decrease | p value |
|---|---|---|---|---|---|
| 1 | 97 | 4 | 184 ± 33 | 85 | 0.0005 |
| 94 | 6 | 27 ± 7 | |||
| 2 | 97 | 6 | 12 ± 4.6 | 90 | 0.0399 |
| 94 | 6 | 1 ± 0.6 | |||
| 3 | 97 | 16 | 1095 ± 96 | 98 | 0.0001 |
| 94 | 14 | 15 ± 5 |
aN, Number of DRGNs/SCs cocultures examined
Table 2.
Number of DAPI-stained SCs in DRGNs/SCs cocultures
| Experiment | Cell type | Na | Mean ± SEM/field | p value |
|---|---|---|---|---|
| 1, M10d | SC-94 | 10 | 178 ± 10 | 0.1029 |
| SC-97 | 10 | 153 ± 10 | ||
| 2, M10d | SC-94 | 20 | 75 ± 12 | 0.1258 |
| SC-97 | 20 | 100 ± 10 | ||
| 3, CB1d | SC-94 | 24 | 122 ± 16 | 0.4125 |
| SC-97 | 24 | 108 ± 7 |
aN, Total number of fields; M10d, cocultures grown for 10 d in myelination feed; CB1d, cocultures seeded with SCs for 1 d.
We conducted electron microscopic analysis of the cocultures to assess the degree of morphological differentiation of SC-97 versus SC-94 (Fig. 5). In cross-sections, both WT SCs and SC-97 cells (Fig. 5A,B, respectively) produced compact myelin. In contrast, SC-94 cells demonstrated limited and abnormal development (Fig. 5C). Large-diameter axons often remained unsegregated (a1, a2), and many SC-94 processes failed to adhere to axons (exemplified by processes 1 and 2). A single SC-94 cell engulfed multiple relatively large-diameter axons (a3–a5) while simultaneously extending processes around other axons (processes 1, 2, and 6). This morphology indicates a failure to establish a one-to-one relationship with an axon. Additionally, this SC-94 cell produced 1.5 wraps around each of the larger-diameter axons (a3, a4) but the cytoplasmic processes were not polarized into typical mesaxons. A discontinuous basal lamina was also observed (Fig. 5C, inset, arrowheads). Whereas this amount of basal lamina deposition is not unusual for cocultures at this stage of development, the observed detached basal lamina is unusual. Ultrastructural analysis of en face sections of the cocultures (Fig. 5D,E) confirmed the inability of SC-94 processes to form continuous close appositions with the axonal membrane. SC-97 cells formed close contacts with the axolemma (Fig. 5D, arrows); however, the processes of SC-94 cells did not adhere consistently to the axon leaving stretches of the axolemma bare (E, arrows). The ultrastructural findings suggest that cofilin-deficient SCs fail to myelinate because they are unable to effectively regulate process extension, adhere to axons, and form typical basal lamina.
Figure 5.
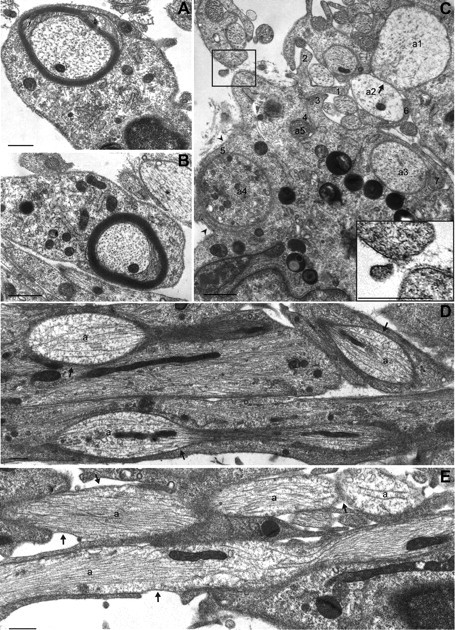
Cofilin is necessary for normal SC–axon interactions. A–E, Ultrastructural analyses were conducted on cross (A–C) and en face sections (D, E) of DRGN/SC cocultures grown for 10 d in myelin-permissive medium. Whereas WT SCs (A) and SC-97 cells (B) produced normal-appearing myelin within this time frame, SC-94 cells (C) did not. Large-diameter axons were not effectively segregated by SC-94 (axons a1, a2). SC-94 did not form a one-to-one relationship with axons, but rather elaborated multiple processes around both large- and small-diameter axons. Numbers indicate separate processes from a single SC-94 cell attempting to wrap two larger axons and multiple small ones (a3–a5). Arrowheads and the inset show discontinuous basal lamina (C). En face sections show that SC-97 processes formed tight appositions with axons (D, arrows), whereas SC-94 processes did not adhere well to axons (E, arrows). Scale bars: 1 μm.
Cofilin-deficient SCs have abnormal organization of CTIV and laminin
Because basal laminin formation and actin polymerization are needed for expression of myelin-specific genes (Fernandez-Valle et al., 1994, 1997), and detached basal lamina was observed in the ultrastructural analysis, the ability of SC-94 cells to secrete and organize basal lamina components was assessed by immunostaining. WT SCs and SC-97 and SC-94 cells were cocultured with sensory neurons and grown for 10 d in myelination-permissive medium. Cocultures were fixed but not permeabilized before immunostaining with antibodies to CTIV and laminin. We found differences in the abundance and organization of CTIV and laminin in SC-94 cocultures compared to SC-97 and WT-SC cocultures (Fig. 6) (WT SCs not shown). CTIV was highly expressed but was organized in patches in SC-94 cocultures, whereas it had a linear appearance in SC-97 and WT-SC cocultures. Similarly, laminin was secreted and assembled into linear arrays in SC-97 and WT-SC cocultures, but had an irregular distribution in SC-94 cocultures. These results demonstrate that cofilin-deficient SCs secrete but do not properly organize basal lamina components.
Figure 6.

Cofilin-deficient SCs assemble an atypical extracellular matrix. We assessed the ability of SC-94 to secrete and assemble basal lamina components by immunostaining DRGN/SC cocultures grown for 10 d in myelination-permissive medium with antibodies to CTIV and LAM. Cocultures were not permeabilized before immunostaining. CTIV was expressed by SC-97 and was assembled into linear arrays, whereas CTIV was expressed by SC-94 at high levels but was organized in patches throughout the coculture. Laminin was secreted and assembled into linear arrays in SC-97 cocultures, whereas it had an irregular distribution in SC-94 cocultures. Images are maximum intensity projections of 10 Z series collected at 0.4 μm intervals. Scale bars: 20 μm.
Cofilin-deficient SCs do not align on axons
To better assess the interaction of SC-94 with axons, 10-d-old myelinating cocultures were immunostained for the SC-specific marker S100 and for neurofilament. We observed an unusual organization of SC-94 cells in the cocultures. Notably, cofilin-negative and S100-positive SC-94 cells adhered to the laminin substrate forming a monolayer of flat, wide bipolar cells. They did however, extend plasma membrane around neurofilament-positive neurites that contacted their surface but did not engage and align on the axons (Fig. 7). SC-97 cells expressing both cofilin and S100 adhered to axons and elongated along them as thin bipolar SCs, and minimally contacted the underlying laminin substrate. To further investigate the ability of SC-94 cells to interact with axons, we conducted axon-alignment assays using CTG-labeled SCs grown with DRGN cultures for 24 h (Fig. 8A,B). We found that SC-97 cells, expressing 90% of normal cofilin levels, assumed a bipolar morphology within 24 h of seeding onto DRGN cultures. However, SC-94 cells, expressing only 20% of normal cofilin levels, were multipolar, a morphology incompatible with axon alignment. When SC-97 lines were prepared with 10 MOI of lentiviral transduction particles (as opposed to 5 MOI), their cofilin level dropped to 60% of normal, and the frequency of multipolar SCs increased in the 24 h assay (data not shown). We also compared axon alignment of cofilin-deficient SCs after 48 h of seeding on DRGN cultures grown on laminin versus collagen type 1 (Fig. 8C). SCs and their focal contacts and adhesions were visualized by immunostaining for vinculin. SC-94 cells failed to align along axon fascicles regardless of the substrate and the additional time. SC-97 cells aligned as bipolar cells along axons grown on both substrates. We noted that SC-94 cells formed vinculin-positive focal contacts and adhesions on the underlying substrate that could interfere with axon alignment by possibly sequestering SC processes. Alternatively, enhanced SC-94 cell adhesion to the substrate could be secondary to their inability to stabilize processes on axons. This appears more likely, as SCs are seeded on top of well-established 12-d-old neuron cultures through which SC processes must navigate before reaching the underlying substrate.
Figure 7.

Cofilin-deficient SCs do not engage axons. We used S100 and neurofilament immunostaining to examine the interaction between cofilin-deficient SCs and axons in DRGN/SC cocultures grown for 10 d in myelination-permissive medium. We also tested for cofilin expression to verify that cofilin levels remained low in SC-94. Images are single planes. A, Cofilin was expressed by SC-97 and localized throughout the SC and its bipolar processes. B, Cofilin levels were reduced in SC-94 cocultures. C, D, Similar areas of SC-97 and SC-94 cocultures are shown. S100-positive SC-97 (green) aligned on axons (red), whereas SC-94 adhered to the laminin substrate and spread into large bipolar cells. However, SC-94 extended plasma membrane around axons that contacted their surface. E, F, Neurofilament and DAPI staining of the fields shown in B are presented. Scale bars: 20 μm.
Figure 8.
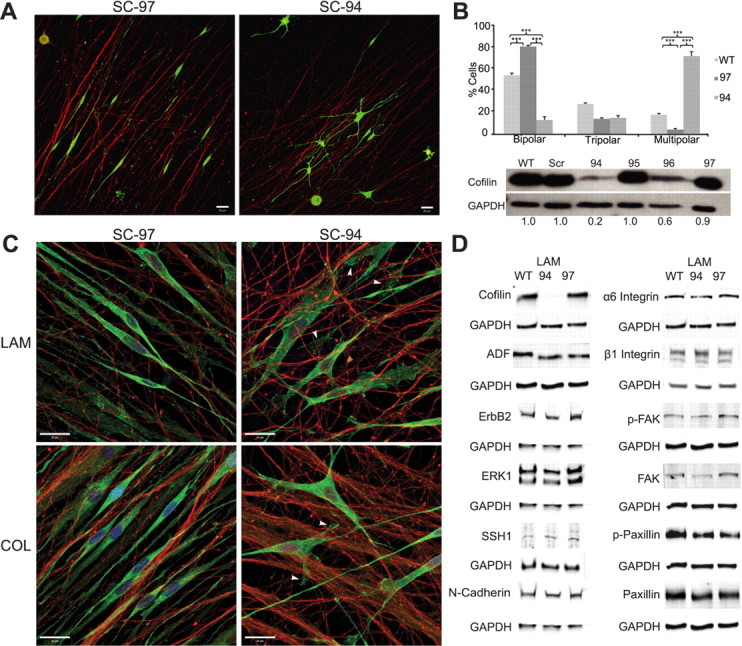
Cofilin is required for alignment of SCs on axons. A, Representative single-plane images of the morphology of CTG-labeled SC-97 (10% cofilin knockdown) and SC-94 cells (80% cofilin knockdown) is shown 24 h after seeding onto neurons (immunostained with neurofilament; red). SC-94 cells did not assume a bipolar morphology and did not align with the axons. B, Quantification of cell morphology of SC-94 and SC-97 cells is shown. Eighty percent of SC-94 cells exhibited a multipolar morphology, while <20% of WT SCs and SC-97 cells were multipolar. The cofilin levels of SC-94 and SC-97 cells were measured by Western blot analysis. ***p < 0.001. C, SC-97 and SC-94 lines were cocultured with DRGNs grown on two different substrates, LAM and collagen (COL). Forty-eight hours after seeding onto neurons, cocultures were fixed, and neurons were immunostained with neurofilament (red) and SCs with vinculin (green) to visualize SCs and focal adhesions. Images are single planes of representative areas. SC-94 cells were unable to assume a bipolar morphology and align along neurons grown on either substrate. D, Total protein extracts of WT SCs and SC-97 and SC-94 cells grown normally for 48 h on LAM were blotted for basal levels of adhesion molecules (integrins, N-cadherin) and other downstream signaling molecules. Cofilin deficiency did not correlate with an aberrant expression of other proteins, and viral transduction had no effect on expression levels of the tested proteins. Scale bars: 20 μm.
To assess whether SC-94 cells expressed normal levels of ErbB2 and integrin signaling proteins, Western blot analysis of isolated SC-94, SC-97, and WT SCs grown on laminin were conducted. The results revealed that SC-94 cells were deficient only in cofilin expression. These SCs expressed equivalent levels of the cofilin family member, ADF, as well as ErbB2, ERK1, N-cadherin, SSH1, α6 and β1 integrins, and the related signaling proteins, FAK and paxillin, which were both phosphorylated and thus active (Fig. 8D). These results suggests that SC-94 has intact ErbB2 and β1 integrin signaling pathways but is unable to modulate actin dynamics in response to receptor activity in the absence of cofilin.
Cofilin-deficient SCs do not increase in cell size in response to NRG1
We analyzed the cellular and biochemical responses of SC-94, SC-97, and WT SCs grown on PLL and on laminin to 30 min of NRG1 stimulation. The cells were immunostained for vinculin to label mature focal contacts and adhesions and with phalloidin. We assessed the number and length of focal contacts/adhesions, changes in F-actin levels, and cell size (Fig. 9A,B). SC-94 cells formed fewer but longer focal contacts/adhesions than SC-97 cells on both PLL and laminin. The vinculin-positive structures present in mock-stimulated SC-94 cells had insertions of F-actin stress fibers, which define them as focal adhesions (Katoh et al., 2011). In contrast, the vinculin-positive structures formed by SC-97 cells were largely devoid of stress fibers (Fig. 9A, insets). There was no significant change in the number or length of FAs between mock- and NRG1-stimulated conditions for either cell type. NRG1 stimulation generally resulted in a reduction in the amount of F-actin compared to mock-stimulated cells that was statistically significant only in SC-97 cells grown on laminin (a 24% decrease). Whereas SC-97 cells increased in size by 50% following NRG1 stimulation on both PLL and laminin, SC-94 cells did not increase in size when grown on PLL, and decreased in size when grown on laminin (Fig. 9B). We also assessed the activity of the ErbB2 and β1 integrin signaling pathways in NRG1-stimulated WT SCs and SC-94 and SC-97 cells grown on PLL and laminin by Western blot analysis. An increase in ErbB2 phosphorylation was detected following NRG1 stimulation for all cells grown on PLL compared to the mock condition. The increase in ErbB2 phosphorylation levels was modest for all cells when grown on laminin due to a higher level of basal activation. SC-94 cells had comparable increases in phosphorylation of ERK, FAK, and paxillin to WT SCs and SC-97 cells on both substrates (Fig. 9C). These results indicate that SC-94 cells initiate ErbB2- and β1 integrin-dependent signaling cascades in response to NRG1, but are unable to extend plasma membrane and increase in size in the absence of cofilin.
Figure 9.
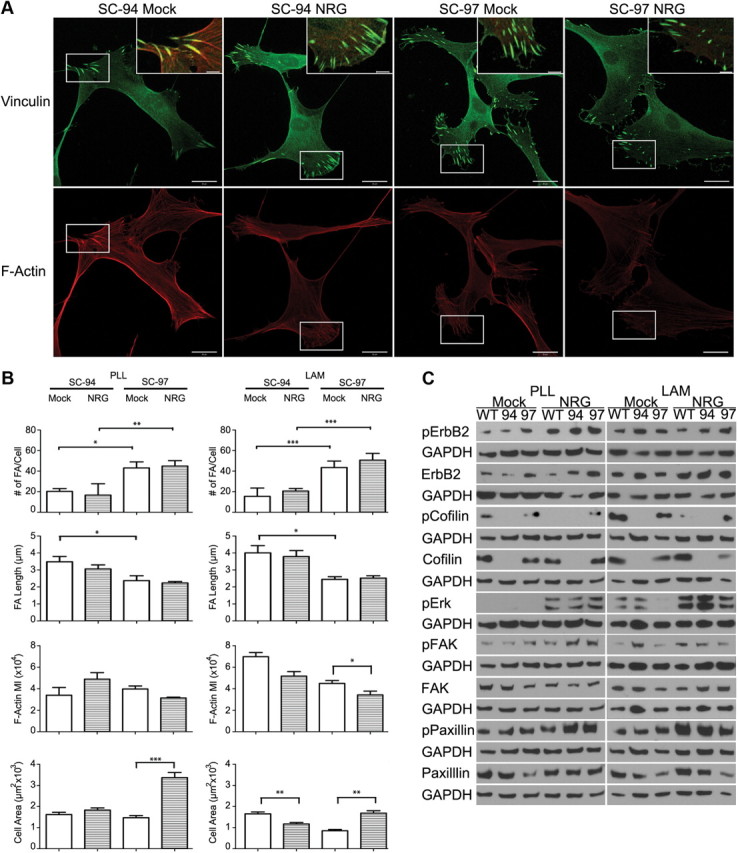
Cofilin-deficient SCs do not increase in size in response to NRG1. Subconfluent SC lines grown on PLL and PLL/LAM were starved and stimulated with NRG as described in Figure 1. A, SC lines grown on LAM were immunostained with antibodies to vinculin (green) and stained with phalloidin (red) to visualize focal contact/adhesions and F-actin, respectively. Scale bars: 20 μm; inset, 5 μm. B, Quantification of the number and length of FAs per cell, mean pixel intensity of phalloidin, and cell area are shown. SC-94 cells had fewer but longer FAs than SC-97 cells. SC-94 cells did not respond to NRG1 stimulation on PLL, or decreased in cell size after stimulation LAM, while SC-97 cells showed a significant increase on both substrates. Three independent experiments were analyzed. *p < 0.05; **p < 0.01; ***p < 0.001. C, Western blot analysis of 30 min NRG-stimulation assays of subconfluent WT SCs and SC-94 and SC-97 cells grown on PLL or LAM culture dishes are shown. No significant differences in protein phosphorylation were observed for SC-94 cells with respect to the controls.
Phosphorylated cofilin is necessary for SC elongation on axons
We examined the localization and phosphorylation states of cofilin, LIMK, and SSH1 in normal SCs cultured with axons for 24 h. To distinguish between neuronal and SC-expressed proteins, SCs were prelabeled with CellTracker Green, and axons were identified by neurofilament expression. Within 24 h of seeding onto axons, high levels of pS3-cofilin, pErbB2, pLIMK, and pSSH1 were observed in bipolar SC processes contacting axons (Fig. 10A). In unaligned, multipolar SCs, pS3-cofilin was not detected in processes and was confined to the perinuclear cytosol (Fig. 10B). To determine whether cofilin phosphorylation was needed for SCs to align on axons as bipolar cells, the experiment was repeated in the presence of BMS-5, a highly selective, potent LIMK inhibitor (Ross-Macdonald et al., 2008) (Fig. 10C). Immunostaining confirmed a decrease in phosphorylation of cofilin S3 in BMS-5 treated versus carrier-treated SCs (Fig. 10D,E). Fewer bipolar SCs were observed in 24 h cocultures grown in the presence of BMS-5 than in control cocultures (Fig. 10F). These results suggest that phosphorylation of cofilin S3 is needed for SCs to adopt a stable bipolar morphology in association with axons.
Discussion
The ability to rapidly expand plasma membrane is a unique biological function of myelinating SCs. Although myelin thickness has been genetically linked to the abundance of NRG1 on the axon surface (Michailov et al., 2004), the underlying pathways have not been elucidated. The present study sheds light on how NRG1 regulates actin dynamics in isolated SCs to promote expansion of the plasma membrane and an increase in cell size. Our results demonstrate that NRG1 rapidly activates cofilin's F-actin depolymerizing/severing activity in SCs and initiates membrane spreading. Moreover, we show that cofilin is required for the NRG1-induced increase in cell size. Last, we show that cofilin-deficient SCs are unable to align or myelinate sensory axons in vitro; thus. cofilin plays an essential role during myelination.
NRG1 stimulates a cofilin-dependent increase in SC size
Cofilin directs the site of new membrane expansion by severing and depolymerizing F-actin to generate new barbed ends for localized actin polymerization (Oser and Condeelis, 2009). Our conclusions that these activities are activated by NRG1 and required for NRG1-directed increase in SC size are supported by the results presented in Figures 1–3 and 9. We show that within 30 min of addition, NRG1 promotes a 35–50% increase in the size of WT SCs and SC-97 cells with a concomitant decrease in F-actin levels compared to the respective mock-stimulated cells. These morphological changes are associated with NRG1/ErbB2-dependent dephosphorylation of cofilin at serine 3 that activates cofilin's actin-depolymerizing/severing activity (Figs. 1, 9). The decrease in cofilin phosphorylation arises from NRG1-stimulated dephosphorylation and inhibition of LIMK and dephosphorylation and activation of SSH1 (Fig. 1) (Oser and Condeelis, 2009). Cofilin, but not pS3-cofilin (data not shown), is concentrated at the leading edge of protrusive membranes along with ErbB2 and SSH1 phosphatase in WT SCs (Fig. 2). This suggests that recruitment to and activation of cofilin at the leading edge is responsible for initiating membrane spreading in response to NRG1. This conclusion is further supported by the failure of cofilin-deficient SC-94 cells to increase in size following NRG1 stimulation (Fig. 9), although their innate ability to adhere and spread nondirectionally on laminin is enhanced compared to SC-97 cells (Fig. 3). This is consistent with a role for cofilin in localized membrane protrusions during chemotaxis of motile cells (Ghosh et al., 2004). For example, cofilin is necessary for the response of carcinoma cells to EGF gradients (Mouneimne et al., 2006; Sidani et al., 2007). An increase in cell size and F-actin stress fibers subsequent to cofilin knockdown has been reported in other cell types (Hotulainen et al., 2005).
SC-94 cells have similar levels of expression and activation of ErbB2, N-cadherin, α6 and β1 integrins and downstream effectors, ERK1/2, FAK, and paxillin as SC-97 and WT SCs (Fig. 8). Thus, pathways needed to respond to NRG1 appear intact in cofilin-deficient SCs. The related cofilin molecule ADF is expressed in SCs, and its expression level was unaltered following cofilin depletion. Because ADF did not functionally compensate for cofilin in SC-94 cells, it appears to have a distinct role in SCs. Overall, these studies demonstrate that cofilin is dephosphorylated in response to NRG1 stimulation and recruited to the leading edge of isolated SCs, where it participates in severing and/or depolymerizing F-actin to promote directional cell spreading.
Cofilin is essential for myelination
We hypothesized that cofilin activity would be necessary for polarized expansion of the SC membrane during myelination. We sought to test this hypothesis by coculturing cofilin-deficient SCs with sensory neurons and assessing their ability to form a myelin sheath. Surprisingly, we found that cofilin-deficient SCs are unable to even effectively engage axons and stably appose them. During the initial 24–48 h of interaction, SC-94 cells fail to extend bipolar processes along axons (Fig. 8). Over the following week, SC-94 cells adhere to the laminin substrate as flattened bipolar cells and develop focal contacts/adhesions. Isolated SC-94 cells form atypically long focal adhesions on both PLL and laminin compared to the focal contacts/adhesions formed by SC-97 cells (Fig. 9). It has been shown that focal adhesion turnover requires cofilin and F-actin depolymerization (Gupton et al., 2007; Marshall et al., 2009; Maruthamuthu et al., 2010). The aberrant adhesion and spreading of SC-94 cells on the substrate could be a consequence of their inability to stably engage axons in the absence of cofilin and is discussed below.
While our standard myelination assay is conducted over 10–14 d, SC-94/DRGN cocultures grown for 4 weeks in myelin-permissive medium did not further differentiate (data not shown), indicating that SC-94 cells were not simply delayed in differentiation. We also did not find differences in the number of DAPI- and Ki67-positive SC-94 cells in the DRGN cultures compared to controls (Table 2) (data not shown), indicating that cofilin-deficient SCs proliferate in response to axonal NRG1. Our analysis of the ErbB2 and β1 integrin pathways in isolated SC-94 cells and their ability to proliferate in response to soluble and axonal-NRG1 suggest that cofilin-deficient SCs activate pathways necessary for differentiation but cannot execute directed morphological changes in the absence of cofilin. This is supported by the low-level expression of MAG and cytosolic Krox-20 in SC-94 compared with controls. Translocation of Krox-20 into the nucleus is regulated by its interaction with 14-3-3 protein that maintains it in the cytoplasm (Dillon et al., 2007). Because cofilin directly binds 14-3-3 (Gohla and Bokoch 2002), loss of expression of this abundant protein in SCs could increase levels of free 14-3-3, thereby perturbing the balance of nuclear/cytosolic Krox-20 and contributing to the inability of SC-94 cells to myelinate. Contact between the SC and axon is needed for development of basal lamina. The deposition of basal lamina by cofilin-deficient SCs resembled that reported in studies in which direct contact between SCs and axons was prevented (Clark and Bunge, 1989). This early study revealed that SCs assemble normal-appearing basal lamina only when they ensheathe axons. Thus, the abnormal distribution of laminin and basal lamina in SC-94/DRGN cocultures could arise from their inability to stably engage axons as elongated bipolar cells. Abnormal laminin deposition and consequent aberrant motility have also been reported in keratinocytes and arose from deregulation of β4 integrin signaling to Rac1 and cofilin1 (Sehgal et al., 2006).
Phosphorylated cofilin plays a role in SC engagement of axons
SC-94 cells retain the ability to extend plasma membrane around axons but do so in an “unregulated” manner, as shown in Figure 5 and 7. Cofilin-deficient SCs engulf and wrap multiple axons at once, intermittently contact others, and fail to segregate larger-diameter axons. The inability to closely appose and adhere to axons could be due to an inability to stabilize their cytoskeleton in response to ErbB2 activation in the absence of cofilin. This possibility is supported by the distribution of pS3-cofilin in normal SC/DRGN cocultures (Fig. 10). Bipolar SC processes contained higher levels of phosphorylated cofilin S3, LIMK, and SSH1 than multipolar processes of axon-associated SCs. Moreover, inhibition of LIMK activity reduced pS3-cofilin levels in SCs, and concomitantly their ability to align bipolar processes on axons. This suggests that cofilin S3 phosphorylation plays a role during early differentiation and is needed to stabilize SC–axon contacts during axon engagement. Previously, phosphorylated ErbB2 and the Cdc42/Rac guanine exchange factor Dock7 were shown to be present at the leading edge of membrane protrusions in migrating SCs (Yamauchi et al., 2008). Thus, NRG1 could stimulate Cdc42/Rac-PAK1-dependent phosphorylation and activation of LIMK, leading to cofilin S3 phosphorylation during the initial alignment of SC on axons. Alternatively, cofilin could be phosphorylated in response to β1 integrin activation of Cdc42/Rac/Pak or Rho/ROCK, both of which phosphorylate LIMK. ROCK has been shown to play a role in SC myelination (Melendez-Vasquez et al., 2004).
Previous studies suggested that pS3-cofilin plays an important role in phospholipid signaling (Bernstein and Bamburg, 2010) by binding and sequestering PIP2 on the membrane (van Rheenen et al., 2007). A role for PIP3 in myelination has been demonstrated previously (Goebbels et al., 2010). A concomitant decrease in PIP2 levels observed in PTEN (phosphate and tensin homolog)-null sciatic nerves could lead to rampant cofilin activation and contribute to the observed hypermyelination. Additionally, pS3-cofilin directly stimulates phospholipase D1 in response to receptor activation (Han et al., 2007). This enzyme is regulated by Rho GTPases, protein kinase C, and PIP2 (Rudge and Wakelam, 2009). Phosphatidic acid regulates integrin-dependent adhesion and cytoskeletal remodeling, binds mTOR (mammalian target of rapamycin) and S6 kinase, and enriches the Rac guanine exchange factor DOCK2 at the leading edge of neutrophils (Gomez-Cambronero, 2010). Hence, the phenotype observed in cofilin-deficient SCs potentially reflects deregulation of phospholipid signaling as well as actin dynamics.
Cofilin is an end target for both NRG1 and laminin signaling. Our results support the conclusion that the spatiotemporal balance of phosphorylated and dephosphorylated cofilin S3 regulates SC function during myelination. During axon engagement, an increase in cofilin S3 phosphorylation would stabilize F-actin and decrease process motility, allowing adhesive SC–axon interactions to develop. During active myelination, dephosphorylation of cofilin S3 triggers directed expansion of the plasma membrane in response to NRG1. A working model summarizing our results is presented in Figure 11. Future studies will test the hypothesis that localized cofilin dephosphorylation along the inner mesaxon contributes to its motility during active myelination.
Figure 11.

Working model for cofilin function during Schwann cell myelination. We propose that the spatiotemporal balance of cofilin serine 3 phosphorylation and dephosphorylation regulates actin polymerization dynamics downstream of ErbB2/B3 and β1 integrin signaling in Schwann cells contacting axons. Schwann cell alignment on axons is facilitated by shifting the balance toward cofilin serine 3 phosphorylation that favors F-actin stabilization. In the absence of significant basal lamina deposition, α6β1 integrin and ErbB2/B3 receptors exist as a complex throughout the Schwann cell plasma membrane. Clustered β1 integrins activate Cdc42/Rac-dependent-Pak kinase (Thaxton et al., 2008) that increases LIMK-dependent phosphorylation of cofilin serine 3. As basal lamina develops, the receptors become polarized to opposing plasma membranes. Basal lamina clusters α6β1 integrin to promote cofilin serine 3 phosphorylation and stabilization of F-actin along the abaxonal plasma membrane. In contrast, NRG1 activation of ErbB2/B3 along the adaxonal plasma membrane inhibits LIMK and promotes SSH1 activity, which shifts the balance toward cofilin serine 3 dephosphorylation. Cycles of cofilin phosphorylation and dephosphorylation at the leading edge of the inner mesaxon allow expansion of the Schwann cell plasma membrane around the axon during active myelination.
Footnotes
This work was supported by DHHS/NIH award 5R01NS062825 (C.F.V.) and the Miami Project to Cure Paralysis. We thank Dr. Patrick Wood for critical review of this manuscript; Caroline Thompson, Teresa Kritsch, and Robert Banks for animal husbandry; Sandra Geden and Michelle Posadas for technical assistance; and Robin Mata, Lauren Carroll, and Ryan Bertetta for undergraduate research contributions.
The authors declare no competing financial interests.
References
- Bernstein BW, Bamburg JR. ADF/cofilin: a functional node in cell biology. Trends Cell Biol. 2010;20:187–195. doi: 10.1016/j.tcb.2010.01.001. [DOI] [PMC free article] [PubMed] [Google Scholar]
- Birchmeier C, Nave KA. Neuregulin-1, a key axonal signal that drives Schwann cell growth and differentiation. Glia. 2008;56:1491–1497. doi: 10.1002/glia.20753. [DOI] [PubMed] [Google Scholar]
- Brockes JP, Fields KL, Raff MC. Studies on cultured rat Schwann cells. I. Establishment of purified populations from cultures of peripheral nerve. Brain Res. 1979;165:105–118. doi: 10.1016/0006-8993(79)90048-9. [DOI] [PubMed] [Google Scholar]
- Chen LM, Bailey D, Fernandez-Valle C. Association of beta 1 integrin with focal adhesion kinase and paxillin in differentiating Schwann cells. J Neurosci. 2000;20:3776–3784. doi: 10.1523/JNEUROSCI.20-10-03776.2000. [DOI] [PMC free article] [PubMed] [Google Scholar]
- Clark MB, Bunge MB. Cultured Schwann cells assemble normal-appearing basal lamina only when they ensheathe axons. Dev Biol. 1989;133:393–404. doi: 10.1016/0012-1606(89)90043-2. [DOI] [PubMed] [Google Scholar]
- Dan C, Kelly A, Bernard O, Minden A. Cytoskeletal changes regulated by the PAK4 serine/threonine kinase are mediated by LIM kinase 1 and cofilin. J Biol Chem. 2001;276:32115–32121. doi: 10.1074/jbc.M100871200. [DOI] [PubMed] [Google Scholar]
- Dillon RL, Brown ST, Ling C, Shioda T, Muller WJ. An EGR2/CITED1 transcription factor complex and the 14–3-3sigma tumor suppressor are involved in regulating ErbB2 expression in a transgenic-mouse model of human breast cancer. Mol Cell Biol. 2007;27:8648–8657. doi: 10.1128/MCB.00866-07. [DOI] [PMC free article] [PubMed] [Google Scholar]
- Edwards DC, Sanders LC, Bokoch GM, Gill GN. Activation of LIM-kinase by Pak1 couples Rac/Cdc42 GTPase signalling to actin cytoskeletal dynamics. Nat Cell Biol. 1999;1:253–259. doi: 10.1038/12963. [DOI] [PubMed] [Google Scholar]
- Fernandez-Valle C, Gwynn L, Wood PM, Carbonetto S, Bunge MB. Anti-beta 1 integrin antibody inhibits Schwann cell myelination. J Neurobiol. 1994;25:1207–1226. doi: 10.1002/neu.480251004. [DOI] [PubMed] [Google Scholar]
- Fernandez-Valle C, Gorman D, Gomez AM, Bunge MB. Actin plays a role in both changes in cell shape and gene-expression associated with Schwann cell myelination. J Neurosci. 1997;17:241–250. doi: 10.1523/JNEUROSCI.17-01-00241.1997. [DOI] [PMC free article] [PubMed] [Google Scholar]
- Ghosh M, Song X, Mouneimne G, Sidani M, Lawrence DS, Condeelis JS. Cofilin promotes actin polymerization and defines the direction of cell motility. Science. 2004;304:743–746. doi: 10.1126/science.1094561. [DOI] [PubMed] [Google Scholar]
- Goebbels S, Oltrogge JH, Kemper R, Heilmann I, Bormuth I, Wolfer S, Wichert SP, Möbius W, Liu X, Lappe-Siefke C, Rossner MJ, Groszer M, Suter U, Frahm J, Boretius S, Nave KA. Elevated phosphatidylinositol 3,4,5-trisphosphate in glia triggers cell-autonomous membrane wrapping and myelination. J Neurosci. 2010;30:8953–8964. doi: 10.1523/JNEUROSCI.0219-10.2010. [DOI] [PMC free article] [PubMed] [Google Scholar]
- Gohla A, Bokoch GM. 14–3-3 regulates actin dynamics by stabilizing phosphorylated cofilin. Curr Biol. 2002;12:1704–1710. doi: 10.1016/s0960-9822(02)01184-3. [DOI] [PubMed] [Google Scholar]
- Gohla A, Birkenfeld J, Bokoch GM. Chronophin, a novel HAD-type serine protein phosphatase, regulates cofilin-dependent actin dynamics. Nat Cell Biol. 2005;7:21–29. doi: 10.1038/ncb1201. [DOI] [PubMed] [Google Scholar]
- Gomez-Cambronero J. New concepts in phospholipase D signaling in inflammation and cancer. ScientificWorldJournal. 2010;10:1356–1369. doi: 10.1100/tsw.2010.116. [DOI] [PMC free article] [PubMed] [Google Scholar]
- Gupton SL, Eisenmann K, Alberts AS, Waterman-Storer CM. mDia2 regulates actin and focal adhesion dynamics and organization in the lamella for efficient epithelial cell migration. J Cell Sci. 2007;120:3475–3487. doi: 10.1242/jcs.006049. [DOI] [PubMed] [Google Scholar]
- Hall A. Rho GTPases and the control of cell behaviour. Biochem Soc Trans. 2005;33:891–895. doi: 10.1042/BST20050891. [DOI] [PubMed] [Google Scholar]
- Han L, Stope MB, de Jesús ML, Oude Weernink PA, Urban M, Wieland T, Rosskopf D, Mizuno K, Jakobs KH, Schmidt M. Direct stimulation of receptor-controlled phospholipase D1 by phospho-cofilin. EMBO J. 2007;26:4189–4202. doi: 10.1038/sj.emboj.7601852. [DOI] [PMC free article] [PubMed] [Google Scholar]
- Hotulainen P, Paunola E, Vartiainen MK, Lappalainen P. Actin-depolymerizing factor and cofilin-1 play overlapping roles in promoting rapid F-actin depolymerization in mammalian nonmuscle cells. Mol Biol Cell. 2005;16:649–664. doi: 10.1091/mbc.E04-07-0555. [DOI] [PMC free article] [PubMed] [Google Scholar]
- Huang TY, DerMardirossian C, Bokoch GM. Cofilin phosphatases and regulation of actin dynamics. Curr Opin Cell Biol. 2006;18:26–31. doi: 10.1016/j.ceb.2005.11.005. [DOI] [PubMed] [Google Scholar]
- Katoh K, Kano Y, Noda Y. Rho-associated kinase-dependent contraction of stress fibres and the organization of focal adhesions. J R Soc Interface. 2011;8:305–311. doi: 10.1098/rsif.2010.0419. [DOI] [PMC free article] [PubMed] [Google Scholar]
- Marshall TW, Aloor HL, Bear JE. Coronin 2A regulates a subset of focal-adhesion-turnover events through the cofilin pathway. J Cell Sci. 2009;122:3061–3069. doi: 10.1242/jcs.051482. [DOI] [PMC free article] [PubMed] [Google Scholar]
- Maruthamuthu V, Aratyn-Schaus Y, Gardel ML. Conserved F-actin dynamics and force transmission at cell adhesions. Curr Opin Cell Biol. 2010;22:583–588. doi: 10.1016/j.ceb.2010.07.010. [DOI] [PMC free article] [PubMed] [Google Scholar]
- Melendez-Vasquez CV, Einheber S, Salzer JL. Rho kinase regulates Schwann cell myelination and formation of associated axonal domains. J Neurosci. 2004;24:3953–3963. doi: 10.1523/JNEUROSCI.4920-03.2004. [DOI] [PMC free article] [PubMed] [Google Scholar]
- Michailov GV, Sereda MW, Brinkmann BG, Fischer TM, Haug B, Birchmeier C, Role L, Lai C, Schwab MH, Nave KA. Axonal neuregulin-1 regulates myelin sheath thickness. Science. 2004;304:700–703. doi: 10.1126/science.1095862. [DOI] [PubMed] [Google Scholar]
- Mouneimne G, DesMarais V, Sidani M, Scemes E, Wang W, Song X, Eddy R, Condeelis J. Spatial and temporal control of cofilin activity is required for directional sensing during chemotaxis. Curr Biol. 2006;16:2193–2205. doi: 10.1016/j.cub.2006.09.016. [DOI] [PubMed] [Google Scholar]
- Niwa R, Nagata-Ohashi K, Takeichi M, Mizuno K, Uemura T. Control of actin reorganization by Slingshot, a family of phosphatases that dephosphorylate ADF/cofilin. Cell. 2002;108:233–246. doi: 10.1016/s0092-8674(01)00638-9. [DOI] [PubMed] [Google Scholar]
- Nodari A, Zambroni D, Quattrini A, Court FA, D'Urso A, Recchia A, Tybulewicz VL, Wrabetz L, Feltri ML. Beta1 integrin activates Rac1 in Schwann cells to generate radial lamellae during axonal sorting and myelination. J Cell Biol. 2007;177:1063–1075. doi: 10.1083/jcb.200610014. [DOI] [PMC free article] [PubMed] [Google Scholar]
- Ohashi K, Nagata K, Maekawa M, Ishizaki T, Narumiya S, Mizuno K. Rho-associated kinase ROCK activates LIM-kinase 1 by phosphorylation at threonine 508 within the activation loop. J Biol Chem. 2000;275:3577–3582. doi: 10.1074/jbc.275.5.3577. [DOI] [PubMed] [Google Scholar]
- Oser M, Condeelis J. The cofilin activity cycle in lamellipodia and invadopodia. J Cell Biochem. 2009;108:1252–1262. doi: 10.1002/jcb.22372. [DOI] [PMC free article] [PubMed] [Google Scholar]
- Osherov N, Gazit A, Gilon C, Levitzki A. Selective inhibition of the epidermal growth factor and HER2/neu receptors by tyrphostins. J Biol Chem. 1993;268:11134–11142. [PubMed] [Google Scholar]
- Ross-Macdonald P, de Silva H, Guo Q, Xiao H, Hung CY, Penhallow B, Markwalder J, He L, Attar RM, Lin TA, Seitz S, Tilford C, Wardwell-Swanson J, Jackson D. Identification of a nonkinase target mediating cytotoxicity of novel kinase inhibitors. Mol Cancer Ther. 2008;7:3490–3498. doi: 10.1158/1535-7163.MCT-08-0826. [DOI] [PubMed] [Google Scholar]
- Rudge SA, Wakelam MJ. Inter-regulatory dynamics of phospholipase D and the actin cytoskeleton. Biochim Biophys Acta. 2009;1791:856–861. doi: 10.1016/j.bbalip.2009.04.008. [DOI] [PubMed] [Google Scholar]
- Sehgal BU, DeBiase PJ, Matzno S, Chew TL, Claiborne JN, Hopkinson SB, Russell A, Marinkovich MP, Jones JC. Integrin beta4 regulates migratory behavior of keratinocytes by determining laminin-332 organization. J Biol Chem. 2006;281:35487–35498. doi: 10.1074/jbc.M606317200. [DOI] [PMC free article] [PubMed] [Google Scholar]
- Sidani M, Wessels D, Mouneimne G, Ghosh M, Goswami S, Sarmiento C, Wang W, Kuhl S, El-Sibai M, Backer JM, Eddy R, Soll D, Condeelis J. Cofilin determines the migration behavior and turning frequency of metastatic cancer cells. J Cell Biol. 2007;179:777–791. doi: 10.1083/jcb.200707009. [DOI] [PMC free article] [PubMed] [Google Scholar]
- Taveggia C, Zanazzi G, Petrylak A, Yano H, Rosenbluth J, Einheber S, Xu X, Esper RM, Loeb JA, Shrager P, Chao MV, Falls DL, Role L, Salzer JL. Neuregulin-1 type III determines the ensheathment fate of axons. Neuron. 2005;47:681–694. doi: 10.1016/j.neuron.2005.08.017. [DOI] [PMC free article] [PubMed] [Google Scholar]
- Thaxton C, Lopera J, Bott M, Baldwin ME, Kalidas P, Fernandez-Valle C. Phosphorylation of the NF2 tumor suppressor in Schwann cells is mediated by Cdc42-Pak and requires paxillin binding. Mol Cell Neurosci. 2007;34:231–242. doi: 10.1016/j.mcn.2006.11.003. [DOI] [PubMed] [Google Scholar]
- Thaxton C, Lopera J, Bott M, Fernandez-Valle C. Neuregulin and laminin stimulate phosphorylation of the NF2 tumor suppressor in Schwann cells by distinct protein kinase A and p21-activated kinase-dependent pathways. Oncogene. 2008;27:2705–2715. doi: 10.1038/sj.onc.1210923. [DOI] [PubMed] [Google Scholar]
- Thaxton C, Bott M, Walker B, Sparrow NA, Lambert S, Fernandez-Valle C. Schwannomin/merlin promotes Schwann cell elongation and influences myelin segment length. Mol Cell Neurosci. 2011;47:1–9. doi: 10.1016/j.mcn.2010.12.006. [DOI] [PMC free article] [PubMed] [Google Scholar]
- van Rheenen J, Song X, van Roosmalen W, Cammer M, Chen X, Desmarais V, Yip SC, Backer JM, Eddy RJ, Condeelis JS. EGF-induced PIP2 hydrolysis releases and activates cofilin locally in carcinoma cells. J Cell Biol. 2007;179:1247–1259. doi: 10.1083/jcb.200706206. [DOI] [PMC free article] [PubMed] [Google Scholar]
- von Philipsborn A, Bastmeyer M. Mechanisms of gradient detection: a comparison of axon pathfinding with eukaryotic cell migration. Int Rev Cytol. 2007;263:1–62. doi: 10.1016/S0074-7696(07)63001-0. [DOI] [PubMed] [Google Scholar]
- Yamauchi J, Miyamoto Y, Chan JR, Tanoue A. ErbB2 directly activates the exchange factor Dock7 to promote Schwann cell migration. J Cell Biol. 2008;181:351–365. doi: 10.1083/jcb.200709033. [DOI] [PMC free article] [PubMed] [Google Scholar]
- Yonezawa N, Nishida E, Iida K, Yahara I, Sakai H. Inhibition of the interactions of cofilin, destrin, and deoxyribonuclease I with actin by phosphoinositides. J Biol Chem. 1990;265:8382–8386. [PubMed] [Google Scholar]