

Abstract
Animal model phenotyping, in utero exposure toxiciy studies, and investigation into causes of embryonic, fetal, or perinatal deaths have required pathologists to recognize and diagnose developmental disorders in spontaneous and engineered mouse models of disease. In mammals, the liver is the main site of hematopoiesis during fetal development, has endocrine and exocrine functions important for maintaining homeostasis in fetal and adult life; and performs other functions including waste detoxification, production and removal of glucose, glycogen storage, triglyceride and fatty acid processing, and serum protein production. Due to its role in many critical functions, alterations in the size, morphology, or function(s) of the liver often lead to embryonic lethality. Many publications and websites describe individual aspects of hepatobiliary development at defined stages. However, no single resource provides a detailed histological evaluation of H&E-stained sections of the developing murine liver and biliary systems using high-magnification and high-resolution color images. The work herein provides a histology atlas of hepatobiliary development between embryonic days 9.5-18.5. Although the focus of this work is normal hepatobiliary development, common defects in liver development are also described as a reference for pathologists who may be asked to phenotype mice with congenital, inherited, or treatment-related hepatobiliary defects.
Keywords: liver, embryo, mouse, development, phenotype, atlas, hematopoiesis
Introduction
Despite the liver’s essential functions, little is known about the factors that underlie liver development during gestation. In light of this situation, the American Liver Foundation has published the “Pediatric Liver Research Agenda” (Sokol 2002) advocating increased funding toward understanding embryonic and fetal liver development in order to provide important insights into treatments and preventative strategies for human pediatric liver disease. Thus, with the use of transgenic and gene targeting technologies in mice, the molecular mechanisms of mammalian liver development are currently heavily investigated (reviewed in Duncan 2003; Zaret 1996). These studies have led to the identification of some of the individual factors critical for hepatic competence and subsequent liver morphogenesis. As the number of genetically modified mice increases, the number of animal models with hepatic defects showing functional and/or structural phenotypic abnormalities will also rise.
Many of the structures in the developing mammalian embryo are identified in Kaufman’s detailed histological atlas of mouse development (Kaufman 1999), Sulik and Bream’s online tutorial of normal development using scanning electron micrographs (http://www.med.unc.edu/embryo_images/), a high-resolution magnetic resonance imaging atlas of the embryonic and neonatal mouse (Petiet et al. 2008), and the Edinburgh 3D digital atlas of mouse embryonic development (http://genex.hgu.mrc.ac.uk/). These resources, while excellent, emphasize images at relatively low magnification and/or are black-and-white representations. The goal of this present histology atlas of mouse hepatobiliary development is to provide a high-magnification resource of conventional H&E (hematoxylin and eosin) stained color images for pathologists and biomedical scientists to use as an aid in identifying normal structures and cell types within the developing liver and biliary systems. The images were chosen to illustrate the main developmental events including structures and cell morphology seen at each gestational day between E9.5 and E18.5 (where the time of conception is designated as E0.5).
The terms “embryo,” “fetus,” and “conceptus” are used within this atlas and are sometimes used interchangeably within the literature. For these reasons, definition of these terms is warranted. The term “embryo” is used for the developing human individual from the time of implantation until the time of onset of bone marrow formation in the humerus, which is about the end of the eighth week postconception. After this stage and until birth, the term “fetus” is used. “Conceptus” is a term that can be used for both the embryo and fetus but also includes the embryonic part of the placenta as well as the amnion, chorion, and yolk sac. The “embryo” classification scheme allows for a standardized staging system for human embryos, and distinguishing between these stages may occasionally be of critical importance. Since the mouse has a much shorter gestation period, the designation of “embryo” versus “fetus” is less important, whereas the developmental age post-conception is critically important. For this reason, the term “embryo” is used to define all stages of murine development between fertilization and birth with the stage of development indicated by the gestational age (E0.5 + days postconception) (Kaufman 1999). Additional anatomic terminologies used for human embryos/fetuses that do not correspond to mouse anatomy are “superior” and “inferior.” For these terms, the official international veterinary nomenclature (“cranial” and “caudal,” respectively) is used (Nomina Anatomica Veterinaria 2007). For example, the veterinary terms for inferior vena cava and superior mesenteric vein are “caudal vena cava” and “cranial mesenteric vein,” respectively.
This atlas includes images and descriptions of normal microanatomy of the developing mouse liver, as well as descriptions of changes in the individual cell populations and in cellular organization that occur as the liver matures during gestation. It should be noted that many of the structures identifiable within the developing liver might only be seen on a select few slides from any particular stage of development. Thus, to avoid missing critical structures, it is critical that evaluation of the embryonic liver involve examination of a subset of serial sections through the entire organ. Although it may be ideal to use three views (transverse, sagittal, frontal) to assess the development of many organ systems, the developing hepatobiliary system is best illustrated using frontal and transverse sections. These views have the benefit of showing both the left and right liver lobes simultaneously. Also, due to the potential for strain differences when evaluating normal development, it is crucial to always compare potential defects to concurrent strain- and age-matched controls; littermates, if available, are always the ideal source for comparison.
The Jackson Laboratory has published an online Mammalian Phenotype Browser, which includes liver and biliary system abnormalities (http://www.informatics.jax.org). The lists of hepatic and biliary abnormalities provided on this Web site have been summarized in Tables 1 and 2, respectively. This site includes annotations and references for different genotypes of mouse models with abnormal liver and biliary system morphologies including abnormal liver parenchyma, abnormal liver size, hepatic necrosis, hepatic steatosis, abnormal bile duct and gallbladder morphology, and a range of other abnormalities.
TABLE 1.
Abnormal hepatic phenotypes found in genetically modified mice.
| Hepatic phenotype | Number of genotypes with a certain phenotype |
|---|---|
| Abnormal liver morphology | 1,093 |
| Abnormal liver development | 62 |
| Delayed hepatic development | 8 |
| Abnormal liver iron levels | 67 |
| Decreased liver iron | 9 |
| Increased liver iron | 55 |
| Abnormal liver parenchyma morphology | 222 |
| Abnormal liver lobule morphology | 213 |
| Abnormal bile canaliculus | 6 |
| Abnormal hepatocytes | 190 |
| Decreased apoptosis | 8 |
| Decreased number | 20 |
| Dissociation | 7 |
| Increased apoptosis | 44 |
| Abnormal liver sinusoids | 33 |
| Abnormal perisinusoidal space | 1 |
| Abnormal liver size | 449 |
| Abnormal liver weight | 196 |
| Enlarged liver | 256 |
| Small liver | 193 |
| Hepatic necrosis | 77 |
| Diffuse | 2 |
| Focal | 15 |
| Multifocal | 9 |
| Abnormal vasculature morphology | 52 |
| Hepatic steatosis | 200 |
| Liver abscess | 1 |
| Liver cirrhosis | 5 |
| Liver cysts | 26 |
| Liver degeneration | 27 |
| Liver fibrosis | 33 |
| Pale liver | 81 |
Main categories of abnormal hepatic phenotypes are indicated in bold and subcategories are italicized. The number of genotypes with a certain hepatic phenotype is indicated. One genotype may have several different phenotypes, and vice versa. These data were collected from the Mouse Genome Database (MGD). Mouse Genome Informatics Web site, The Jackson Laboratory, Bar Harbor, Maine (http://www.informatics.jax.org), retrieved March 2010. (Search: phenotypes; phenotypes, diseases and alleles query; anatomic systems affected by phenotypes; liver/biliary system; full mammalian phenotype ontology; liver/biliary system phenotype; abnormal liver/bilary system morphology; abnormal liver/bilary system development; abnormal liver development; etc.)
TABLE 2.
Abnormal biliary phenotypes found in genetically modified mice.
| Biliary phenotype | Number of genotypes with a certain phenotype |
|---|---|
| Abnormal biliary tract morphology | 71 |
| Abnormal bile duct morphology | 53 |
| Bile duct development | 26 |
| Extrahepatic bile duct morphology | 6 |
| Common bile duct morphology | 2 |
| Common hepatic duct morphology | 0 |
| Cystic duct morphology | 3 |
| Intrahepatic bile duct morphology | 1 |
| Bile duct hyperplasia | 4 |
| Biliary cyst | 8 |
| Abnormal gallbladder morphology | 26 |
| Cystic duct morphology | 3 |
| Gallbladder epithelium morphology | 0 |
| Gallbladder infundibulum morphology | 0 |
| Absent gallbladder | 6 |
| Dilated gallbladder | 10 |
| Enlarged gallbladder | 5 |
| Small gallbladder | 1 |
Main categories of biliary phenotypes are indicated in bold and subcategories are italicized. The number of genotypes with a certain biliary phenotype is indicated. One genotype may have several different biliary phenotypes, and vice versa. These data were collected from the Mouse Genome Database (MGD), Mouse Genome Informatics Web site, The Jackson Laboratory, Bar Harbor, Maine (http://www.informatics.jax.org), retrieved March 2010. (Search: phenotypes; phenotypes, diseases and alleles query; anatomic systems affected by phenotypes; liver/biliary system; full mammalian phenotype ontology; liver/biliary system phenotype; abnormal liver/bilary system morphology; abnormal liver/bilary system development; abnormal bile duct development; etc.)
The following section on hepatic induction and early liver development gives an overview of the characterization of hepatic specification (hepatic lineage differentiation from foregut endoderm) and may not be necessary for the routine anatomic evaluation of normal/abnormal hepatobiliary development. However, a good understanding of site-specific molecular events may allow comparative pathologists to provide an additional level of value by ensuring that relevant structures have been thoroughly evaluated. The development of the mouse hepatobiliary system from E9.5 to E18.5, including an overview of venous drainage to the placenta and hematopoiesis, are subsequently described and illustrated in detail with labeled representative histological images of different stages and orientations. The main hepatobiliary structural and hematopoietic events that occur during gestation are summarized in Tables 3 and 4, respectively.
TABLE 3.
Main morphological changes during mouse gestation.
| E8.0 | Ventral wall of the foregut is positioned adjacent to the developing heart, from which it receives cell signals to induce the development of hepatic tissue. |
| E9.0-9.5 | Initiation of liver development. |
| Alpha-fetoprotein expression begins. Decreases later in development. | |
| E9.5-E10.0 | Formation of the hepatic bud. |
| Separation of the liver bud into the cranial and caudal lobes. | |
| Gallbladder arises from caudal liver division. | |
| Extrahepatic biliary system and intrahepatic bile ducts arise from the cranial liver division. | |
| E10-10.5 | Hepatic cords formed. |
| Vitelline veins branch within the septum transversum mesenchyme to form the hepatic sinusoids, which comprise the majority of the liver volume. | |
| Gallbladder primordium present. | |
| E10.5-11.5 | Substantial increase in liver size secondary to hepatoblast proliferation and intrahepatic hematopoietic activity. |
| Common bile duct joins the gallbladder to the small intestine. | |
| E11.5-E12.0 | Liver replaces the visceral yolk sac as the primary supplier of hematopoietic cells. |
| Left umbilical vein evolves to form the ductus venosus. | |
| Albumin expression begins and increases until adulthood. | |
| Elongation of the gallbladder. | |
| E12.5 | Increase in functional hepatic parenchyma; decrease in hepatic sinusoids. |
| Appearance of Ito cells (not visible by H&E). | |
| Liver lobes distinguished by development of interlobular spaces. | |
| Right vitelline vein is now the portal vein. | |
| Gallbladder essentially unchanged from E12.5-E18.5. | |
| E13.5 | Liver continues to increase in size and occupies the majority of the abdominal cavity. |
| Falciform ligament is present. | |
| Fissures divide the liver into 4 main lobes: median, right, left and caudate. | |
| Median lobe divided in to the right and left median lobe. | |
| Right lobe divided in to the right cranial (anterior) and right caudal (posterior) lobe. | |
| Intrahepatic bile duct differentiation occurs. | |
| E14.5 | Architecture of the developing liver remains the same, while the organ continues to grow. |
| Interlobar spaces completely penetrate through the liver lobes. | |
| Hepatocytes and biliary epithelial cells begin to differentiate from bipotential hepatoblasts. | |
| Hepatoblasts give rise to mature hepatocytes, which differentiate into cholangiocytes in the developing periportal areas. | |
| Focus of the embryonic liver shifts from hematopoiesis to hepatic metabolism. | |
| E15.0-E15.5 | Hepatocyte volume and individual hepatocyte size increases. |
| Ductal plate formed by biliary precursor cells. | |
| E16.5 | Hepatocytes have greater contact with each other as the hematopoietic population recedes. |
| E17.5-E18.5 | Architecturally, the liver is unchanged from 14.5. |
| Bile ducts form. | |
| Postnatal | Maintains characteristic histological architecture; hepatic cords separated by sinusoids. |
| Hepatocytes organized into hepatic lobules. | |
| Final stage of bile duct remodeling. | |
| Proliferation of biliary cells, increase in portal triad formation occurs 10-20 days after birth. | |
| Liver mass increases several fold the first 3 weeks, followed by a decline in the fourth week. |
Ages are approximate.
TABLE 4.
Main hematopoietic events during mouse gestation.
| E7.0 | Primitive hematopoiesis begins in the yolk sac, enter circulation, and continue to mature. |
| E9.0-E11.5 | Progenitor cells leave circulation and enter liver. |
| E11.5 | Liver becomes the major site of hematopoiesis (E11.5-E12.5). |
| Hematopoietic compartment is ~34% of liver volume. | |
| Majority of hematopoietic cells are nucleated erythroid cells, mostly proerythroblasts. | |
| Granulocyte progenitors are rarely seen. | |
| E12.5 | Hematopoietic compartment is ~68% of liver mass. |
| Erythropoietic cells increase in number, becoming more differentiated. | |
| T lymphocytes are the primary lymphoid progenitor cell. | |
| B cell and granulocyte progenitors are rare. | |
| E13.5 | Peak stage of hematopoiesis in the liver. |
| Hematopoietic compartment is ~75% of liver volume by E13.0. | |
| Erythroblastic islands appear (E13.0-E14.0). | |
| T cell progenitors have decreased (primary site of hematopoiesis shifted to thymus). | |
| B cell progenitors have increased. | |
| Granulocyte progenitors present in low numbers, scattered throughout. | |
| Megakaryocytes increase in number. | |
| E14.5 | Most RBCs are still nucleated. |
| Hematopoietic foci appear cord-shaped. | |
| Erythroblastic islands still present and increased in number. | |
| Proerythroblasts decrease, orthochromatic erythroblasts increase. | |
| B lymphocytes are the primary lymphoid progenitor cell. | |
| Granulocytes progenitors present in low numbers, scattered throughout. | |
| E15.0-E15.5 | Site of hematopoiesis for erythroid and myelolymphoid precursors shifts from the liver to the spleen. |
| Erythroblasts still the main hematopoietic cell within hepatic cords. | |
| Granulocytes progenitors present in low numbers, scattered throughout. | |
| Most intravascular RBCs are enucleated, anisocytosis is common. | |
| Megakaryocytes still present in high numbers. | |
| E16.5 | Major site of hematopoiesis shifts from the liver and spleen to the bone marrow (E16.0). |
| Hematopoietic population declines. | |
| Some intravascular nucleated RBCs still present, most are anucleate. | |
| Increase in granulocyte progenitor population, small foci scattered throughout. | |
| Megakaryocytes still present in relatively high numbers. | |
| E17.5 | Erythropoietic activity rapidly declines. |
| Hematopoietic compartment about 30% of liver volume. | |
| Hematopoietic cells scattered individually among hepatocytes. | |
| Small, solitary hematopoietic foci form. | |
| Intravascular RBCs mostly anucleate and more uniform size. | |
| Granulocytes increase in number, scattered throughout, clustered around veins and clustered around periphery. | |
| B lymphocytes increase in number, scattered throughout and within perivascular aggregates. | |
| Megakaryocytes decreased in number. | |
| E18.5 | Hematopoiesis continues to decline. |
| Small, solitary hematopoietic foci. | |
| Hematopoietic cells move to periportal spaces. | |
| Granulocyte progenitors decrease in numbers but still found scattered throughout and in small foci around central veins and adjacent to interlobar spaces. | |
| Postnatal. | First week: same as E18.5. |
| End of first week: discrete foci of hematopoietic cells progressing along a single differentiation pathway. | |
| Small foci remain in liver until 2 weeks after birth. | |
| Hematopoietic cells can be found surrounding a central macrophage. | |
| Megakaryocytes seen as isolated cells surrounded by hepatocytes. |
Ages are approximate.
Hepatic Induction and Early Liver Development
Initial studies investigating mechanisms of liver development involved determination of the tissue interactions necessary for liver induction. Using grafts of quail tissue placed into donor chick embryos at different stages, Nicole Le Douarin demonstrated that the induction of vertebrate hepatogenesis occurs in two stages (Le Douarin 1975). The first stage occurs between the 5-7 somite stage (approximately E8.0 in the mouse) and results in endoderm specification to a hepatic fate (Figure 1) (Kaufman and Bard 1999). Tissue culture studies reveal that the ventral endoderm must be in close contact with precardiac mesoderm to develop into hepatic tissue (Le Douarin 1975; Fukuda 1979; Fukuda-Taira 1981). During development, this interaction becomes possible after the invagination of the foregut, which places the ventral wall of the endoderm in proximity to the developing heart (located rostrally at this stage of development). This cardio-hepatic interaction is necessary for hepatic differentiation, though not sufficient. Additional grafting experiments have revealed a second stage of hepatic induction (20-22 somite stage; approximately E9.5 in the mouse), which is also required for the differentiation of hepatic tissue and involves the septum transversum mesenchyme (STM, the cranial mesenchyme that gives rise to parts of the thoracic diaphragm and the ventral mesentery of the foregut) (Le Douarin 1975, 1968). This second inductive stimulus can be provided not only by STM, but by any lateral plate mesenchyme. Lateral plate mesenchyme gives rise to the circulatory system, viscera, heart, and body wall. However, nonlateral plate mesenchyme cannot provide these inductive signals (Le Douarin 1975). Later studies identified bone morphogenetic protein 4 (BMP4) as the factor from the STM responsible for conversion of hepatoblasts in the ventral endoderm to hepatocytes. In fact, mice lacking BMP4 fail to develop a liver bud (Rossi et al. 2001).
FIGURE 1.

Cell lineage allocation during hepatobiliary development. Schematic representation of the steps involved in endoderm specification to gallbladder and hepatic fates. The liver bud is derived from the caudal foregut endoderm. The liver bud is composed of a cranial and caudal lobe (though these are not distinguishable histologically). The cranial lobe gives rise to hepatoblasts, which subsequently differentiate into either hepatocytes or biliary epithelial cells. Biliary epithelial cells can become part of either the extra- or intrahepatic biliary systems. The caudal lobe gives rise to the gallbladder as well as to some biliary epithelial cells.
Using reverse-transcription polymerase chain reaction techniques, the key inductive events controlling liver development have been demonstrated using a mouse model system (Gualdi et al. 1996). These studies confirmed that ventral endoderm was required to be in close contact with pre-cardiac mesoderm. Gualdi et al. (1996) detected albumin mRNA expression in the ventral foregut at a stage immediately following initial liver induction (7-8 somites or approximately E8.0). This established albumin mRNA as an early marker for hepatic specification. Consistent with Le Douarin’s findings, endoderm without exposure to cardiogenic mesoderm did not express albumin mRNA, whereas endoderm that had come in close contact with cardiogenic mesoderm did express albumin mRNA. In additional studies, Jung et al. found that fibroblast growth factors 1 and 2 (FGF1 or FGF2) can substitute for the cardiac signal, inducing hepatic gene expression in mouse ventral foregut endoderm (Jung et al. 1999). These studies suggest that FGFs are the signal being received from the pre-cardiac mesoderm. Furthermore, FGF antagonists blocked albumin mRNA expression in ventral endoderm cocultured with cardiac mesoderm, indicating that FGF induces albumin mRNA expression (Jung et al. 1999). In addition to FGF1, FGF2, and BMP4, molecules in the Wnt cell signaling pathway and several transcription factors (Hex, Gata6, and Prox1) have also been shown to be important for hepatogenesis (Keng et al. 2000; Martinez Barbera et al. 2000; Sosa-Pineda, Wigle, and Oliver 2000; Zhao et al. 2005).
In addition to growth factor and transcription factor interactions, interaction of the endodermal cells of the hepatic bud with endothelial cells is also critical for proper liver development. When liver development begins and hepatic cords invade the septum transversum, the liver bud endoderm intersperses with the endothelial cells of simple continuous vessels. As hepatic development proceeds, the architecture of the vessels changes, becoming fenestrated and forming a sheet that lines the hepatic sinusoids (Duncan 2003). Because of this close association with hepatoblasts and endothelial cells throughout liver development, a role for endothelial cells in hepatic development was investigated (Matsumoto et al. 2001). Matsumoto and colleagues (2001) utilized a knockout model (Flk-1 -/- mice) in which the engineered ablation of Flk-1, the receptor for vascular endothelial growth factor (VEGF), prevented the formation of mature endothelial cells and blood vessels (Shalaby et al. 1997, 1995). In normal animals, an endothelial marker (PECAM) can detect the presence of endothelial cells lying between the developing liver bud and the septum transversum. However, in the Flk-1 knockout animals, these endothelial cells are not present. Analysis of the Flk-1 -/- animals showed that in the absence of endothelial cells, liver organogenesis failed shortly after hepatic specification, as there was no expansion of the bud or invasion of the hepatoblasts into the surrounding septum transversum (Matsumoto et al. 2001). Since the Flk-1 receptor is expressed in endothelial cells but not in the developing liver endoderm or septum transversum, this study demonstrates that the hepatoblast-endothelial cell interaction is critical for hepatogenesis to proceed normally (Matsumoto et al. 2001).
Overview of Embryonic Liver Venous Drainage
Early in development, the venous drainage of the embryo consists of three paired veins: (1) the umbilical veins from the chorion that carry oxygenated blood from the placenta to the embryo; (2) the vitelline veins from the yolk sac that drain the gastrointestinal tract and its derivatives; and (3) the cardinal veins from the body of the embryo which drain the head, neck, and body wall of the embryo (Figure 2A). All of these veins initially open to the right and left horns of the sinus venosus of the heart (Figure 2A). Further development of the hepatic venous system is a result of changes occurring to these three venous systems. Prior to E9.0-E9.5, before the development of the septum transversum and liver at the foregut-midgut junction, the primitive gut is primarily drained by the vitelline veins (Kaufman 1999; Figure 2A). As early as E8.5-E9.0, right and left vitelline plexuses develop in the septum transversum and connect to the vitelline veins (Figure 2B). The vessels of the plexuses then become surrounded by the growing liver cords and contribute to the formation of the hepatic sinusoids (Figure 2C). At this same age, the left umbilical vein drains the left side of the liver and, with the growth of the liver, will become the ductus venosus (Figure 2D).
FIGURE 2.

Development of venous drainage within the liver. Prior to development of the septum transversum and liver, the vitelline veins drain the primitive gut. The umbilical veins carry oxygenated blood from the placenta and run on the lateral sides of the vitelline veins (A). Later in development, the liver bud can be seen developing at the foregut-midgut junction (B). As the liver grows, changes to the vascular system occur. The vitelline veins enter and ramify within the septum transversum, forming the hepatic sinusoids. The two umbilical veins give rise to both an intra- and extrahepatic branch (C). The extrahepatic branches of the umbilical vein regress, along with extrahepatic portion of the left vitelline vein (D). The right intra-hepatic vitelline vein becomes the portal vein, which aids in venous drainage of the gut. The umbilical vein from the left side forms a wide channel known as the ductus venosus, which allows oxygenated blood from the placenta to bypass the liver and move directly into the right atrium through a posthepatic portion of the developing caudal vena cava (E). Adapted with permission from Kaufman and Bard (1999, 148, Figure 4.4.9), copyright Elsevier (1999); and from Langman and Sandler (2006, 248, Figures 11.41 and 11.42), copyright Lippincott Williams & Wilkins (2006). CCV = common cardinal vein; DUOD = duodenum; DV = ductus venosus; LUV = left umbilical vein; LVV = left vitelline vein; PHCVC = posthepatic caudal vena cava; PV = portal vein; REHB = right extrahepatic branch; RIHB = right intrahepatic branch; RUV = right umbilical vein; RVV = right vitelline vein; STM = septum transversum mesenchyme; SV = sinus venosus.
At E11.5, significant changes occur in the vascular system, primarily due to developmental events related to the liver. The two vitelline veins enter and branch within the septum transversum, forming hepatic sinusoids (Figure 2C). The two umbilical veins each give rise to intra- and extrahepatic branches (Figure 2C). The extrahepatic branch is subsequently lost (Figure 2D). The right vitelline vein (which will become the portal vein) grows in diameter, and the cranial portion of the vein (between the liver and the heart) becomes the primitive caudal vena cava (Kaufman and Bard 1999; Figure 2E). The only retained branch from the umbilical system is from the left side (Figure 2E). The left umbilical vein loses its original connection with the left sinus horn of the heart and forms the ductus venosus (Figure 2E). The ductus venosus drains into the caudal vena cava and then into the right atrium (Kaufman 1999). Blood flow into the ductus venosus allows oxygenated blood from the placenta to bypass the liver and move directly into the right atrium through a posthepatic portion of the developing caudal vena cava (Kaufman 1999). Shortly after birth, the ductus venosus constricts, eliminating this venous shunt through the liver. It subsequently forms a fibrous cord called the ligamentum venosum (Kaufman 1999).
Overview of Embryonic Liver Hematopoiesis
In the mouse, primitive hematopoiesis (the first phase of blood cell production) begins approximately 7.0 days after conception within blood islands, which are located in the visceral yolk sac (Zon 2001). These primitive hematopoietic cells enter the bloodstream, and continue to mature while in circulation (Zon 2001). Around E10.5 to E11.5, although perhaps as early as E9.0 (Everds 2007) to E10.0 (Naito, Takahashi, and Nishikawa 1990), definitive hematopoiesis (the second phase of blood cell production) is launched when progenitor cells from the aorta-mesonephros-gonad region leave the bloodstream and enter multiple secondary sites to occupy niches suitable for the expansion of hematopoietic stem cells. The main sites, depending on cell lineage, are the liver, thymus, and spleen; the liver is thought to be the first location to be colonized, apparently because it shares many molecular and functional similarities with yolk sac (Meehan et al. 1984; Palis and Kingsley 1995), and it serves as one source for hematopoietic stem cells that eventually reach the thymus and spleen. At E11.5, the liver then takes over as the major source of hematopoietic cells during gestation (Sasaki and Matsumura 1986). It is generally believed that the liver does not generate hematopoietic cells de novo but that the liver is colonized by hematopoietic stem cells, which expand and mature within the developing liver (Zon 2001). Recent studies have shown that the fetal liver provides a developmental niche for the maturation and enucleation of primitive erythroid cells (Isern et al. 2008). When primitive erythroid cells migrate to the fetal liver, they have a dramatic up-regulation of adhesion molecules that allows them to bind to fetal liver macrophages (Isern et al. 2008). Though they are not always visible with H&E staining, scanning electron microscopy studies have shown that macrophages have extensions that surround the erythroblasts, allowing them to function as nurse cells during erythropoiesis and to engulf the expelled erythrocytic nuclei (Chasis 2006; Isern et al. 2008). The ability of the primitive erythroid cells to bind macrophages is maximal at the time when their enucleation takes place, after which the ability to bind macrophages is lost (Isern et al. 2008).
Hematopoiesis in the mouse liver has been divided into four discrete stages (Sasaki and Sonoda 2000). Stage I describes the very early onset of hematopoiesis, which occurs at E10.5. The expansion in volume of hematopoietic cells occurring between E11.0 and E12.0 is described as stage II. It is between stages I and II that hematopoietic stem cells appear to move from the sinusoidal lumens, through the sinusoidal endothelium, forming colonies among hepatoblasts within primitive hepatic cell cords. Stage III represents the peak volume of the hematopoietic compartment of the liver, which occurs between E13.0 and E14.0 in the mouse. At stage III, the hematopoietic colonies form the structural units of ellipsoidal foci with central macrophages surrounded by a ring of erythroblastic cells, eventually forming cords (Sasaki et al. 1993). E15.0 represents the onset of stage IV when the cord-shaped hematopoietic foci become disrupted and round, solitary foci of hematopoietic cells form within the hepatic cell cords. It is during stage IV that the size of the hematopoietic compartment declines and hepatocytes return to being in close contact with one another, though hematopoiesis in the liver continues until about one week into postnatal life.
The first hematopoietic stem cells to enter the liver are pluripotent and can form any hematopoietic cell. Their first step in intrahepatic maturation is to commit to a more limited range of lineage options, typically as either an erythromyeloid precursor or a common myelolymphoid progenitor (Kawamoto, Ohmura, Hattori, et al. 1997; Lacaud, Carlsson, and Keller 1998; Lu et al. 2002). Liver-derived myelolymphoid progenitors subsequently develop into bipotent cells (B lymphocyte and myeloid, or T lymphocyte and myeloid) before committing to produce a single cell lineage (Kawamoto, Ohmura, Katsura 1997). Some T lymphocyte progenitors have a bipotent commitment to the NK cell lineage as well (Douagi et al. 2002). The T lymphocyte precursors destined for transfer to the thymus are produced even in athymic mice (Kawamoto et al. 1999; Kawamoto, Ohmura, Hattori, et al. 1997), indicating that the fetal liver may play a role in promoting early T lymphocyte differentiation prior to releasing any precursor cells to the thymus and bone marrow (Watanabe, Aiba, and Katsura 1997).
Erythropoiesis predominates within the developing liver, though cells of the granulocyte and lymphoid lineages can also be identified. Beyond E11.5, erythroid cells become increasingly more differentiated. However, the progression of cells through the erythroid series is not obvious within H&E-stained tissues. The different stages of erythrocyte maturation in the developing liver have been described using transmission electron microscopy (Rifkind, Chui, and Epler 1969). Changes in the lymphoid cell population also occur as gestation proceeds. T lymphocytes are the primary lymphoid cell progenitor present at E12.5 and then decline in number as development proceeds. By E14.5, the lymphoid population in the liver has switched and now primarily consists of B lymphocyte progenitors. However, the distinctions between lymphoid progenitors are also not obvious with H&E-stained tissues and have primarily been characterized using fetal liver cells cultured in the presence of a cytokine cocktail that supports the growth of B cells, or by using flow cytometry on labeled fetal liver cells (Gunji et al. 1991; Kawamoto et al. 2000). The granulocyte population within the liver changes throughout development as well. Granulocyte progenitors can be found in low numbers scattered throughout the liver parenchyma between E12.5 and E15.5. Beginning at E16.5, in addition to being scattered throughout the liver, granulocyte progenitors can be found clustered in small foci throughout of the liver. These foci get larger as development proceeds.
Late in development, the sites of hematopoiesis shifts from the liver to the thymus (about E13, for T lymphocytes only); spleen (approximately E15 to E15.5, for erythroid and myelolymphoid precursors); and finally bone marrow (E16.0) (Rugh 1990; Speck, Peeters, and Dzierzak 2002), which is the definitive site where hematopoietic stem cells and progenitors of the adult hematopoietic system reside (Kikuchi and Kondo 2006; Rifkind, Chui, and Epler 1969). The hematopoietic stem cells seeding the bone marrow come from secondary sites like the liver and spleen as the aorta-mesonephros-gonad has regressed by this stage of development.
Materials and Methods
Animals
CD-1® IGS mice/Crl:CD1(ICR) timed pregnant dams (Charles River Laboratories, Raleigh, NC, USA) were used. All animal procedures used in this study were approved by the National Institute of Environmental Health Sciences Animal Care and Use Committee.
Staging
The morning on which the vaginal plug was found was designated as E0.5 (in the literature also described as 0.5 days postconception [dpc]). Since considerable variation occurs in the timing of ovulation and conception and in the developmental status of individual embryos and fetuses, even within the same litter, special care was taken to match both the external and internal features of each embryo/fetus to the known developmental landmarks (Kaufman 1999). Corresponding Theiler stages (TS), another staging system widely used for mouse embryos/fetuses (Theiler 1972, 1989), are also presented.
Collection of the Conceptuses
Collection was carried out on the mornings of the designated days (E9.5 to E18.5). Pregnant mice were euthanized by carbon dioxide. Individual embryos were isolated under the dissection microscope from the uterus and extra-embryonic membranes while immersed in cold 0.1M phosphate buffered saline, and then transferred to Bouin’s solution (Poly Scientific, Bay Shore, IL, USA) or 10% neutral buffered formalin for fixation.
Fixation
Embryos were fixed in Bouin’s or 10% neutral buffered formalin. Tissue fixed in 10% formalin was used for immunohistochemistry. Fixation time was dependent upon the gestational age: E9.5 to E11.5-2 hr, E12.5 to E16.5-4 hr, and E17.5 to E18.5-72 hr. Following fixation with Bouin’s solution, embryos were rinsed in 70% ethanol saturated with lithium carbonate (Sigma-Aldrich, St. Louis, MO, USA) for three 30-min washes, and then processed for paraffin embedding. Embryos younger than E13.5 were embedded in 1% agar before submission to minimize handling while orienting for paraffin embedding. For each time point, embryos were embedded on their backs, sides, or heads for sectioning in the respective frontal (coronal), sagittal (longitudinal), or transverse (horizontal) plane. Serial 6-μm-thick sections through the entire embryo were placed on charged slides (A. Daigger & Company, Vernon Hills, IL, USA) and routinely stained with H&E for histopathologic review.
Scanning
Digital images were prepared from H&E-stained slides scanned on the Aperio ScanScope XT™ instrument (Vista, CA, USA) using ImageScope™ software (v9.0, Aperio). If a digitally scanned image required rotation, the selected region of interest was captured using the extraction feature in Image-Scope™. White balance correction and image resizing were completed using Adobe Photoshop CS4 Extended (Adobe Systems Incorporated, San Jose, CA, USA). Image resolution was set at 300 dpi to fit the publisher’s requirements.
Immunohistochemistry
Indirect immunohistochemical staining was performed on formalin-fixed, paraffin-embedded embryos using the avidin-biotin peroxidase technique. The tissues were deparaffinized in xylene and rehydrated through a graded series of ethanol. Endogenous peroxidase was blocked by immersing slides in 3% H2O2 for 15 min. A summary of the immunohistochemistry protocols is provided in Table 5. Detailed protocols are provided on the NIEHS Immunohistochemistry Web site (http://www.niehs.nih.gov/research/atniehs/labs/lep/path-support/immuno/protocols.cfm).
TABLE 5.
Immunohistochemical stain summary.
| Cell | Macrophage | Biliary epithelium | B-lymphocyte | Granulocyte |
|---|---|---|---|---|
| Antibody | F4/80 | CK19 | Pax5 | Myeloperoxidase |
| Cell type marker | Macrophage | Biliary epithelium | B cells | Myeloid cells |
| Primary antibody | Rabbit anti-F4/80 (BM8)a | Rabbit anti-CK19d | Goat Polyclonal Pax-5 (C-20)a | Rabbit Polyclonal anti-Human Myeloperoxidaseg |
| Dilution | (1:25) | (1:300) | (1:100) | (1:300) |
| Negative control | Purified Mouse IgG2a Isotypeb | Normal rabbit serume | Normal goat serume | Normal rabbit serume |
| Secondary antibody | Biotinylated rabbit anti-rat IgG (H+L)c | Vector Standard Elite ABC Kitc | Biotinylated horse anti-goatc | Vector Standard Elite ABC Kitc |
| Label | Vector Standard Elite ABC Kitc | Vector Standard Elite ABC Kitc | Peroxidase-conjugated streptavidin SS Labelf | Vector Standard Elite ABC Kitc |
Santa Cruz Biotechnology, Santa Cruz, CA.
BD Biosciences, San Jose, CA.
Vector Laboratories, Burlingame, CA.
Cell Marque Corporation, Rocklin, CA.
Jackson Immunresearch, West Grove, PA.
Biogenex Laboratories, San Ramon, CA.
Dakocytomation Corporation, Carpinteria, CA.
Results
Early Hepatic Development (E9.5-E10.5)
By embryonic day 8.0, the ventral wall of the foregut is positioned adjacent to the developing heart, from which it receives various cell signals to induce the development of hepatic tissue. Histologically, liver development begins around E9.0-E9.5 as a diverticulum of proliferating endodermal cells arising from the ventral surface of the foregut (Duncan 2003). At the same time, the vitelline veins (omphalomesenteric vessels) are forming a venous plexus within the septum transversum (Kaufman and Bard 1999). The outgrowth of the liver is tightly regulated by endodermal-mesenchymal interactions between the budding ventral endoderm and the cardiogenic and septum transversum mesenchymes (Margagliotti et al. 2007), as described above.
Hepatoblasts derived from the endoderm (liver “bud” or “diverticulum”) intermingle with loose mesenchymal cells of the septum transversum and endothelial cells to form hepatocellular cords (Figures 3A and 3B). The interaction of these cell types triggers proliferation and outgrowth of the hepatic bud. As development continues (E9.5-E10.0), the liver bud separates into cranial and caudal lobes (Shiojiri 1997), though the boundary between these is not histologically obvious in the mouse (Clotman et al. 2002). It is believed that the cranial lobe gives rise primarily to the liver parenchyma and intrahepatic bile ducts, as well as contributing to the extrahepatic bile ducts, whereas the caudal lobe gives rise to the extrahepatic biliary system (gallbladder and extrahepatic bile ducts; Figure 1). However, this distinction is not completely clear since lineage tracing studies have not been performed for the hepatic bud (Shiojiri 1997).
FIGURE 3.
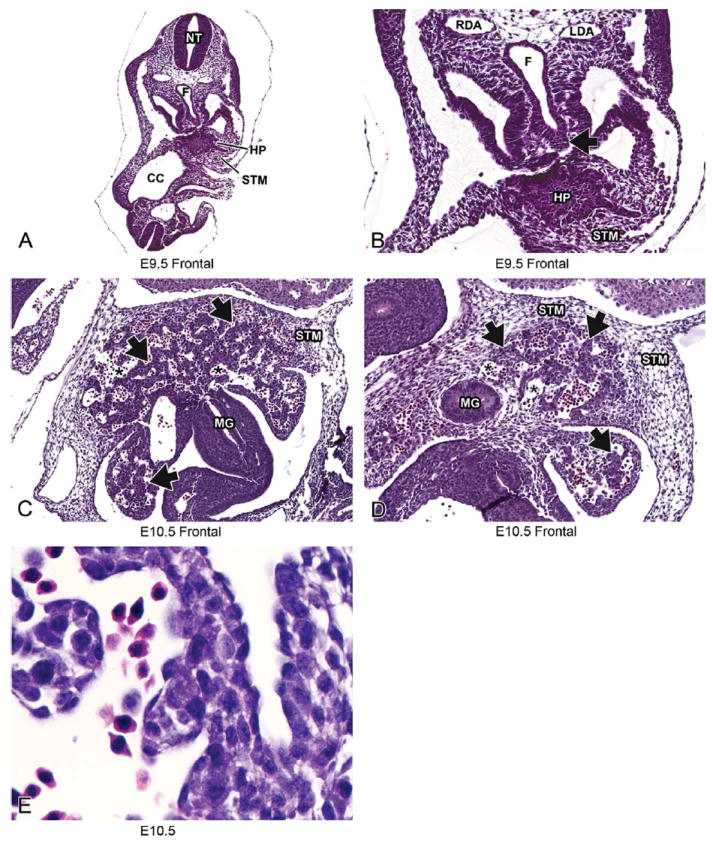
Representative images of E9.5 and E10.5 embryonic mouse liver. Low-magnification H&E-stained frontal sections at E9.5 (A, B) and E10.5 (C, D). High magnification at E10.5 (E). Histologically, liver development begins around E9.5 as a diverticulum of proliferating endodermal cells arising from the ventral surface of the caudal foregut (A, B, arrow). By E10.5 (C, D), the epithelial sheets of the liver bud have undergone elongation and branching to form hepatic cords (arrows) separated by blood-filled sinusoids (asterisks). The hepatic cords delaminate from the foregut and move into the septum transversum mesenchyme at this stage. At high magnification, clear vacuoles can be seen within the hepatoblast cytoplasm and nucleated red blood cells can be seen within the sinusoids (E). CC = coelomic cavity; F = foregut; HP= hepatic primordium; LDA = left dorsal aorta; MG = midgut; NT = neural tube; RDA = right dorsal aorta; STM = septum transversum mesenchyme.
During the initial stages of development, the liver bud is separated from the STM by a basement membrane (Duncan 2003). At E9.0 the hepatic diverticulum is characterized by a solid sheet of epithelial cells (Figure 3A and 3B). By E10.0-E10.5 these epithelial sheets have undergone extensive elongation and branching to form the hepatic cords (Suzuki et al. 2006) (Figure 3C). The basement membrane is disrupted by the invasion of the hepatic cords delaminating from the foregut and moving into the STM beginning around E10.0-E10.5 (Le Douarin 1975; Medlock and Haar 1983; Figure 3D). The STM contributes fibroblasts and stellate cells (also called pericytes or Ito cells) to the liver. Although no lineage-tracing studies have been performed, hepatoblasts are believed to give rise to both cell types that compose the main functional elements of the mature liver: hepatocytes and biliary epithelial cells (Duncan 2003). As the hepatoblasts migrate into the STM and form hepatic cords, they are closely associated with endothelial cells that are a part of the existing venous plexus formed by the vitelline veins. These endothelial cells form capillary-like sinusoids between the invading hepatic cords (Duncan 2003; Enzan et al. 1997; Medlock and Haar 1983). These sinusoids can be seen throughout the liver at this early stage of development (Figure 3C and 3D) and comprise a much larger volume of the liver than they will at later developmental stages. At E10.5 the hepatoblasts within the hepatic cords contain large numbers of clear cytoplasmic vacuoles; the nature of these vacuoles has not yet been determined (Figure 3E) (Rifkind, Chui, and Epler 1969).
At E10.5, three roughly concentric zones of divergent cellular morphology have been described for the liver and surrounding mesenchyme. These three zones include (1) the outermost zone of residual mesenchyme of the septum transversum adjacent to the cranial aspect of the liver, (2) a region of hepatic peripheral endodermal epithelial tissue at the margins of both the cranial and caudal lobes, and (3) a central “hepatic” zone containing the most advanced stages of hepatocellular differentiation (Rifkind, Chui, and Epler 1969). Moving from the outermost zone of residual mesenchyme inward, these zones correspond to progressively more developed stages in the morphogenesis of the definitive (“adult”) hepatic architecture (Rifkind, Chui, and Epler 1969).
Abnormal Development
A block in liver development can occur at the earliest stages of hepatogenesis. The molecular mechanisms responsible for the delamination and migration of the hepatic cords into the STM are not clearly defined. However, inactivation of several different factors by engineered mutations in certain Hox genes (Martinez Barbera et al. 2000; Sosa-Pineda, Wigle, and Oliver 2000) and GTPases (Suzuki et al. 2006) has led to a halt in liver development prior to E10.5, thereby preventing the expansion of the initial liver diverticulum and inhibiting delamination of hepatoblasts from the foregut endoderm into the STM (Zhao and Duncan 2005). In some of these models, the hepatic cords fail to form, and liver precursor cells remain abnormally clustered at the edges of the hepatic diverticulum (Sosa-Pineda, Wigle, and Oliver 2000; Suzuki et al. 2006). In all of these models, the initial step of specification of the foregut endoderm to become liver occurs normally, but migration of the liver diverticulum into the STM fails, resulting in no discernable liver formation or the generation of aberrant liver lobes devoid of hepatoblasts. These studies suggest that migration of hepatoblasts into the STM provides important developmental cues required for normal hepatic outgrowth and architecture (Zhao and Duncan 2005).
Hepatic Development in Mid- to Late Gestation (E11.5-E18.5)
E11.5 (TS19)
The size of the liver expands considerably between E10.5 and E11.5 and soon occupies a substantial portion of the cranial half of the abdominal cavity (Figures 4A-4C) (Kaufman and Bard 1999).
FIGURE 4.

Representative images of the E11.5 embryonic mouse liver. H&E-stained frontal (A), transverse (B), and sagittal (C) sections of liver at low magnification. High-magnification H&E (D, E) and F4/80 IHC (F) sections. The size of the liver has expanded to occupy a substantial portion of the cranial half of the abdominal cavity (A, B). This expansion is due to the rapid proliferation of hepatoblasts and hematopoietic activity (C). High magnification illustrates that the liver is mostly composed of hepatic cords (D, arrows) and sinusoids (D, asterisk) at this stage in development. The hepatic cords are composed of primarily largely undifferentiated hepatoblasts (E, white arrow). Significant expansion in size and the onset of hematopoietic activity account for the high mitotic index in the liver at this stage (E, double arrows). All RBCs found within the vessels are nucleated (E, arrowhead). Endothelial cells can be seen lining vascular spaces (E, black arrows). Macrophages can be easily identified by IHC using the antibody F4/80 (F). AO = aorta; DUOD = duodenum; DV = ductus venosus; HRT = heart; LVP = liver parenchyma; PHCVC = post-hepatic caudal vena cava; STM = septum transversum mesenchyme.
The enlargement that occurs at this stage of liver development is chiefly due to rapid proliferation of hepatoblasts and a substantial increase in intrahepatic hematopoietic activity (Figure 4D). As a result, the mitotic index of the liver is high with greater than ten mitotic figures per high power field (Figure 4E). By approximately E11.5 to E12.5 (Rugh 1990), the liver replaces the visceral yolk sac as the main source of hematopoietic cells in the developing conceptus (Sasaki and Matsumura 1986).
At E11.5, the liver primarily consists of hepatic cords (composed of hepatoblasts) and endothelial-lined liver sinusoids. Hepatic cords are present in layers with a typical thickness of 2 to 5 cells (Figure 4D). The cords contain undifferentiated hepatoblasts characterized by large, basophilic nuclei and multiple nucleoli (Figure 4E); these cells are very tightly packed, making it difficult to appreciate individual cell shape. There is a high degree of variation in the size and shape of hepatoblast nuclei at this stage as well. The large, numerous sinusoids are lined with flattened endothelial cells (Figure 4E). While the sinusoids are wide at this stage, they will eventually become narrow as the relative amount of liver parenchyma (hepatoblast-laden hepatic cords) increases.
Most hematopoietic cells present at this middle stage of development are nucleated cells of the erythroid lineage (Figure 4E) (Sasaki and Matsumura 1986). Previous studies have quantified the intrahepatic hematopoietic compartment at E11.0 to be 34% of the liver volume (Sasaki and Sonoda 2000). Nearly 80% of these erythroid precursors are very immature (proerythroblasts; Marks and Rifkind 1972). That said, the primitive hepatic cords contain immature erythropoietic cells, mostly nucleated red blood cells (RBCs), scattered among the hepatoblasts (Sasaki and Matsumura 1986; Figure 4E). Nucleated RBCs and occasional macrophages can be observed within the sinusoids at this developmental stage (Sasaki and Iwatsuki 1997; Naito, Hasegawa, and Takahashi 1997). Since macrophages are difficult to identify using H&E staining, their identification is best accomplished using F4/80 immunohistochemistry (Figure 4F). These macrophages are important for breakdown of RBC nuclei later in the hematopoietic process. Granulocyte progenitors are rarely seen in the liver at E11.5 (data not shown).
At E11.5 significant changes occur in the intra- and perihepatic vascular system, as a result of continued liver development. The two vitelline veins enter and branch within the septum transversum, forming hepatic sinusoids. At this stage the left umbilical vein loses its original connection with the left sinus horn of the heart and evolves to form the ductus venosus (Figure 4A). The ductus venosus drains into the caudal vena cava and then into the right atrium (Kaufman 1999). Both the ductus venosus and the caudal vena cava can be observed at E11.5 in all planes of section, though not always together within the same histologic section (Figures 4B and 4C). Frontal sections are ideal for identifying these vessels at E11.5; however, transverse and sagittal views are included for reference in situations where frontal sections are not available. Sagittal sections (at all developmental stages) generally best illustrate the post-hepatic caudal vena cava entering the liver (Figure 4C).
E12.5 (TS21)
By E12.5, the liver occupies an even more substantial portion of the abdominal cavity. The liver sits just caudal to the diaphragm and forms a triangular or U-shaped covering over portions of the stomach, duodenum, and pancreas (Figures 5A and 5B). Because of the size, shape, and lobation of the liver, transverse and frontal sections at different levels (cranially vs. caudally in the transverse plane and dorsally vs. ventrally in the frontal plane) will include different portions of these visceral organs as well as various intrahepatic vessels. For example, this is demonstrated by comparing Figures 5B through 5D, which were taken at different levels transversely through the liver at E12.5. Figure 5C was taken fairly cranially through the liver, at a point where the liver is not yet covering any visceral organs. Figure 5D shows an area where the liver is covering portions of the small intestine but does not yet envelop stomach or pancreas. Figure 5B is the most caudal of the three sections and includes a portion of the stomach, small intestine, and pancreas. This comparison illustrates the importance of evaluating a subset of serial sections (i.e., step sections) through the liver when phenotyping embryonic development of this organ.
FIGURE 5.

Representative images of the E12.5 embryonic mouse liver. H&E-stained frontal (A) and transverse (B, C, D) sections of liver at low magnification. High-magnification H&E (E) and Pax5 IHC (F) sections. The density of the liver has increased and division of the liver into lobes via fissures has begun, forming interlobular spaces (A–D). The venous sinusoids appear less numerous due to the increase in functional hepatic parenchyma (A, asterisk). Hematopoietic activity has increased and erythroblasts (E, black arrow) now dominate the field. The majority of the hematopoietic cell population at this developmental stage is of the erythroid lineage and can be identified by the intense, hyperchromatic nuclei. In contrast, hepatoblasts have a larger, pale staining nucleus, with 2-3 distinct nucleoli (E, white arrow). RBCs found within the vessels are still all nucleated at this stage (E, arrowhead). B-cell progenitors are scarce as identified by the Pax5 antibody (F, arrow). AO = aorta; CBD = common bile duct; CdRL = caudal right lobe of liver; CrRL = cranial right lobe of liver; D = diaphragm; DUOD = duodenum; DV = ductus venosus; E = esophagus; HRT = heart; ILS = interlobar space; LL = left lobe; LNG = lung; LVP = liver parenchyma; PHCVC = posthepatic caudal vena cava; PNCR = pancreas; PV = portal vein; S = stomach; SI = small intestine.
At E12.5, the venous sinusoids appear less numerous due to the increase in functional hepatic parenchyma (Kaufman 1999). As this occurs, the liver appears much more cellular than it did at E11.5. Between E12.0-E14.0, stellate (Ito) cells are located in the perisinusoidal space (Enzan et al. 1997). These fat-storing cells are not visible by routine H&E histology but have been characterized using electron microscopy (Enzan et al. 1997). The cytoplasmic processes of the Ito cells extend laterally and appear to play a role in reinforcing the endothelial lining (Enzan et al. 1997). The peripheral boundaries of the liver are now more well defined, and its subdivision into definitive lobes has begun (Figure 5A) (Kaufman and Bard 1999). The lobes are divided by fissures known as interlobar spaces (Figure 5A). The right half of the liver is slightly greater in volume than the left half of the liver. The stomach serves as a helpful landmark in histologic sections to distinguish the right and left liver lobes on frontal and transverse sections, as it is located on the left side of the embryo below the left lobe of the liver (Figures 5A and 5B). At E12.5, the post-hepatic caudal vena cava can be seen as it exits the liver (Figure 5C). The ductus venosus can still be observed draining into the post-hepatic caudal vena cava (Figures 5C and 5D). The right vitelline vein has now become the portal vein, which contributes to the venous drainage of the gut (Kaufman and Bard 1999). The portal vein can be observed at E12.5, between the developing liver and pancreas (Figure 5B).
Erythropoietic cells have increased in number and show a greater degree of variation in cell maturation than during the previous stage (Figure 5E) (Sasaki and Sonoda 2000). Previous work suggests that at E12.0 the hematopoietic compartment of the liver accounts for approximately 68% of the hepatic mass (Sasaki and Sonoda 2000). The majority of the hematopoietic cell population at this developmental stage is erythroid lineage and can be identified by the intense, hyperchromatic nuclei; in contrast, hepatoblasts have a larger, pale staining nucleus, with two to three distinct nucleoli (Figure 5E) (Asano, Kobayashi, and Hoshino 1987). Beyond E11.0, erythroid cells become increasingly more differentiated (Cole and Paul 1966; Marks and Rifkind 1972; Rifkind, Chui, and Epler 1969). At this stage in development, granulocyte progenitors are rarely seen in the liver. At E12.0, most intrahepatic lymphoid cells are T cell progenitors; the frequency of this lineage decreases with the embryonic age of the animal as lymphoid development is shifted to the thymus (about E13) and spleen (about E15) (Gunji et al. 1991; Kawamoto et al. 2000; D. Li et al. 2004; Rugh 1990; Speck, Peeters, and Dzierzak 2002). Alternatively, B cell progenitors are rare at E12.0 (Figure 5F) (D. Li et al. 2004).
Abnormal Development
One of the most common hepatic defects observed in genetically modified mice is hypocellularity beginning around E12.5-E13.5. The primary mechanism typically represents an increase in hepatoblast apoptosis resulting from disruption of intracellular signal transduction required for cell differentiation and proliferation (Hilberg et al. 1993; Johnson et al. 1997; Z. Li et al. 1999; Mikula et al. 2001; Nishina et al. 1999; Schmidt et al. 1995; Stenvers et al. 2003). Histological examination (H&E) of the remaining hepatoblasts in these animals reveals pyknotic, hyperchromatic, and fragmented nuclei. Apoptosis of hepatoblasts during development has been observed in various patterns, including apoptotic foci (Stenvers et al. 2003); more severe apoptosis on the ventral liver surface (Schmidt et al. 1995); apoptosis beginning in the distal, outermost portions of the hepatic lobes (Johnson et al. 1997); and apoptosis uniformly throughout (Z. Li et al. 1999). One study illustrated an increase in hepatoblast apoptosis due to an inactivating mutation in the gene encoding the mitogen-activated protein kinase activator SEK1. This molecule is activated in response to developmental and environmental cues including metabolic poisons, irradiation, anticancer drugs, and cellular stress (Nishina et al. 1999). This response suggests that environmental agents that influence stress-signaling kinases could lead to apoptosis of hepatocytes and developmental defects in the liver.
Increased apoptosis is just one mechanism by which hypocellularity can occur in the developing liver. Hepatic hypocellularity with a 75%decrease in hepatoblast number in the absence of apoptosis has been attributed to a decrease in mitosis and diminished proliferation of hepatoblasts (Krupczak-Hollis et al. 2004). Histologically, this phenotype results in hepatocytes with enlarged, polypoid nuclei.
E13.5 (TS22)
The liver parenchyma has grown to occupy an even larger portion of the abdominal cavity by E13.5 (Figures 6A and 6B). The remnant of the ventral hepatic mesentery (falciform ligament), which connects the liver to the ventral body wall, can be seen at E13.5 (Figure 6C). The falciform ligament can be visualized on transverse section through the most cranial portion of the liver beginning at E13.5 and throughout the remainder of development. The division of the liver into distinct lobes begins to be more obvious at this stage. Fissures now divide the liver more definitively into four main lobes: median, right, left, and caudate lobes. The median lobe can be further subdivided by a deep bifurcation into a right and left side. The left lobe is not divided, but the right lobe is divided into right cranial and right caudal lobes (Harada et al. 1999). The caudate lobe projects on either side of the esophagus/stomach (Figure 6A). At E13.5, many interlobar spaces are forming as the division of the liver into its individual lobes occurs (Figure 6A). It is important that these not be mistaken for blood vessels or sinusoids when they are incomplete. Division into lobes is best observed on frontal views; however, not all liver lobes are visible in each section. The ductus venosus, posthepatic caudal vena cava and portal vein can still be observed in sections through the liver at this age (Figures 6A, 6B, 6D). At E13.5, the liver achieves its final mature architecture but continues to grow in size. Changes seen in the liver during the remainder of in utero and postnatal development occur primarily at the cellular level.
FIGURE 6.

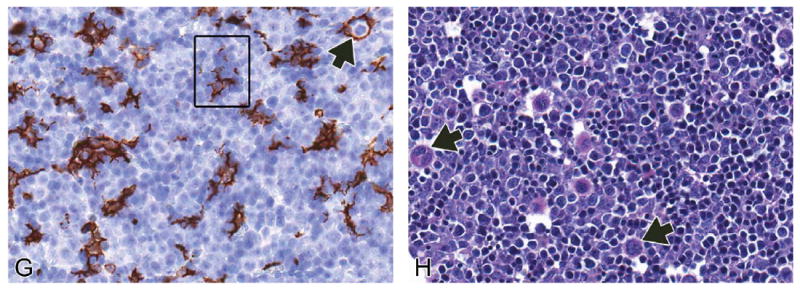
Representative images of the E13.5 embryonic mouse liver. H&E-stained frontal (A), transverse (B, C), and sagittal (D) sections of liver at low magnification. High-magnification H&E (E, F), F4/80 IHC (G) and PAS (H) sections. At E13.5, the liver achieves its final embryonic architecture, although it will continue to grow in size throughout the remainder of development (A–D). The falciform ligament can be seen on transverse section through the most cranial portion of the liver beginning at E13.5 and throughout the remainder of development (C). After this stage, changes seen in the developing liver occur primarily at the cellular level. This stage represents the peak in hematopoietic activity in the liver. At high magnification, the field is dominated by hematopoietic cells (E, arrowhead). Hepatoblasts (E, white arrow) have little contact with each other. The density of hepatoblasts is relatively higher at the periphery of the liver than in the core (F, arrows). Megakaryocytes (E, black arrows) are found in high numbers at this stage of development. Erythroblastic islands are found throughout the liver (F, G, squares). The anatomic unit of an island consists of a central F4/80-positive macrophage surrounded by one or more concentric rings of maturing erythroblasts (G, arrow). PAS stain assists in the identification of megakaryocytes (H, arrows). CD = cystic duct; CdRL = caudal right lobe of liver; CL = caudate lobe of liver; CrRL = cranial right lobe of liver; D = diaphragm; DV = ductus venosus; E = esophagus; FL = falciform ligament; GB = gallbladder; HRT = heart; ILS = interlobar space; K = kidney; LL = left lobe; LML = left medial lobe; LNG = lung; LVP = liver parenchyma; PHCVC = posthepatic caudal vena cava; PNCR = pancreas; PV = portal vein; RML = right medial lobe; S = stomach.
The hematopoietic compartment of the liver reaches nearly 75% of the total volume at E13.0 (Sasaki and Sonoda 2000; Figure 6E). In terms of the lymphoid population, the number of T cell progenitors have decreased while B cell progenitors have increased (D. Li et al. 2004). During the peak stage of hematopoiesis in the liver (E13.5), the hepatoblasts have limited contact area with each other due to the high density of hematopoietic cells present (Figure 6E). Later in development, as hematopoiesis declines (beginning around E15), the hepatoblasts return to being in close contact with one another. While the density of hepatoblasts at E13.5 is low, it is relatively higher at the periphery of the liver than in the core (Figure 6F). Hematopoietic cells dominate the field and are more numerous in the core of the developing liver than the periphery. Between E13.0-E14.0, erythroblastic islands can be found throughout the liver (Figure 6F). An erythroblastic island is an anatomic unit consisting of a macrophage surrounded by one or more concentric rings of maturing erythroblasts. As macrophages within the liver are difficult to distinguish with H&E, these islands are more easily observed using F4/80 immunohistochemistry (Figure 6G). The function of the central macrophage is to phagocytize extruded erythroblast nuclei at the conclusion of terminal erythrocyte differentiation (Chasis 2006; Kawane et al. 2001). Granulocyte progenitors can also be found in low numbers scattered throughout the liver. Megakaryocytes, which produce platelets, are found in increasingly high numbers throughout the liver parenchyma at this age (Figure 6E). Megakaryocytes can be easily identified using PAS staining of liver sections at any age, as megakaryocytes are known to store glycogen (Figure 6H) (Gibb and Stowell 1949).
Abnormal Development
During late hepatic organogenesis, the two main cell populations of the liver are the hepatoblasts and the erythroblasts. Therefore, a severe reduction in the size and morphology of the developing liver can reflect a defect in erythropoiesis in the developing liver. A severe defect in liver erythropoiesis has been demonstrated in mice that lack the genes encoding either erythropoietin (Epo -/-) or the erythropoietin receptor (EpoR -/-) (Wu et al. 1995). Histological evaluation of livers from wild-type animals compared to Epo -/- or EpoR -/- animals at E13.0 showed an obvious absence of erythropoietic islands in mutant animals compared to wild type animals (Wu et al. 1995). The wild-type livers at this stage had erythroid cells at all stages of differentiation, whereas mutant livers only contained large erythroblasts (Wu et al. 1995). Defects in liver erythropoiesis have been reported in many genetically altered animal models, many of which are annotated on the mammalian phenotype browser under “Abnormal Hematopoietic System Morphology/Development” (http://www.informatics.jax.org).
E14.5 (TS23)
Beyond E13.5, the architecture of the developing liver remains the same while the organ continues to grow. Key venous structures, such as the ductus venosus, caudal vena cava, and portal vein can still be observed in sections (best in transverse orientation) through the liver at this age (Figures 7A–7C). Low-magnification images of the liver at E14.5 reveal a similar architecture to that seen at E13.5. However, the majority of the incomplete interlobar spaces seen at E13.5 have penetrated completely through the liver lobes by E14.5 (Figure 7A). Although essentially no gross structural changes occur after E13.5, changes in the individual cell populations and alterations in the organization of these cell populations are still taking place.
FIGURE 7.

Representative images of the E14.5 embryonic mouse liver. H&E-stained frontal (A), transverse (B), and sagittal (C) sections of liver at low magnification. High-magnification H&E (D), F4/80 IHC (E) and Pax5 IHC (F) sections. Low-magnification images of the liver at E14.5 reveal a similar architecture to that seen at E13.5 (A–C). Most of the RBCs present within vessels of the liver at E14.5 are still nucleated (D, arrowhead). Many of the hematopoietic foci at this developmental time point appear cord-shaped (D, double arrows). At this stage, hepatoblasts give rise to mature hepatocytes (D, white arrow); however, this change is not observed with H&E staining and would require stage-specific molecular markers to characterize. The erythroblastic islands observed at E13.5 are still present at E14.5, but their numbers are increased and can be evaluated with an F4/80 stain (E; compare panel A to B). IHC staining using the Pax5 antibody identifies a low number of B-cells scattered throughout the liver (F, arrow). CBD = common bile duct; CdRL = caudal right lobe of liver; D = diaphragm; DV = ductus venosus; E = esophagus; HRT = heart; IHCVC = intrahepatic caudal vena cava; ILS = interlobar space; K = kidney; LL = left lobe; LML = left medial lobe; LNG = lung; LVP = liver parenchyma; Ov = ovary; PHCVC = posthepatic caudal vena cava; PNCR = pancreas; PrHCVC = prehepatic caudal vena cava; PV = portal vein; RML = right medial lobe; S = stomach; SI = small intestine.
E14.5 represents a new phase in liver development when hepatocytes and biliary epithelial cells begin to differentiate from bipotential hepatoblasts (Houssaint 1980; Le Douarin 1975). Hepatoblasts give rise to mature hepatocytes in the liver parenchyma, whereas they differentiate into cholangiocytes in the nascent periportal areas. At this stage, the main functional focus of the developing liver begins to shift from hematopoiesis to hepatic metabolism (Hata, Namae, and Nishina 2007). Although this change is not observed with H&E staining, different stages of hepatic maturation can be characterized by the expression of stage-specific molecular markers (Hata, Namae, and Nishina 2007). Alpha-fetoprotein is an established hepatoblast marker whose expression in the liver begins at the onset of liver outgrowth (E9.0) but decreases as liver development proceeds (Hata, Namae, and Nishina 2007; Shiojiri, Lemire, and Fausto 1991). On the other hand, hepatocyte expression of albumin (the most abundant protein synthesized by mature hepatocytes) starts around E12.0 and increases until adulthood (Tilghman and Belayew 1982). Comparing the distribution of these two markers can be used to determine the maturation state of hepatoblasts/hepatocytes and thus the entire liver if halted/altered differentiation is suspected.
Most of the RBCs present within vessels of the liver at E14.5 are still nucleated (Figure 7D). Many of the hematopoietic foci at this developmental time point appear cord-shaped (Figure 7D); the erythroblastic islands observed at E13.5 are still present at E14.5, although they are increased in number (Figure 7E) (Sasaki and Sonoda 2000). By E14.0, the proportion of intrahepatic proerythroblasts is less than 5%, and there is an increase in the proportion of orthochromic erythroblasts, though this latter feature is not obvious on H&E-stained histological sections (Marks and Rifkind 1972). Granulocyte progenitors are rare but can be found in low numbers scattered throughout the liver parenchyma. Changes to the lymphoid progenitor population are evident around E14.5 as well, as this stage represents a predominant time point in B cell commitment within the developing liver (Hardy et al. 2000). B cells can be identified in low numbers scattered throughout the liver parenchyma in Pax5-stained sections (Figure 7F). B cell lymphopoiesis persists in the liver for nearly 2 weeks after birth (Velardi and Cooper 1984).
Abnormal Development
Metal-regulatory transcription factor 1 (MTF1) encodes a transcription factor that induces expression of metallothioneins and other genes involved in heavy metal homeostasis (i.e., cadmium, zinc, copper, and silver). This transcription factor accumulates in the nucleus upon heavy metal exposure and binds to promoters containing a metal-responsive element. Exposure to some heavy metals, such as chromium, has been shown to modify MTF1 expression (Majumder et al. 2003). Gene inactivation studies involving MTF1 resulted in animals with liver degeneration, congested sinusoids, near-complete destruction of the hepatic parenchyma, and swelling of the remaining hepatocytes by E14.5 (Gunes et al. 1998). These results suggest that in utero exposure to heavy metals could lead to disrupted expression of MTF1 and hepatic defects similar to those observed in this model.
Hypocellularity due to necrosis is not a common pathology observed in the embryonic liver. However, focal hepatic necrosis has been reported in genetically altered mice at E14.5 and E18.5. For example, inactivation of the transcription factor Nrf1 and the tumor suppressor gene Von Hippel Lindau (VHL) both lead to focal hepatic necrosis during this period of development (Chen et al. 2003; Hong et al. 2006). In Nrf1 mutant animals, this focal hepatic necrosis was found in combination with areas of hepatocyte apoptosis (Chen et al. 2003). The necrotic tissue in the Nrf1 mutants was also found adjacent to apparently healthy hepatic tissue (Chen et al. 2003; Hong et al. 2006).
E15.5 (TS24)
At E15.5, the low-magnification view of the liver is strikingly similar to the 2 previous days (Figure 8A). However, due to its expansion in size, the liver has now encroached onto the underside of the central tendon of the diaphragm. In this area, the liver is not covered by peritoneum and is referred to as the “bare area” of the liver (BALV; Kaufman 1999; Figure 8A and 8B). The falciform ligament is more clearly seen than at previous stages. It can now be observed in some sections with the ductus venosus in its lower border (Figure 8B) (Kaufman 1999). The ductus venosus, caudal vena cava, and portal vein can be observed in sections throughout the liver at E15.5 (Figures 8A, 8C, and 8D).
FIGURE 8.

Representative images of the E15.5 fetal mouse liver. H&E-stained frontal (A), transverse (B, C), and sagittal (D) sections of liver at low magnification. High-magnification H&E (E, F) sections. At low magnification, the liver is structurally similar to the two previous days (A–D). Hematopoiesis within the liver begins to decline at this stage. Many of the nucleated red blood cells (E, arrowhead) once present have now extruded their nuclei (E, asterisk), and erythrocyte size is highly variable (F). Megakaryocytes are still seen in high numbers at this stage (E, double arrows). BALV = bare area of the liver; CBD = common bile duct; CdRL = caudal right lobe of liver; CL = caudate lobe of liver; CrRL = cranial right lobe of liver; D = diaphragm; DV = ductus venosus; E = esophagus; FL = falciform ligament; GB = gallbladder; HRT = heart; K = kidney; LL = left lobe; LML = left medial lobe; LNG = lung; LVP = liver parenchyma; PHCVC = prehepatic caudal vena cava; PNCR = pancreas; PV = portal vein; RML = right medial lobe; S = stomach; SI = small intestine; T = testis.
At this stage, cells with intense, hyperchromatic nuclei are still predominant in the hematopoietic population of cells, as erythroblasts continue to account for the majority of hematopoietic cells found in the hepatic cords (Figure 8E). It is still difficult to detect granulocyte progenitors, though they are scattered throughout the liver parenchyma in low numbers. Within vessels, nucleated RBCs are still visible, though most intravascular RBCs have now extruded their nuclei. There is a great deal of anisocytosis within the red blood cell population at this stage (Figures 8E and 8F). Megakaryocytes are still present in high numbers (Figure 8E). It is important to keep in mind that, as described for earlier stages, sections through different areas of the liver at E15.5 will contain different structures, and not all major structures will be present within each section (compare Figures 8A–8D).
E16.5 (TS25)
At E16.5, low-magnification architecture of the liver does not differ from the previous several days. Major structures such as the ductus venosus, caudal vena cava, and portal vein can still be observed in sections through the liver at this age (Figures 9A, 9B, and 9C). The falciform ligament can be identified in a similar location in cranial transverse sections as in previous stages (Figure 9D). The central tendon of the diaphragm remains in close contact with the liver in the region of the bare area of the liver (Figure 9A). By this age the definitive arrangement of the liver lobes is achieved (Kaufman 1999). The deep fissures that divide the liver into lobes are now complete (Figure 9A). After E15.0, hepatocyte volume and individual hepatocyte size increase. By E16.5, there are some areas within the liver where hepatocytes are beginning to have greater contact with each other as the hematopoietic population recedes (Figure 9E). This is especially obvious toward the periphery of the liver (Figure 9F). Within vessels, some nucleated RBCs can still be seen; however, a considerable fraction of the intravascular RBCs have extruded their nuclei (Figure 9G). There is an increase in the granulocyte progenitor population that can be seen in small foci scattered throughout the liver parenchyma. As these granulocytes can be difficult to see with standard H&E-stained slides, myeloperoxidase immunostaining can be used to more easily visualize this population of cells (Figure 9H). Megakaryocytes are still found in relatively high numbers (Figure 9E).
FIGURE 9.
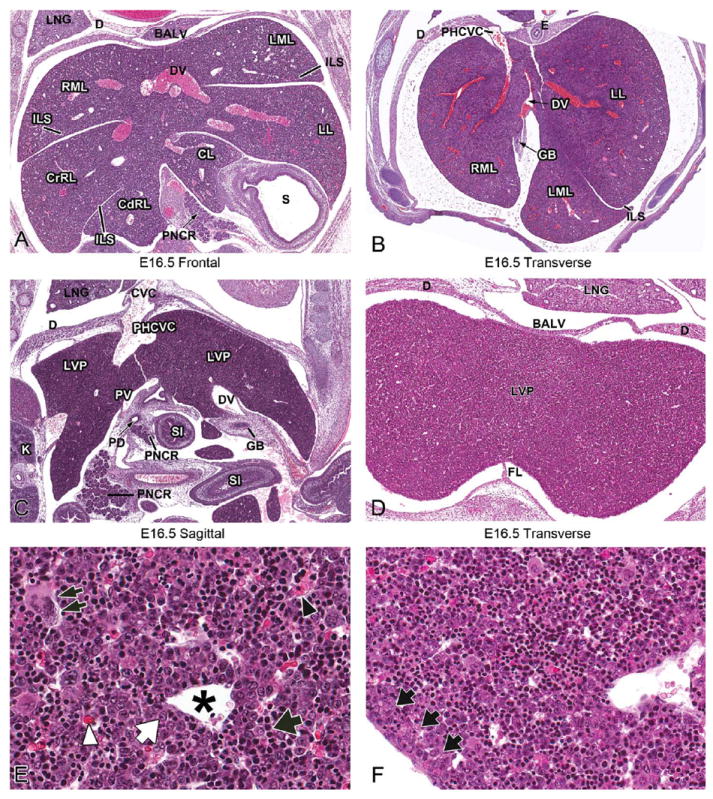
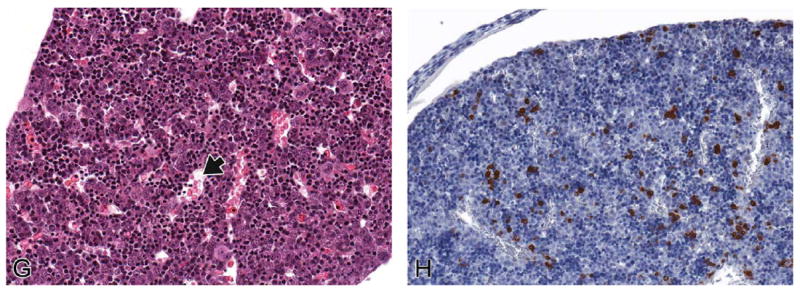
Representative images of the E16.5 fetal mouse liver. H&E-stained frontal (A) transverse (B, D), and sagittal (C) sections of E16.5 liver at low magnification. High-magnification H&E (E–G) and myeloperoxidase IHC (H) sections. At this stage, low-magnification architecture of the liver does not differ from the previous several days (A–D). Hematopoiesis in the liver continues to decline (E, black arrow), allowing hepatocytes (E, white arrow) to gain increased contact with one another. Megakaryocytes are still seen in relatively high numbers at this stage (E, double arrows). Hepatocytes are beginning to have greater contact with each other, and this is most obvious toward the periphery of the liver (F, arrows). Within vessels, most of the RBCs have extruded their nuclei (G, arrow; E, asterisk, white arrowhead), although occasional nucleated RBCs can be found (E, black arrowhead). IHC staining using the myeloperoxidase antibody demonstrates an increased number of granulocyte progenitors scattered individually or as small foci throughout the liver (H). BALV = bare area of the liver; CdRL = caudal right lobe of liver; CL = caudate lobe of liver; CrRL = cranial right lobe of liver; CVC = caudal vena cava; D = diaphragm; DV = ductus venosus; E = esophagus; FL = falciform ligament; GB = gallbladder; ILS = interlobar space; K = kidney; LL = left lobe; LML = left medial lobe; LNG = lung; LVP = liver parenchyma; PD = pancreatic duct; PHCVC = posthepatic caudal vena cava; PNCR = pancreas; PV = portal vein; RML = right medial lobe; S = stomach; SI = small intestine.
E17.5 (TS26)
At E17.5, the low-magnification view of the fetal liver looks nearly identical to previous stages. Major structures such as the ductus venosus, caudal vena cava, and portal vein can still be observed in sections through the liver at this age (Figures 10A–10C). The falciform ligament is still visible as well in cranial transverse sections (Figure 10D). However, higher magnification reveals changes to the existing cell populations.
FIGURE 10.


Representative images of the E17.5 fetal mouse liver. H&E-stained frontal (A) transverse (B, D), and sagittal (C) sections of liver at low magnification. High-magnification H&E (E, G, K), PAS (F), myeloperoxidase IHC (H–J), and Pax5 IHC (L) sections. At this stage of development, the low-magnification view of the fetal liver looks nearly identical to previous stages (A-D). The hepatocytes are beginning to organize and form mature hepatic cords (E, brackets). Hepatocellular cytoplasmic glycogen stores can be seen as clumped intracytoplasmic pink material with PAS staining (F). Hematopoiesis continues to decline, and the liver begins to establish small, solitary hematopoietic foci (E, arrows). Megakaryocytes are present, but in decreased numbers (E, double arrows). The RBCs within vessels in the liver at E17.5 are nearly all anucleate (G). Myeloperoxidase IHC identifies increased clusters of granulocytes dispersed throughout the liver as well as subcapsular (H, arrows) and perivascular (I, J) aggregates. These cells can also be seen with H&E stain (K, arrows). Pax 5 IHC reveals that B lymphocytes are increased in numbers, both scattered throughout the liver (L) and within perivascular hematopoietic aggregates. BALV = bare area of the liver; BD = bile duct; CBD = common bile duct; CrRL = cranial right lobe of liver; D = diaphragm; DA=ductus arteriosus; DUOD=duodenum; DV=ductus venosus; E=esophagus; FL=falciform ligament; GB=gallbladder; HRT=heart; K=kidney;LL=left lobe; LNG=lung; LML=left medial lobe; LVP=liver parenchyma; PHCVC=posthepatic caudal vena cava; PNCR = pancreas; PV = portal vein; RML = right medial lobe; S = stomach; SI = small intestine.
At E17.5, erythropoietic activity is rapidly declining. Hematopoietic cells can still be found scattered individually among hepatocytes; however, at this stage of hepatic development, small, solitary hematopoietic foci are forming (Figure 10E). The hematopoietic compartment has decreased to approximately 30% of the liver (Sasaki and Sonoda 2000). The hepatocytes continue to have increased contact with each other since the size of the intrahepatic hematopoietic compartment becomes smaller (Figure 10E). The hepatocytes at this age have an increased abundance of cytoplasm and a significantly reduced nuclear to cytoplasmic ratio. Hepatocytes are beginning to organize and form mature hepatic cords, comparable to those that make up the majority of the liver parenchyma in the adult (Figure 10E). The hepatic sinusoids help to delineate the reorganizing hepatic cords, although they can be difficult to appreciate in some areas because the liver parenchyma appears looser and less organized than it did previously. This is likely due to the presence of hepatocellular cytoplasmic glycogen stores, which can be demonstrated with PAS staining at this age (Figure 10F). Glycogen stored in the liver during late development is critical for the maintenance of glucose homeostasis during the first few days of postnatal life. The RBCs within hepatic vessels at E17.5 are nearly all anucleate and of smaller and more uniform size than previous ages (Figure 10G). The number of granulocyte progenitors within the liver parenchyma has increased. These cells can be found scattered throughout the liver, clustered around central veins and also located around the periphery of the liver (Figures 10H–10K). B lymphocytes are also increased in number, scattered throughout the liver and within perivascular hematopoietic aggregates (Figure 10L). Megakaryocytes are still present, but in decreased numbers (Figure 10E).
E18.5 (TS27)
At E18.5, the low-magnification view of the developing liver looks nearly identical to what was seen at E17.5. Structures such as the ductus venosus, caudal vena cava, portal vein, and falciform ligament can still be observed in sections through the liver at E18.5 (Figures 11A–11D). Erythropoietic activity continues to decline, as the principal hematopoietic sites have shifted from the liver to the bone marrow, thymus, and spleen (Kikuchi and Kondo 2006; Rifkind, Chui, and Epler 1969). Hepatocytes gain increased contact with each other and continue to form hepatic cords (Figure 11E). At this age of development, the hematopoietic population has been reduced to small, solitary hematopoietic foci. Due to the increased surface area between hepatocytes, many of the hematopoietic cells move from inter-hepatocytic spaces to periportal spaces late in gestation (Sonoda et al. 2001). Granulocyte progenitors are still found in foci and individually scattered throughout the parenchyma as well as in concentrated foci around central veins and interlobar spaces (Figure 11F). At this stage, the number of granulocyte progenitors appears to have decreased over previous ages.
FIGURE 11.

Representative images of the E18.5 fetal mouse liver. H&E-stained frontal (A), transverse (B, D), and sagittal (C) sections of liver at low magnification. High-magnification H&E (E) and myeloperoxidase IHC (F) sections. The low-magnification liver architecture is nearly identical to what was seen at E17.5 (A–D). The hematopoietic population at this age has been reduced to small, solitary foci. Hepatic cord formation becomes more obvious as hepatocytes gain contact with each other (E, brackets). Myeloperoxidase IHC staining identifies a decreased number of granulocytes within the liver parenchyma (F). Fewer granulocytes aggregate along the subcapsular space and around hepatic vessels but can still be seen lining interlobar subcapsular spaces (F, arrows). BALV = bare area of the liver; CVC = caudal vena cava; CdRL = caudal right lobe of liver; CL = caudate lobe of liver; CrRL = cranial right lobe of liver; D = diaphragm; E = esophagus; FL = falciform ligament; GB = gallbladder; ILS = interlobar space; LL = left lobe; LML = left medial lobe; LNG = lung; LUV = left umbilical vein; LVP = liver parenchyma; PHCVC = posthepatic caudal vena cava; PNCR = pancreas; PV = portal vein; RML = right medial lobe; S = stomach; SI = small intestine.
Hepatocytes in the liver exhibit polarity characterized by structurally distinct apical and basolateral domains. Although hepatocyte polarity is established very early in liver development, it is difficult to recognize anatomically due to the abundance of hematopoietic cells. The establishment of hepatocyte cell polarity is crucial in generating a mature, functioning organ (Feracci et al. 1987; Mishra et al. 1999; Parviz et al. 2003). The liver’s role in postnatal endocrine and exocrine processes necessitate its complex cell polarity. The basal surface of the hepatocyte faces the sinusoidal capillaries. The hepatocytes and sinusoidal epithelium are separated by the space of Disse, where exchange occurs between extravasated serum and hepatocytes (Parviz et al. 2003). This organization facilitates the liver’s endocrine role in detoxification of blood and secretion of serum proteins by allowing the hepatocyte to communicate with the afferent blood supply. The exocrine function of the liver involves the secretion of bile. At the hepatocyte’s apical surface, bile is secreted into bile canaliculi that join with intra- and extrahepatic bile ducts that transport the bile to the gallbladder (Duncan 2003).
Abnormal Development
The architecture of hepatocytes is often disrupted in disease states. Proper cell polarity and architecture is important for normal liver function. Animals in which hepatocyte nuclear factor 4a is inactivated specifically in the fetal liver (HNF4 mutant) demonstrate defective hepatocyte maturation and abnormal hepatic tissue architecture (Parviz et al. 2003). At E18.5, normal hepatocytes in mice are large, flat, and organized into tightly associated cords. However, HNF4 mutant hepatocytes are small, round, and loosely associated. PAS histology demonstrates that the HNF4 mutant livers fail to accumulate glycogen normally (Parviz et al. 2003). Thus, genetic alterations can lead to disruptions in hepatic architecture and cell morphology observable on stained liver tissue sections.
Postnatal Liver Development
The adult liver has a characteristic histological architecture (Apte et al. 2007). The principal cells of the adult liver are the hepatocytes, which are linked in such a manner that they form cords or plates of cells (Samuelson 2007). These plates are separated from each other by the hepatic sinusoids. In the adult, the hepatocytes are organized by the stromal elements of the liver into structural units known as hepatic lobules (Samuelson 2007). The central vein is located in the center of the lobule, whereas portal triads are located at the lobule periphery, separated by arcs of about 120° (Samuelson 2007). The portal triads contain branches of the hepatic artery and portal vein as well as intrahepatic bile ducts. During histological examination of the postnatal liver, it is important to remember that this characteristic liver architecture is not fully present until 2 to 3 weeks after birth (Apte et al. 2007).
Liver mass increases by several fold in the first 3 weeks of postnatal life but declines in the fourth postnatal week when the liver:body weight ratio approaches adult levels (Apte et al. 2007; Behrens et al. 2002). Beginning around one week postnatally, liver paranchymal cells (hepatocytes) begin to organize into well-defined hepatic plates (Grossi, Velardi, and Cooper 1985). Proliferation of biliary cells, along with an increase in the formation of portal triads, can be observed between ten and twenty days after birth (Apte et al. 2007).
During the first postnatal week, hematopoietic cell distribution in the neonatal liver is essentially the same as in the near-term fetus. Aggregates of hematopoietic cells, in which all cell lineages are intermingled, can be found among developing hepatocyte cords immediately after birth. At the end of the first postnatal week, hematopoietic cells have reorganized to form discrete foci composed of cells progressing along a single differentiation pathway (Grossi et al. 1985). Small islands of hematopoietic cells remain in the liver until 2 weeks after birth (Grossi et al. 1985; Sasaki et al. 1993). These hematopoietic cells can often be found surrounding a central macrophage (similar to embryonic/fetal development); however, the macrophages in the postnatal liver are much smaller (Sasaki et al. 1993). Small foci of hematopoietic cells can sometimes be seen scattered throughout the adult liver as well. Megakaryocytes can also be found in the postnatal liver as isolated cells surrounded by hepatocytes (Grossi et al. 1985).
Intrahepatic Bile Duct Differentiation
Bile production is an essential function performed by the hepatocytes of the liver. Within the liver, bile is transported through bile canaliculi that are connected to a network of intrahepatic bile ducts (IHBDs). The bile flows from the IHBDs to the hepatic ducts, moves through the cystic duct, and is finally stored in the gallbladder (Lemaigre 2003). IHBD differentiation occurs along a gradient from the liver hilus to the periphery and begins between E13.5 and E14.5 (Lemaigre 2003), beginning first near the centers of the lobes (Clotman et al. 2002).
Differentiation of periportal hepatoblasts into IHBDs can be divided into five histological stages (Lemaigre 2003; Shiojiri 1984). As their differentiation begins (stage 1), a subset of hepatoblasts are found very closely apposed to the mesenchyme surrounding the portal vein at about E14.0 (Figure 12A). These cells are considered biliary precursor cells based on their position (Lemaigre 2003; Shiojiri 1984; Van Eyken et al. 1988). In the next stage, beginning at E15.5, the biliary precursor cells form a single-layered ring, termed the ductal plate, around the mesenchyme of the portal vein (Figure 12B) (Lemaigre 2003). This ring becomes partially bilayered in the third stage, which occurs at approximately E16.5 (Figure 12C). At the fourth stage on the following day (E17.5), the bilayered ring undergoes extensive remodeling so that focal dilations occur between the two layers, forming bile ducts (Lemaigre 2003; Figures 12D and 12F, arrow). Ductal plates also begin to appear around smaller portal vein branches as they develop distally from the portal vein (Shiojiri 1997). The areas of the ductal plate that are not involved in duct formation subsequently regress (Lemaigre 2003). Around the time of birth, the fifth and final stage of bile duct remodeling occurs, and the newly formed ducts are incorporated into the portal mesenchyme (Lemaigre 2003; Figure 12E). The IHBDs progressively connect to each other to form a ductal network that drains toward the extrahepatic bile ducts (Shiojiri 1997).
FIGURE 12.
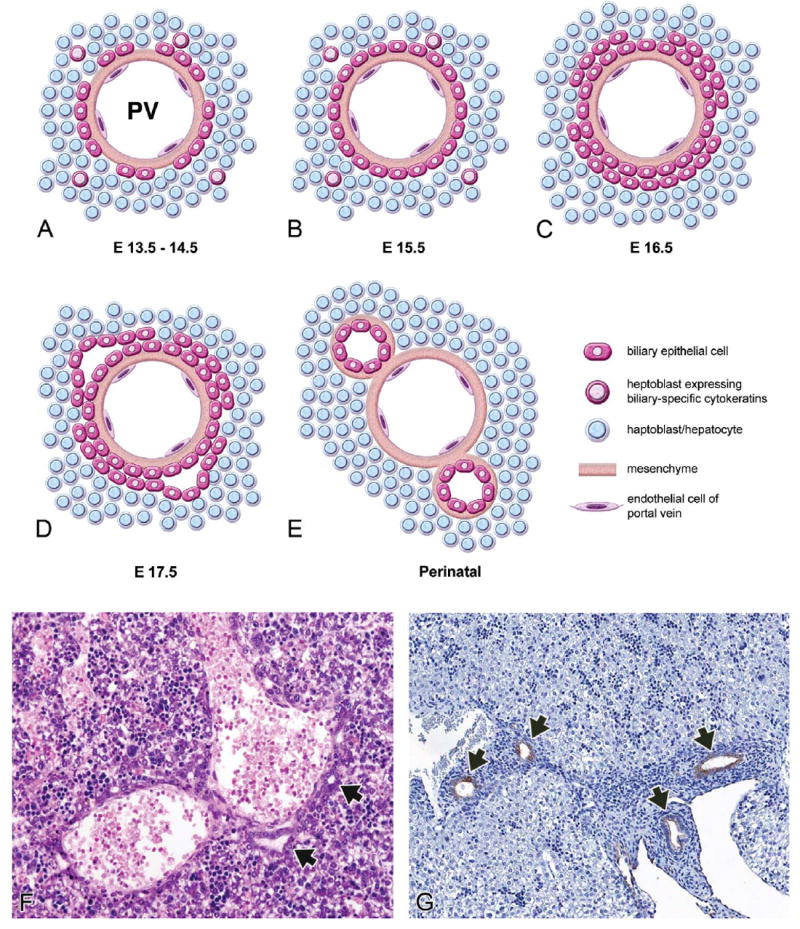
Development of the intrahepatic biliary system (A–E). High-magnification H&E section at E17.5 (F) and CK-19 IHC section at E18.5 (G). At E13.5-14.5, biliary precursor cells expressing CK19 are found close to the portal mesenchyme (A). Around E15.5, the biliary precursor cells form a single-layered ring called the ductal plate (B). This ring becomes bilayered close to E16.5 (C). At E17.5, focal dilations appear between the two layers (D). These dilations give rise to the intrahepatic bile duct, and the rest of the ductal plate regresses. Near the time of birth, the ducts become incorporated into the portal mesenchyme (E). At E17.5, the bile ducts that have formed adjacent to central veins can be identified by an H&E stain (F, arrows). CK-19 IHC stain is used to identify the ductal plate and can be used to monitor its development as seen at E18.5 (G, arrows). Adapted with permission from Lemaigre (2003, 82, Figure 2).
Although the events of ductal plate formation are not easily seen with H&E staining, they represent an important set of events with regard to normal liver function as well as developmental liver pathology. Immunohistochemistry for cytokeratin (CK) 19 has been a reported methodology for identifying the ductal plate and monitoring its development (Figure 12G, arrows) beginning as early as E13.5 (Clotman et al. 2002, 2003; Zong et al. 2009). Hepatoblasts can differentiate to become either hepatocytes or biliary epithelial cells. Those hepatoblasts immediately adjacent to the portal tract mesenchyme become more immunoreactive for CK-19 late during in utero development, whereas the hepatoblasts further from the ductal plate lose their CK-19 immunoreactivity (Lemaigre 2003; Shiojiri 1997).
Abnormal Development
A number of genetic alterations interfere with proper IHBD formation and result in the persistence of the ductal plate beyond the period of in utero development. Lack of remodeling results in the persistence of periportal epithelial sheets and results in ductal plate malformations. These malformations are characterized histologically by immature biliary structures in the ductal plate conformation. This means that biliary epithelial cells remain in their embryonic ductal plate conformation and do not remodel or become incorporated into the portal mesenchyme and biliary network. For example, mice homozygous for a null mutation of Hnf6 (Clotman et al. 2002), or mice with liver-specific inactivation of Hnf1b (Coffinier et al. 2002), had abnormal differentiation of biliary epithelial cells, defective formation of bile ducts leading to the persistence of ductal plate remnants at birth, and functional abnormalities in bile processing. The duct-like structures that did form were often cystic and were not properly incorporated into the portal mesenchyme, suggesting a lack of proper maturation.
Extrahepatic Biliary System
Bile, produced by hepatocytes, flows into bile canaliculi and then into individual intrahepatic bile ducts, which then lead into the right and left hepatic ducts within each liver lobe. The right and left hepatic ducts come together to form the common hepatic duct, which then joins with the cystic duct from the gallbladder, forming the common bile duct (Figure 13A). The hepatic ducts, cystic duct, and common bile duct are collectively referred to as the extrahepatic bile duct (EHBD). Bile is stored in the gallbladder and transported from the gall-bladder to be excreted into the duodenum via the common bile duct.
FIGURE 13.
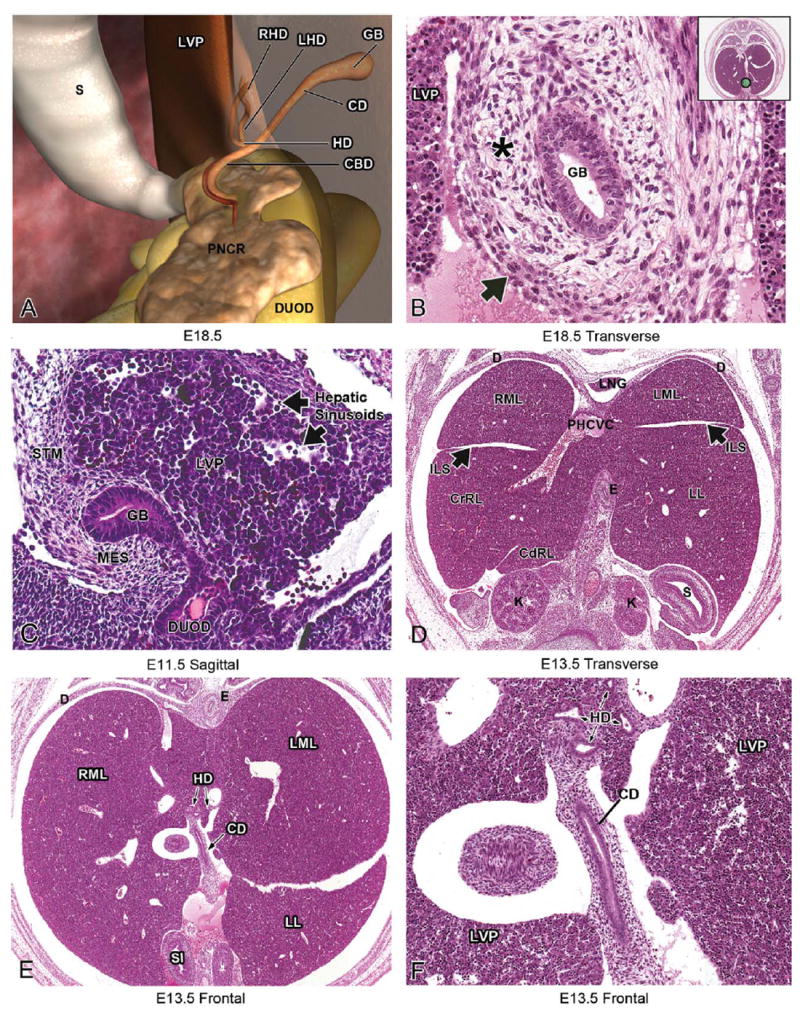
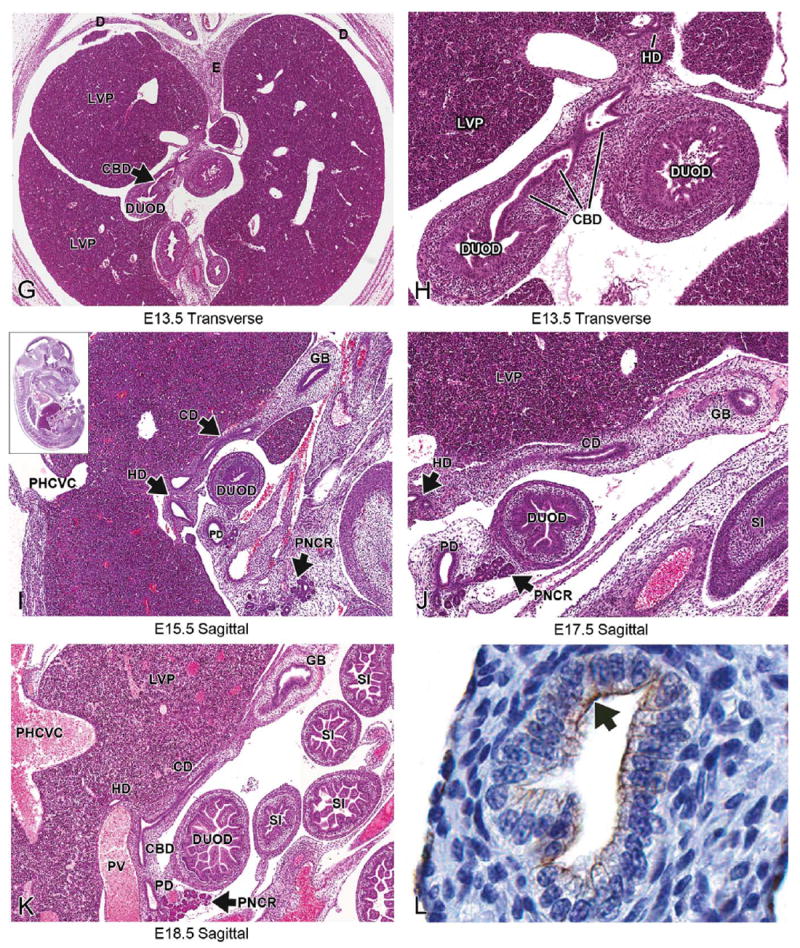
Development of the extrahepatic biliary system. Schematic illustration of the extrahepatic biliary system (A): bile is produced in hepatocytes in the liver and flows into bile canaliculi, and then into the right and left hepatic ducts. The hepatic ducts come together to form the common hepatic duct, which then joins with the cystic duct from the gallbladder. Together, these form the common bile duct. Bile is stored in the gallbladder and transported from the gallbladder into the duodenum via the common bile duct. Representative H&E-stained sections illustrating the gallbladder, hepatic ducts, cystic duct, and common bile duct leading into the duodenum at various stages of development (B–K). At E11.5, the gallbladder can be seen elongating with the liver and is surrounded by mesenchyme (C). A single layer of pseudostratified epithelium lines the gallbladder although tangential sections may give the appearance of “piling up” (B). It should be noted that the abdominal portion of the esophagus is sometimes situated between liver lobes where it can be mistaken for the gallbladder (D). Following the gallbladder in serial transverse section will eventually reveal the hepatic ducts and cystic duct, which empty into the common bile duct (E–K). The common bile duct can be followed in serial sections as it connects the gallbladder and duodenum (G, H). Figure 13L shows CK-19 positivity in the apical aspect of the cystic duct epithelium (arrow). CBD = common bile duct; CD = cystic duct; CdRL = caudal right lobe of liver; CrRL = cranial right lobe of liver; D = diaphragm; DUOD = duodenum; DV = ductus venosus; E = esophagus; GB = gallbladder; HD= hepatic duct; ILS= interlobar space;K = kidney; LHD= left hepatic duct; LL= left lobe;LML= left medial lobe; LNG= lung; LVP= liver parenchyma;MES=mesenchyme;PHCVC=post hepatic caudal vena cava; PNCR=pancreas;RHD=right hepatic duct;RML=rightmedial lobe; S = stomach; SI = small intestine; STM = septum transversum mesenchyme.
As previously described, development of the hepatobiliary system begins as an endodermal evagination at the foregut-midgut junction around E9.0 to form the hepatic bud. The bud then divides into cranial and caudal portions; the caudal portion gives rise to the gallbladder and the majority of the extrahepatic biliary system (Hunter et al. 2007), while the cranial portion gives rise to a portion of the extrahepatic biliary system as well as the liver and intrahepatic bile ducts (Clotman et al. 2002) (Figure 1). In the mouse, the primordium of the gallbladder is present at E10.0. At E11.5, the gallbladder can be seen elongating with the liver and is already surrounded by mesenchyme and continues to be surrounded by mesenchyme through E18.5 (Figures 13B and 13C) (Kalinichenko et al. 2004).
Grossly, the gallbladder is located in the bifurcation of the median lobe of the liver. In general, the structures of the gallbladder and EHBD are easiest to follow using sagittal or transverse sections. It is critical when evaluating the gallbladder and associated ductal structures in the embryo that a subset of serial sections is used, as this aids in following the ductal system as it runs from the gallbladder to the small intestine. The best way to locate the gallbladder using transverse sections is by following the caudal aspect of the liver in serial sections. This will reveal the junction of the liver with the gallbladder, which is found close to the origin of the falciform ligament in close proximity to the left umbilical vein/ductus venosus.
The lumen of the gallbladder is delineated by a single layer of pseudostratified columnar epithelium consisting of biliary epithelial cells called cholangiocytes (Figure 13B). The cholangiocytes have abundant pale, eosinophilic cytoplasm and ovoid nuclei located at the basilar aspect of the cell. They also have numerous, prominent nucleoli. Sections of gallbladder are often cut tangentially due to positioning during fixation. This can give the false appearance of multilayered epithelium (Figure 13B). Several layers of loose mesenchymal cells, with abundant diaphanous cytoplasm, surround the luminal epithelium (Figure 13B). Surrounding this mesenchymal layer is a very thin layer of muscle. The basic histological structure of the gallbladder does not change significantly throughout its development. It should be noted that the abdominal portion of the esophagus can sometimes be seen between liver lobes in a position where it could be mistaken for the gallbladder without careful examination (Figure 13D). The esophagus can be distinguished from the gallbladder as it can be seen in serial sections connecting to the stomach. Furthermore, the gallbladder has one thin layer of muscle surrounding a mesenchymal layer, whereas the esophagus is more clearly organized into two distinct muscular layers (inner circular and outer longitudinal). Continuing to follow the gallbladder in serial transverse sections will eventually reveal the cystic duct and common hepatic duct, which empty into the common bile duct (Figures 13E–13K). The common bile duct transports bile from the gallbladder into the small intestine and can be followed in serial sections as it connects the two structures, beginning at E11.5 and extending throughout development (Figures 13G–13H). Sagittal sections often provide the benefit of showing the hepatic ducts, cystic duct, common bile duct, and gallbladder in the same section (Figures 13I–13K). In sagittal view, the gallbladder will be located underneath the ventral-most aspect of the liver, near the physiological umbilical hernia, when present (Figure 13I). Since the basic histological structure of the gallbladder does not change significantly, these strategies can be used to identify the structures of the extrahepatic biliary system at any stage of development from E12.5-E18.5. CK 19 is expressed in the epithelium of the developing gallbladder in mammals (Figure 13L) and can be used to assess the integrity of the developing gallbladder epithelium when defects in its development are suspected (Hunter et al. 2007; Kalinichenko et al. 2002; Tan and Moscoso 1994).
Abnormal Development
Relatively little is known about the morphogenetic events and specific factors involved in gallbladder development. Several mutant mouse lines have been described that have abnormalities in gallbladder development in addition to alterations in other tissues (Clotman et al. 2002; Hunter et al. 2007; Kalinichenko et al. 2002). Animals heterozygous for the Forkhead box f1 transcription factor (Foxf1) have significantly smaller gallbladders with a range of structural abnormalities involving the smooth muscle layer, mesenchymal cell layer, and biliary epithelial cell layer of the gallbladder (Kalinichenko et al. 2002). Foxf1 mutant mice have lung abnormalities in addition to gallbladder abnormalities. Animals with a null mutation in the transcription factors HNF6 or hematopoietically expressed homeobox (Hhex) both lack a gallbladder in addition to possessing defects in other organs such as the liver (Hhex) and pancreas (HNF6) (Hunter et al. 2007; Jacquemin et al. 2000). Animals deficient for the transcription factor Hairy enhancer of split 1 (Hes1) have agenesis of the gallbladder and apparent conversion of biliary epithelial tissue to pancreatic tissue (Sumazaki et al. 2004). One mouse model, the Leucine-rich repeat-containing G protein-coupled receptor (LGR) mutant, lacks a gallbladder in the absence of developmental abnormalities in neighboring tissues (Yamashita et al. 2009). These LGR mice developed a normal gallbladder bud at E10.25 but had no further elongation of the bud (Yamashita et al. 2009). These and other studies have begun to reveal information about the genes necessary for normal gallbladder outgrowth and development.
Discussion
When evaluating hepatobiliary development during gestation, it is important to know the age-specific changes that occur from E9.5 to E18.5. Although many of the changes that occur during liver development are at the cellular level, there are also several noteworthy anatomical changes that occur at the macroscopic level.
At E9.0-E9.5, the liver consists of a diverticulum (“bud”) of endodermal cells arising from the ventral surface of the foregut near the foregut-midgut junction. At E10.0-E10.5, the epithelial sheets within the bud have undergone elongation and branching to begin forming the hepatic cords. By E11.5, the liver is primarily composed of hepatic cords and liver sinusoids. At this stage in development, the liver takes over from the yolk sac as the primary locus of hematopoiesis. From this stage forward, the developing liver is composed of variable proportions of hepatoblasts interspersed among hematopoietic cells. At E11.5 and E12.5, important vascular changes begin to occur such as the development of the ductus venosus, caudal vena cava, and portal vein. Division of the liver into lobes is another major macroscopic change and also begins at E12.5. By E13.5, the liver achieves its final embryonic architecture but continues to grow in size. After this stage, changes seen in the developing liver occur primarily at the cellular level. E13.5 represents the peak in hematopoietic activity within the liver. After this stage, hematopoiesis declines and hepatocytes gain increased contact with each other, initiating the definitive hepatic cords and sinusoids seen in the adult liver. Hepatic development must proceed for 2 to 3 weeks after birth before the mature constellation of hepatic cords and bile ducts is attained. Structures such as portal triads and hepatic plates are not normal features of the embryonic or early postnatal liver; therefore, their absence should not be mistaken as an abnormal liver phenotype.
For proper phenotypic evaluation of the liver in an embryo, there are many issues to consider in terms of normal structural and histological variation, proper sample processing, and evaluation of gross lesions. First, it is important to remember that there are strain differences as well as individual animal variation in developmental ages when embryological events are occurring. The features described for the ages provided in this atlas have been cited in the literature but should be used as a guide, while keeping in mind that developmental events may occur slightly earlier or slightly later in a particular strain of mice. Furthermore, some animals in a litter will naturally develop more slowly than their littermates and may not have identical developmental hallmarks when compared to other animals in the litter. This speaks to the importance of having properly controlled experiments, where littermate controls are used to establish a baseline of how normal development is occurring for a specific organ system in a particular developmental model.
Proper embryo collection and processing is another critical aspect of successful embryo phenotypic evaluation. After gross dissection of the conceptus from the placenta, intact embryos or isolated livers can be submitted for histological evaluation. If the isolated liver will be submitted, the abdominal body cavity should be opened to allow fixative to penetrate and fix the liver before its removal. The liver is friable and therefore should be carefully removed. It is typically more useful to submit the entire conceptus as many targeted mutations disrupt multiple tissues (such as factors expressed in all endodermally derived organs). An exception to this approach may be considered if a more definitive examination of hematopoietic components is required. In such instances, isolation of the liver and submission of touch preparations may provide more complete information regarding the health of the various hematopoietic lineages than would histopathologic analysis (a situation equivalent to the need for bone marrow preparations when assessing the hematopoietic system of adults). Accurate staging of a conceptus as well as observations made during its initial dissection can be used in conjunction with histological examination to determine if embryonic liver abnormalities are present.
Choice of fixative is another parameter that can impact phenotypic evaluation of embryonic samples. Fixation is one of the most critical components of histological analysis because it can affect both tissue morphology and antigen detection. Cryopre-servation is sometimes chosen because antigens are well preserved by this preparation, though this typically comes at the expense of tissue morphology. Paraffin embedding preserves tissue integrity but may not be compatible with all immunohistochemical markers. Bouin’s fixation is often the preferred method when working with whole embryos and fetuses because it penetrates the tissue well, is excellent at preserving soft and delicate tissue structures and nuclei, and yields histologic stains with brilliant tinctorial characteristics. Bouin’s fixative contains formaldehyde, an aqueous saturated picric acid solution, and glacial acetic acid. The shrinking induced by the picric acid is offset by the swelling of the glacial acetic acid. However, there are caveats to using Bouin’s fixative. Tissue fixed for extended periods (more than 24 hr) become brittle and difficult to section. Six to 8 hr is optimal for tissue fixation in Bouin’s. In addition, if hematopoietic cells, specifically erythrocytes, are to be examined, Bouin’s is not the fixative of choice as the glacial acetic acid in Bouin’s fixative can cause lysis of RBCs. Bouin’s is optimal for trichrome staining due to its mordanting effect on the tissue (ability to fix dyes to cells and tissues); however, it may not be compatible with preservation of all antigens if immunohistochemistry will be performed (Ananthanarayanan et al. 2005). Thus, it is crucial to identify organs and molecules of interest for a study before collection and fixation of the tissue. In addition, some antibodies may work in frozen and not in paraffin-embedded tissue, so it may be necessary to collect multiple embryos to correctly assess protein expression in some organ systems. Adequate penetration of the fixative is another issue to address in embryos older than E17.5. For the intact embryo, the integument over the torso is partially removed and the abdominal cavity opened to permit adequate penetration of the fixative near the hepatobiliary organs. Removing the head and limbs alone is not sufficient for fixation of older embryos.
Careful evaluation of the embryo for gross lesions is another critical step in phenotypic evaluation. As an example, defects in hematopoiesis may result in observable gross changes in the embryo. The circulation of oxygen-carrying RBCs is essential for growth and survival to term of a developing conceptus. Therefore, defects in intra-hepatic hematopoiesis, and thus oxygen-carrying capacity, can lead to embryonic lethality. Around E11.5, the liver takes over for the yolk sac blood islands as the primary site of hematopoiesis. For this reason, liver-related defects in hematopoiesis often lead to death after this stage of development (i.e., during mid-gestation). Embryos with early hematopoietic defects often have a gross appearance characterized by a pale yolk sac and pale embryo proper. Hematopoietic defects in early to mid-gestation generally have a small and pale liver when compared to controls. If the architecture of the liver is severely disrupted/disintegrated due to defects in hepatoblast formation/proliferation, this can cause defects in the intrahepatic (sinusoidal) and transhepatic circulations as well. Red blood cells may accumulate in the developing liver due to interrupted circulation (caused by the disruption in hepatic architecture), leading to anoxia and eventually death. On histological analysis, these livers may exhibit altered organization of the hepatic architecture and/or inappropriate concentrations of RBCs. Liver congestion secondary to an abnormal cardiovascular phenotype is another differential that should be considered in conjunction with a thorough review of the heart and major vessels (Savolainen, Foley, and Elmore 2009).
As genetically modified mice continue to be utilized in the pursuit of a better mechanistic understanding of hepatobiliary development, it is likely that more pathologists will be called upon to characterize phenotypic defects in the liver and gall-bladder during in utero and early postnatal development. A number of factors may influence the phenotypic evaluation of such embryos including accurate specimen staging, availability of appropriate control samples, tissue fixation protocol, and the pathologist’s knowledge of age-specific normal anatomy and cellular morphology. It is our hope that information provided in this atlas will make this task more approachable.
Acknowledgments
The authors wish to acknowledge Norris Flagler (NIEHS), Beth Mahler (EPL), and Elizabeth Ney (NIEHS) for image scanning and photographic assistance and David Sabio (EPL) for schematic illustrations. We are also grateful to Drs. Brad Bolon, Mark Hoenerhoff, Bob Maronpot, Greg Travlos, Jim Morrison, and Jerry Ward for careful review of this article.
This research was supported (in part) by the Intramural Research Program of the NIH, National Institute of Environmental Health Sciences.
Abbreviations
- E
embryonic day
- FGF
fibroblast growth factor
- H&E
hematoxylin and eosin
- IHC
immunohistochemistry
- PAS
Periodic acid-Schiff
- PECAM
platelet endothelial cell adhesion molecule
- RBC
red blood cell
- STM
septum transversum mesenchyme
- TS
Theiler stage
Footnotes
All digital images can be viewed online at https://niehsimagesepl-inc.com with the username “ToxPathLiver” and the password “embryolivers.”
References
- Ananthanarayanan V, Pins MR, Meyer RE, Gann PH. Immunohistochemical assays in prostatic biopsies processed in Bouin’s fixative. J Clin Pathol. 2005;58:322–4. doi: 10.1136/jcp.2004.019299. [DOI] [PMC free article] [PubMed] [Google Scholar]
- Apte U, Zeng G, Thompson MD, Muller P, Micsenyi A, Cieply B, Kaestner KH, Monga SP. Beta-Catenin is critical for early postnatal liver growth. Am J Physiol Gastrointest Liver Physiol. 2007;292:G1578–85. doi: 10.1152/ajpgi.00359.2006. [DOI] [PubMed] [Google Scholar]
- Asano H, Kobayashi M, Hoshino T. The hemopoietic microenvironment in the fetal liver of mice: relationship between developing hepatocytes and erythroblasts. J Electron Microsc (Tokyo) 1987;36:15–25. [PubMed] [Google Scholar]
- Behrens A, Sibilia M, David JP, Mohle-Steinlein U, Tronche F, Schutz G, Wagner EF. Impaired postnatal hepatocyte proliferation and liver regeneration in mice lacking c-jun in the liver. EMBO J. 2002;21:1782–90. doi: 10.1093/emboj/21.7.1782. [DOI] [PMC free article] [PubMed] [Google Scholar]
- Chasis JA. Erythroblastic islands: Specialized microenvironmental niches for erythropoiesis. Curr Opin Hematol. 2006;13:137–41. doi: 10.1097/01.moh.0000219657.57915.30. [DOI] [PubMed] [Google Scholar]
- Chen L, Kwong M, Lu R, Ginzinger D, Lee C, Leung L, Chan JY. Nrf1 is critical for redox balance and survival of liver cells during development. Mol Cell Biol. 2003;23:4673–86. doi: 10.1128/MCB.23.13.4673-4686.2003. [DOI] [PMC free article] [PubMed] [Google Scholar]
- Clotman F, Lannoy VJ, Reber M, Cereghini S, Cassiman D, Jacquemin P, Roskams T, Rousseau GG, Lemaigre FP. The onecut transcription factor HNF6 is required for normal development of the biliary tract. Development. 2002;129:1819–28. doi: 10.1242/dev.129.8.1819. [DOI] [PubMed] [Google Scholar]
- Clotman F, Libbrecht L, Gresh L, Yaniv M, Roskams T, Rousseau GG, Lemaigre FP. Hepatic artery malformations associated with a primary defect in intrahepatic bile duct development. J Hepatol. 2003;39:686–92. doi: 10.1016/s0168-8278(03)00409-4. [DOI] [PubMed] [Google Scholar]
- Coffinier C, Gresh L, Fiette L, Tronche F, Schutz G, Babinet C, Pontoglio M, Yaniv M, Barra J. Bile system morphogenesis defects and liver dysfunction upon targeted deletion of HNF1{beta} Development. 2002;129:1829–38. doi: 10.1242/dev.129.8.1829. [DOI] [PubMed] [Google Scholar]
- Cole RJ, Paul J. The effects of erythropoietin on haem synthesis in mouse yolk sac and cultured foetal liver cells. J Embryol Exp Morphol. 1966;15:245–60. [PubMed] [Google Scholar]
- Douagi I, Colucci F, Di Santo JP, Cumano A. Identification of the earliest prethymic bipotent T/NK progenitor in murine fetal liver. Blood. 2002;99:463–71. doi: 10.1182/blood.v99.2.463. [DOI] [PubMed] [Google Scholar]
- Duncan SA. Mechanisms controlling early development of the liver. Mechanisms of Development. 2003;120:19–33. doi: 10.1016/s0925-4773(02)00328-3. [DOI] [PubMed] [Google Scholar]
- Enzan H, Himeno H, Hiroi M, Kiyoku H, Saibara T, Onishi S. Development of hepatic sinusoidal structure with special reference to the Ito cells. Microsc Res Tech. 1997;39:336–49. doi: 10.1002/(SICI)1097-0029(19971115)39:4<336::AID-JEMT4>3.0.CO;2-F. [DOI] [PubMed] [Google Scholar]
- Everds NE. Hematology of the laboratory mouse. In: Fox JG, Barthold SW, Davisson MT, Newcomer CE, Quimby FW, Smith AL, editors. The Mouse in Biomedical Research. 2. Chap. 5. Academic Press; San Diego, CA: 2007. pp. 133–63. [Google Scholar]
- Feracci H, Connolly TP, Margolis RN, Hubbard AL. The establishment of hepatocyte cell surface polarity during fetal liver development. Dev Biol. 1987;123:73–84. doi: 10.1016/0012-1606(87)90429-5. [DOI] [PubMed] [Google Scholar]
- Fukuda S. The development of hepatogenic potency in the endoderm of quail embryos. J Embryol Exp Morphol. 1979;52:49–62. [PubMed] [Google Scholar]
- Fukuda-Taira S. Hepatic induction in the avian embryo: specificity of reactive endoderm and inductive mesoderm. J Embryol Exp Morphol. 1981;63:111–25. [PubMed] [Google Scholar]
- Gibb RP, Stowell RE. Glycogen in human blood cells. Blood. 1949;4:569–79. [PubMed] [Google Scholar]
- Grossi CE, Velardi A, Cooper MD. Postnatal liver hemopoiesis in mice: Generation of pre-B cells, granulocytes, and erythrocytes in discrete colonies. J Immunol. 1985;135:2303–11. [PubMed] [Google Scholar]
- Gualdi R, Bossard P, Zheng M, Hamada Y, Coleman JR, Zaret KS. Hepatic specification of the gut endoderm in vitro: cell signaling and transcriptional control. Genes Dev. 1996;10:1670–82. doi: 10.1101/gad.10.13.1670. [DOI] [PubMed] [Google Scholar]
- Gunes C, Heuchel R, Georgiev O, Muller KH, Lichtlen P, Bluthmann H, Marino S, Aguzzi A, Schaffner W. Embryonic lethality and liver degeneration in mice lacking the metal-responsive transcriptional activator MTF-1. Embo J. 1998;17:2846–54. doi: 10.1093/emboj/17.10.2846. [DOI] [PMC free article] [PubMed] [Google Scholar]
- Gunji Y, Sudo T, Suda J, Yamaguchi Y, Nakauchi H, Nishikawa S, Yanai N, Obinata M, Yanagisawa M, Miura Y, et al. Support of early B-cell differentiation in mouse fetal liver by stromal cells and interleukin-7. Blood. 1991;77:2612–7. [PubMed] [Google Scholar]
- Harada T, Enomoto A, Boorman GA, Maronpot RR. Liver and gallbladder. In: Maronpot R, editor. Pathology of the Mouse. Cache River Press; Vienna, IL: 1999. pp. 119–83. [Google Scholar]
- Hardy RR, Wasserman R, Li YS, Shinton SA, Hayakawa K. Response by B cell precursors to pre-B receptor assembly: Differences between fetal liver and bone marrow. Curr Top Microbiol Immunol. 2000;252:25–30. doi: 10.1007/978-3-642-57284-5_3. [DOI] [PubMed] [Google Scholar]
- Hata S, Namae M, Nishina H. Liver development and regeneration: From laboratory study to clinical therapy. Dev Growth Differ. 2007;49:163–70. doi: 10.1111/j.1440-169X.2007.00910.x. [DOI] [PubMed] [Google Scholar]
- Hilberg F, Aguzzi A, Howells N, Wagner EF. c-Jun is essential for normal mouse development and hepatogenesis. Nature. 1993;365:179–81. doi: 10.1038/365179a0. [DOI] [PubMed] [Google Scholar]
- Hong S-B, Furihata M, Baba M, Zbar B, Schmidt LS. Vascular defects and liver damage by the acute inactivation of the VHL gene during mouse embryogenesis. Lab Invest. 2006;86:664–75. doi: 10.1038/labinvest.3700431. [DOI] [PubMed] [Google Scholar]
- Houssaint E. Differentiation of the mouse hepatic primordium. I. An analysis of tissue interactions in hepatocyte differentiation. Cell Differ. 1980;9:269–79. doi: 10.1016/0045-6039(80)90026-3. [DOI] [PubMed] [Google Scholar]
- Hunter MP, Wilson CM, Jiang X, Cong R, Vasavada H, Kaestner KH, Bogue CW. The homeobox gene Hhex is essential for proper hepatoblast differentiation and bile duct morphogenesis. Developmental Biology. 2007;308:355–67. doi: 10.1016/j.ydbio.2007.05.028. [DOI] [PMC free article] [PubMed] [Google Scholar]
- Isern J, Fraser ST, He Z, Baron MH. The fetal liver is a niche for maturation of primitive erythroid cells. Proc Natl Acad Sci U S A. 2008;105:6662–67. doi: 10.1073/pnas.0802032105. [DOI] [PMC free article] [PubMed] [Google Scholar]
- Jacquemin P, Durviaux SM, Jensen J, Godfraind C, Gradwohl G, Guillemot F, Madsen OD, Carmeliet P, Dewerchin M, Collen D, Rousseau GG, Lemaigre FP. Transcription factor hepatocyte nuclear factor 6 regulates pancreatic endocrine cell differentiation and controls expression of the proendocrine gene ngn3. Mol Cell Biol. 2000;20:4445–54. doi: 10.1128/mcb.20.12.4445-4454.2000. [DOI] [PMC free article] [PubMed] [Google Scholar]
- Johnson L, Greenbaum D, Cichowski K, Mercer K, Murphy E, Schmitt E, Bronson RT, Umanoff H, Edelmann W, Kucherlapati R, Jacks T. K-ras is an essential gene in the mouse with partial functional overlap with N-ras. Genes Dev. 1997;11:2468–81. doi: 10.1101/gad.11.19.2468. [DOI] [PMC free article] [PubMed] [Google Scholar]
- Jung J, Zheng M, Goldfarb M, Zaret KS. Initiation of mammalian liver development from endoderm by fibroblast growth factors. Science. 1999;284:1998–2003. doi: 10.1126/science.284.5422.1998. [DOI] [PubMed] [Google Scholar]
- Kalinichenko VV, Gusarova GA, Kim I-M, Shin B, Yoder HM, Clark J, Sapozhnikov AM, Whitsett JA, Costa RH. Foxf1 haploinsufficiency reduces Notch-2 signaling during mouse lung development. Am J Physiol Lung Cell Mol Physiol. 2004;286:L521–30. doi: 10.1152/ajplung.00212.2003. [DOI] [PubMed] [Google Scholar]
- Kalinichenko VV, Zhou Y, Bhattacharyya D, Kim W, Shin B, Bambal K, Costa RH. Haploinsufficiency of the mouse Forkhead Box f1 gene causes defects in gall bladder development. J Biol Chem. 2002;277:12369–74. doi: 10.1074/jbc.M112162200. [DOI] [PubMed] [Google Scholar]
- Kaufman MH. The Atlas of Mouse Development. Academic Press; San Diego, CA: 1999. [Google Scholar]
- Kaufman MH, Bard JBLB. The Anatomical Basis of Mouse Development. Academic Press; San Diego, CA: 1999. [Google Scholar]
- Kawamoto H, Ikawa T, Ohmura K, Fujimoto S, Katsura Y. T cell progenitors emerge earlier than B cell progenitors in the murine fetal liver. Immunity. 2000;12:441–50. doi: 10.1016/s1074-7613(00)80196-x. [DOI] [PubMed] [Google Scholar]
- Kawamoto H, Ohmura K, Fujimoto S, Katsura Y. Emergence of T cell progenitors without B cell or myeloid differentiation potential at the earliest stage of hematopoiesis in the murine fetal liver. J Immunol. 1999;162:2725–31. [PubMed] [Google Scholar]
- Kawamoto H, Ohmura K, Hattori N, Katsura Y. Hemopoietic progenitors in the murine fetal liver capable of rapidly generating T cells. J Immunol. 1997;158:3118–24. [PubMed] [Google Scholar]
- Kawamoto H, Ohmura K, Katsura Y. Direct evidence for the commitment of hematopoietic stem cells to T, B and myeloid lineages in murine fetal liver. Int Immunol. 1997;9:1011–19. doi: 10.1093/intimm/9.7.1011. [DOI] [PubMed] [Google Scholar]
- Kawane K, Fukuyama H, Kondoh G, Takeda J, Ohsawa Y, Uchiyama Y, Nagata S. Requirement of DNase II for definitive erythropoiesis in the mouse fetal liver. Science. 2001;292:1546–49. doi: 10.1126/science.292.5521.1546. [DOI] [PubMed] [Google Scholar]
- Keng VW, Yagi H, Ikawa M, Nagano T, Myint Z, Yamada K, Tanaka T, Sato A, Muramatsu I, Okabe M, Sato M, Noguchi T. Homeobox gene Hex is essential for onset of mouse embryonic liver development and differentiation of the monocyte lineage. Biochem Biophys Res Commun. 2000;276:1155–61. doi: 10.1006/bbrc.2000.3548. [DOI] [PubMed] [Google Scholar]
- Kikuchi K, Kondo M. Developmental switch of mouse hematopoietic stem cells from fetal to adult type occurs in bone marrow after birth. Proc Natl Acad Sci U S A. 2006;103:17852–57. doi: 10.1073/pnas.0603368103. [DOI] [PMC free article] [PubMed] [Google Scholar]
- Krupczak-Hollis K, Wang X, Kalinichenko VV, Gusarova GA, Wang IC, Dennewitz MB, Yoder HM, Kiyokawa H, Kaestner KH, Costa RH. The mouse Forkhead Box m1 transcription factor is essential for hepatoblast mitosis and development of intrahepatic bile ducts and vessels during liver morphogenesis. Developmental Biology. 2004;276:74–88. doi: 10.1016/j.ydbio.2004.08.022. [DOI] [PubMed] [Google Scholar]
- Lacaud G, Carlsson L, Keller G. Identification of a fetal hematopoietic precursor with B cell, T cell, and macrophage potential. Immunity. 1998;9:827–38. doi: 10.1016/s1074-7613(00)80648-2. [DOI] [PubMed] [Google Scholar]
- Langman J, Sandler TW. Langman’s Medical Embryology. 10. Lippincott Williams & Wilkins; Philadelphia: 2006. [Google Scholar]
- Lemaigre FP. Development of the bilary tract. Mechanisms of Development. 2003;120:82. doi: 10.1016/s0925-4773(02)00334-9. [DOI] [PubMed] [Google Scholar]
- Le Douarin NM. Synthesis of glycogen in hepatocytes undergoing differentiation: Role of homologous and heterologous mesenchyma. Dev Biol. 1968;17:101–14. doi: 10.1016/0012-1606(68)90092-4. [DOI] [PubMed] [Google Scholar]
- Le Douarin NM. An experimental analysis of liver development. Med Biol. 1975;53:427–55. [PubMed] [Google Scholar]
- Lemaigre FP. Development of the biliary tract. Mechanisms of Development. 2003;120:81–87. doi: 10.1016/s0925-4773(02)00334-9. [DOI] [PubMed] [Google Scholar]
- Li D, Wang G-Y, Liu Z-F, Shi Y-X, Zhang H, Bai Z-L. Macrophage-associated erythropoiesis and lymphocytopoiesis in mouse fetal liver: ultrastructural and ISH analysis. Cell Biology International. 2004;28:457–61. doi: 10.1016/j.cellbi.2004.03.015. [DOI] [PubMed] [Google Scholar]
- Li Z-W, Chu W, Hu Y, Delhase M, Deerinck T, Ellisman M, Johnson R, Karin M. The IKKbeta subunit of Ikappa B Kinase (IKK) is essential for nuclear factor kappa B activation and prevention of apoptosis. J Exp Med. 1999;189:1839–45. doi: 10.1084/jem.189.11.1839. [DOI] [PMC free article] [PubMed] [Google Scholar]
- Lu M, Kawamoto H, Katsube Y, Katsura Y. The common myelolymphoid progenitor: A key intermediate stage in hemopoiesis generating T and B cells. J Immunol. 2002;169:3519–25. doi: 10.4049/jimmunol.169.7.3519. [DOI] [PubMed] [Google Scholar]
- Majumder S, Ghoshal K, Summers D, Bai S, Datta J, Jacob ST. Chromium(VI) down–regulates heavy metal–induced metallothionein gene transcription by modifying transactivation potential of the key transcription factor, metal-responsive transcription factor 1. J Biol Chem. 2003;278:26216–26. doi: 10.1074/jbc.M302887200. [DOI] [PMC free article] [PubMed] [Google Scholar]
- Margagliotti S, Clotman F, Pierreux CE, Beaudry J-B, Jacquemin P, Rousseau GG, Lemaigre FP. The Onecut transcription factors HNF-6/OC-1 and OC-2 regulate early liver expansion by controlling hepatoblast migration. Developmental Biology. 2007;311:579–89. doi: 10.1016/j.ydbio.2007.09.013. [DOI] [PubMed] [Google Scholar]
- Marks PA, Rifkind RA. Protein synthesis: Its control in erythropoiesis. Science. 1972;175:955–61. doi: 10.1126/science.175.4025.955. [DOI] [PubMed] [Google Scholar]
- Martinez Barbera JP, Clements M, Thomas P, Rodriguez T, Meloy D, Kioussis D, Beddington RS. The homeobox gene Hex is required in definitive endodermal tissues for normal forebrain, liver and thyroid formation. Development. 2000;127:2433–45. doi: 10.1242/dev.127.11.2433. [DOI] [PubMed] [Google Scholar]
- Matsumoto K, Yoshitomi H, Rossant J, Zaret KS. Liver organogenesis promoted by endothelial cells prior to vascular function. Science. 2001;294:559–63. doi: 10.1126/science.1063889. [DOI] [PubMed] [Google Scholar]
- Medlock ES, Haar JL. The liver hemopoietic environment: I. Developing hepatocytes and their role in fetal hemopoiesis. Anat Rec. 1983;207:31–41. doi: 10.1002/ar.1092070105. [DOI] [PubMed] [Google Scholar]
- Meehan RR, Barlow DP, Hill RE, Hogan BL, Hastie ND. Pattern of serum protein gene expression in mouse visceral yolk sac and foetal liver. EMBO J. 1984;3:1881–85. doi: 10.1002/j.1460-2075.1984.tb02062.x. [DOI] [PMC free article] [PubMed] [Google Scholar]
- Mikula M, Schreiber M, Husak Z, Kucerova L, Ruth J, Wieser R, Zatloukal K, Beug H, Wagner EF, Baccarini M. Embryonic lethality and fetal liver apoptosis in mice lacking the c-raf-1 gene. Embo J. 2001;20:1952–62. doi: 10.1093/emboj/20.8.1952. [DOI] [PMC free article] [PubMed] [Google Scholar]
- Mishra L, Cai T, Yu P, Monga SP, Mishra B. Elf3 encodes a novel 200-kD beta-spectrin: Role in liver development. Oncogene. 1999;18:353–64. doi: 10.1038/sj.onc.1202313. [DOI] [PubMed] [Google Scholar]
- Naito M, Hasegawa G, Takahashi K. Development, differentiation, and maturation of Kupffer cells. Microsc Res Tech. 1997;39:350–64. doi: 10.1002/(SICI)1097-0029(19971115)39:4<350::AID-JEMT5>3.0.CO;2-L. [DOI] [PubMed] [Google Scholar]
- Naito M, Takahashi K, Nishikawa S. Development, differentiation, and maturation of macrophages in the fetal mouse liver. J Leukoc Biol. 1990;48:27–37. doi: 10.1002/jlb.48.1.27. [DOI] [PubMed] [Google Scholar]
- Nishina H, Vaz C, Billia P, Nghiem M, Sasaki T, De la Pompa JL, Furlonger K, Paige C, Hui C, Fischer KD, Kishimoto H, Iwatsubo T, Katada T, Woodgett JR, Penninger JM. Defective liver formation and liver cell apoptosis in mice lacking the stress signaling kinase SEK1/MKK4. Development. 1999;126:505–16. doi: 10.1242/dev.126.3.505. [DOI] [PubMed] [Google Scholar]
- Nomina Anatomica Veterinaria. 5. International Committee on Veterinary Gross Anatomical Nomenclature (ICVGAN); 2007. http://www.wava-amav.org/nav_nev.htm. [Google Scholar]
- Palis J, Kingsley PD. Differential gene expression during early murine yolk sac development. Mol Reprod Dev. 1995;42:19–27. doi: 10.1002/mrd.1080420104. [DOI] [PubMed] [Google Scholar]
- Parviz F, Matullo C, Garrison WD, Savatski L, Adamson JW, Ning G, Kaestner KH, Rossi JM, Zaret KS, Duncan SA. Hepatocyte nuclear factor 4alpha controls the development of a hepatic epithelium and liver morphogenesis. Nat Genet. 2003;34:292–6. doi: 10.1038/ng1175. [DOI] [PubMed] [Google Scholar]
- Petiet AE, Kaufman MH, Goddeeris MM, Brandenburg J, Elmore SA, Johnson GA. High-resolution magnetic resonance histology of the embryonic and neonatal mouse: A 4D atlas and morphologic database. Proceedings of the National Academy of Sciences. 2008;105:12331–36. doi: 10.1073/pnas.0805747105. [DOI] [PMC free article] [PubMed] [Google Scholar]
- Rifkind RA, Chui D, Epler H. An ultrastructual study of early morphogenic events during the establishment of fetal hepatic erythropoiesis. J Cell Biol. 1969;40:343–65. doi: 10.1083/jcb.40.2.343. [DOI] [PMC free article] [PubMed] [Google Scholar]
- Rossi JM, Dunn NR, Hogan BL, Zaret KS. Distinct mesodermal signals, including BMPs from the septum transversum mesenchyme, are required in combination for hepatogenesis from the endoderm. Genes Dev. 2001;15:1998–2009. doi: 10.1101/gad.904601. [DOI] [PMC free article] [PubMed] [Google Scholar]
- Rugh R. The Mouse: Its Reproduction and Development. Oxford University Press; Oxford: 1990. [Google Scholar]
- Samuelson DA. Textbook of Veterinary Histology. W.B Saunders Company; Philadelphia: 2007. [Google Scholar]
- Sasaki K, Iwatsuki H. Origin and fate of the central macrophages of erythroblastic islands in the fetal and neonatal mouse liver. Microsc Res Tech. 1997;39:398–405. doi: 10.1002/(SICI)1097-0029(19971201)39:5<398::AID-JEMT2>3.0.CO;2-D. [DOI] [PubMed] [Google Scholar]
- Sasaki K, Iwatsuki H, Suda M, Itano C. Scavenger macrophages and central macrophages of erythroblastic islands in liver hemopoiesis of the fetal and early postnatal mouse: A semithin light- and electron-microscopic study. Acta Anat (Basel) 1993;147:75–82. doi: 10.1159/000147485. [DOI] [PubMed] [Google Scholar]
- Sasaki K, Matsumura G. Haemopoietic cells of yolk sac and liver in the mouse embryo: A light and electron microscopical study. J Anat. 1986;148:87–97. [PMC free article] [PubMed] [Google Scholar]
- Sasaki K, Sonoda Y. Histometrical and three-dimensional analyses of liver hematopoiesis in the mouse embryo. Arch Histol Cytol. 2000;63:137–46. doi: 10.1679/aohc.63.137. [DOI] [PubMed] [Google Scholar]
- Savolainen SM, Foley JF, Elmore SA. Histology atlas of the developing mouse heart with emphasis on E11.5 to E18.5. Toxicol Path. 2009;37:395–414. doi: 10.1177/0192623309335060. [DOI] [PMC free article] [PubMed] [Google Scholar]
- Schmidt C, Bladt F, Goedecke S, Brinkmann V, Zschiesche W, Sharpe M, Gherardi E, Birchmeier C. Scatter factor/hepatocyte growth factor is essential for liver development. Nature. 1995;373:699–702. doi: 10.1038/373699a0. [DOI] [PubMed] [Google Scholar]
- Shalaby F, Ho J, Stanford WL, Fischer KD, Schuh AC, Schwartz L, Bernstein A, Rossant J. A requirement for Flk1 in primitive and definitive hematopoiesis and vasculogenesis. Cell. 1997;89:981–90. doi: 10.1016/s0092-8674(00)80283-4. [DOI] [PubMed] [Google Scholar]
- Shalaby F, Rossant J, Yamaguchi TP, Gertsenstein M, Wu XF, Breitman ML, Schuh AC. Failure of blood-island formation and vasculogenesis in Flk-1-deficient mice. Nature. 1995;376:62–6. doi: 10.1038/376062a0. [DOI] [PubMed] [Google Scholar]
- Shiojiri N. The origin of intrahepatic bile duct cells in the mouse. J Embryol Exp Morphol. 1984;79:25–39. [PubMed] [Google Scholar]
- Shiojiri N. Development and differentiation of bile ducts in the mammalian liver. Microsc Res Tech. 1997;39:328–35. doi: 10.1002/(SICI)1097-0029(19971115)39:4<328::AID-JEMT3>3.0.CO;2-D. [DOI] [PubMed] [Google Scholar]
- Shiojiri N, Lemire JM, Fausto N. Cell lineages and oval cell progenitors in rat liver development. Cancer Res. 1991;51:2611–20. [PubMed] [Google Scholar]
- Sokol RJ. Introduction to the pediatric liver research agenda: a blueprint for the future. J Pediatr Gastroenterol Nutr. 2002;35(Suppl 1):S2–3. doi: 10.1097/00005176-200207001-00002. [DOI] [PubMed] [Google Scholar]
- Sonoda Y, Sasaki K, Suda M, Itano C. Ultrastructural studies of hepatoblast junctions and liver hematopoiesis of the mouse embryo. Kaibogaku Zasshi. 2001;76:473–82. [PubMed] [Google Scholar]
- Sosa-Pineda B, Wigle JT, Oliver G. Hepatocyte migration during liver development requires Prox1. Nat Genet. 2000;25:254–5. doi: 10.1038/76996. [DOI] [PubMed] [Google Scholar]
- Speck N, Peeters M, Dzierzak E. Development of the Vertebrate Hematopietic Sytem. In: Roussant J, Tam PPL, editors. Mouse Development: Patterning, Morphogenesis and Organogenesis. San Diego: Academic Press; 2002. pp. 371–393. [Google Scholar]
- Stenvers KL, Tursky ML, Harder KW, Kountouri N, Amatayakul-Chantler S, Grail D, Small C, Weinberg RA, Sizeland AM, Zhu HJ. Heart and liver defects and reduced transforming growth factor beta2 sensitivity in transforming growth factor beta type III receptor-deficient embryos. Mol Cell Biol. 2003;23:4371–85. doi: 10.1128/MCB.23.12.4371-4385.2003. [DOI] [PMC free article] [PubMed] [Google Scholar]
- Sulik KK, Bream PRJ. Educational Technology Group. Embryo Images: Normal and Abnormal Mammalian Development. University of North Carolina at Chapel Hill; 1999. http://www.med.unc.edu/embryo_images/unit-welcome/welcome_htms/akgs.htm. [Google Scholar]
- Sumazaki R, Shiojiri N, Isoyama S, Masu M, Keino-Masu K, Osawa M, Nakauchi H, Kageyama R, Matsui A. Conversion of biliary system to pancreatic tissue in Hes1-deficient mice. Nat Genet. 2004;36:83–87. doi: 10.1038/ng1273. [DOI] [PubMed] [Google Scholar]
- Suzuki T, Kanai Y, Hara T, Sasaki J, Sasaki T, Kohara M, Maehama T, Taya C, Shitara H, Yonekawa H, Frohman MA, Yokozeki T, Kanaho Y. Crucial role of the small GTPase ARF6 in hepatic cord formation during liver development. Mol Cell Biol. 2006;26:6149–56. doi: 10.1128/MCB.00298-06. [DOI] [PMC free article] [PubMed] [Google Scholar]
- Tan CE, Moscoso GJ. The developing human biliary system at the porta hepatis level between 29 days and 8 weeks of gestation: A way to understanding biliary atresia. Part 1. Pathol Int. 1994;44:587–99. doi: 10.1111/j.1440-1827.1994.tb01719.x. [DOI] [PubMed] [Google Scholar]
- Theiler K. The House Mouse: Development and Normal Stages from Fertilization to 4 Weeks of Age. Springer-Verlag; Berlin: 1972. [Google Scholar]
- Theiler K. The House Mouse: Atlas of Mouse Development. Springer-Verlag; New York: 1989. [Google Scholar]
- Tilghman SM, Belayew A. Transcriptional control of the murine albumin/alpha-fetoprotein locus during development. Proc Natl Acad Sci U S A. 1982;79:5254–57. doi: 10.1073/pnas.79.17.5254. [DOI] [PMC free article] [PubMed] [Google Scholar]
- Van Eyken P, Sciot R, Callea F, Van der Steen K, Moerman P, Desmet VJ. The development of the intrahepatic bile ducts in man: A keratin-immunohistochemical study. Hepatology. 1988;8:1586–95. doi: 10.1002/hep.1840080619. [DOI] [PubMed] [Google Scholar]
- Velardi A, Cooper M. An immunofluorescence analysis of the ontogeny of myeloid, T, and B lineage cells in mouse hemopoietic tissues. J Immunol. 1984;133:672–77. [PubMed] [Google Scholar]
- Watanabe Y, Aiba Y, Katsura Y. T cell progenitors in the murine fetal liver: Differences from those in the adult bone marrow. Cell Immunol. 1997;177:18–25. doi: 10.1006/cimm.1997.1094. [DOI] [PubMed] [Google Scholar]
- Wu H, Liu X, Jaenisch R, Lodish HF. Generation of committed erythroid BFU-E and CFU-E progenitors does not require erythropoietin or the erythropoietin receptor. Cell. 1995;83:59–67. doi: 10.1016/0092-8674(95)90234-1. [DOI] [PubMed] [Google Scholar]
- Yamashita R, Takegawa Y, Sakumoto M, Nakahara M, Kawazu H, et al. Defective development of the gall bladder and cystic duct in Lgr4- hypomorphic mice. Dev Dyn. 2009;238:993–1000. doi: 10.1002/dvdy.21900. [DOI] [PubMed] [Google Scholar]
- Zaret KS. Molecular genetics of early liver development. Annu Rev Physiol. 1996;58:231–51. doi: 10.1146/annurev.ph.58.030196.001311. [DOI] [PubMed] [Google Scholar]
- Zhao R, Duncan SA. Embryonic development of the liver. Hepatology. 2005;41:956–67. doi: 10.1002/hep.20691. [DOI] [PubMed] [Google Scholar]
- Zhao R, Watt AJ, Li J, Luebke-Wheeler J, Morrisey EE, Duncan SA. GATA6 is essential for embryonic development of the liver but dispensable for early heart formation. Mol Cell Biol. 2005;25:2622–31. doi: 10.1128/MCB.25.7.2622-2631.2005. [DOI] [PMC free article] [PubMed] [Google Scholar]
- Zon LI. Hematopoiesis, a Developmental Approach. Oxford University Press; New York: 2001. [Google Scholar]
- Zong Y, Panikkar A, Xu J, Antoniou A, Raynaud P, Lemaigre F, Stanger BZ. Notch signaling controls liver development by regulating biliary differentiation. Development. 2009;136:1727–39. doi: 10.1242/dev.029140. [DOI] [PMC free article] [PubMed] [Google Scholar]