

Abstract
Pyramidal neurons in the prefrontal cortex (PFC) are important for the control of cognitive and emotional behavior. The medial PFC (mPFC) receives diverse long-range excitatory inputs from the midline thalamus, contralateral mPFC, basolateral amygdala, and ventral hippocampus. While axons from these different regions have distinct distributions in the mPFC, their functional connections at the cellular and subcellular levels remain unknown. Here, we use optogenetics to show that layer 2 pyramidal neurons in acute slices of the mouse mPFC receive excitatory inputs from each of these regions. Using a combination of optogenetics and two-photon microscopy, we then determine the subcellular properties of these inputs. We find that different types of inputs make selective contacts at the levels of both dendrites and spines. Using two-photon uncaging, we show that this subcellular targeting strongly influences synaptic efficacy in these neurons. Together, our results show that functional connectivity is finely tuned, with important implications for signal processing in the mPFC.
Introduction
The prefrontal cortex (PFC) helps control higher cognitive and emotional behavior (Goldman-Rakic, 1995; Fuster, 2008), as highlighted by its dysfunction in schizophrenia and other neuropsychiatric diseases (Egan and Weinberger, 1997; Arnsten, 2011). A central role of the medial PFC (mPFC) is to integrate inputs from multiple brain regions, including the midline thalamus (MD), contralateral mPFC (cmPFC), basolateral amygdala (BLA), and ventral hippocampus (VH) (Hoover and Vertes, 2007). These excitatory inputs each carry distinct functional signals related to attention, cognition, emotion, and memory (Kolb, 1984; Vertes, 2006). However, the mechanisms by which pyramidal neurons in the mPFC process these diverse inputs remain unknown.
The superficial layers of many cortical areas are often important for the processing of long-range inputs (Douglas and Martin, 2004). In the mPFC, axons from other brain regions arborize in unique patterns throughout superficial layers 1 and 2/3 (Krettek and Price, 1977; Sesack et al., 1989; Bouwmeester et al., 2002; Cenquizca and Swanson, 2007). The dendrites of layer 2 (L2) pyramidal neurons extend through these layers, and may be well positioned to sample diverse inputs (Spruston, 2008). In many neurons, the magnitude of synaptic responses critically depends on the location of inputs in the dendrites (Rall, 1967; Williams and Stuart, 2002). Thus, targeting different inputs to distinct dendritic locations could influence their impact on L2 pyramidal neurons.
The dendrites of cortical pyramidal neurons are covered with spines, which receive the vast majority of glutamatergic inputs (Nimchinsky et al., 2002; Yuste, 2011). While spines have highly variable morphologies, they can sometimes be classified into distinct groups (Peters and Kaiserman-Abramof, 1970). In many neurons, synaptic responses have been shown to closely correlate with the head volume of spines (Matsuzaki et al., 2001). Thus, inputs onto large spines often evoke greater EPSPs at the cell body. In other brain regions, different types of inputs have been found to contact distinct morphological classes of spines (Humeau et al., 2005; Richardson et al., 2009). Therefore, differential processing of excitatory inputs could also be achieved via selective targeting onto distinct populations of spines.
Identifying functional connections onto dendrites and spines has been challenging in neurons throughout the brain. The overlap of axons and dendrites often fails to accurately predict the locations of functional synapses (Shepherd et al., 2005; Stepanyants and Chklovskii, 2005). Paired recordings and one-photon glutamate uncaging can identify local connections (Callaway and Katz, 1993; Markram et al., 1997), but can rarely be applied to long-range inputs. Optogenetic tools have been used to map long-range connections (Petreanu et al., 2007), showing that inputs can target unique dendritic domains (Petreanu et al., 2009; Mao et al., 2011). However, this approach is challenging in smaller neurons and cannot be used to identify active spines.
Here we examine the functional connections made by long-range excitatory inputs onto L2 pyramidal neurons in acute slices of the mouse mPFC. We first use optogenetics and whole-cell recordings to show that inputs from the MD, cmPFC, BLA, and VH make contact with these neurons. We then combine optogenetics and two-photon microscopy to probe connectivity at the levels of dendrites and spines. We find that each input contacts a distinct population of spines with different morphologies and locations. Using two-photon uncaging, we then demonstrate that this selective targeting strongly influences synaptic efficacy. Together, our results reveal the subcellular connectivity of L2 pyramidal neurons, with important implications for signal processing in the mPFC.
Materials and Methods
Preparation.
We studied L2 pyramidal neurons in acute slices from the prelimbic mPFC of P21–P28 Swiss Webster mice of either sex. Before dissection, mice were anesthetized with an intraperitoneal injection of a lethal dose of ketamine/xylazine. Following anesthesia, mice were perfused intracardially with an ice-cold solution containing the following (in mm): 65 sucrose, 75 NaCl, 25 NaHCO3, 1.4 NaH2PO4, 25 glucose, 2.5 KCl, 1 CaCl2, 5 MgCl2, 0.4 Na-ascorbate, and 2 Na-pyruvate, bubbled with 95% O2/5% CO2. Coronal sections (300 μm thick) were cut in this solution and transferred to artificial CSF (ACSF) containing the following (in mm): 119 NaCl, 25 NaHCO3, 1.4 NaH2PO4, 25 glucose, 2.5 KCl, 2 CaCl2, 1 MgCl2, 0.4 Na-ascorbate, and 2 Na-pyruvate, bubbled with 95% O2/5% CO2. Slices were recovered for 30 min at 34°C, and then stored for at least 30 min at 24°C. All experiments were conducted at room temperature (22–24°C), except the current-clamp recordings shown in Figure 8, which were performed at 31–32°C. For all experiments, 10 μm gabazine and 10 μm d-serine were included to block GABAA-receptor-mediated inhibition and prevent NMDA receptor (NMDAR) desensitization, respectively. For all optogenetic experiments, 1 μm TTX, 100 μm 4-AP, and 4 mm Ca were included to prevent action potentials and enhance presynaptic release. All chemicals were from Sigma or Tocris Bioscience.
Figure 8.
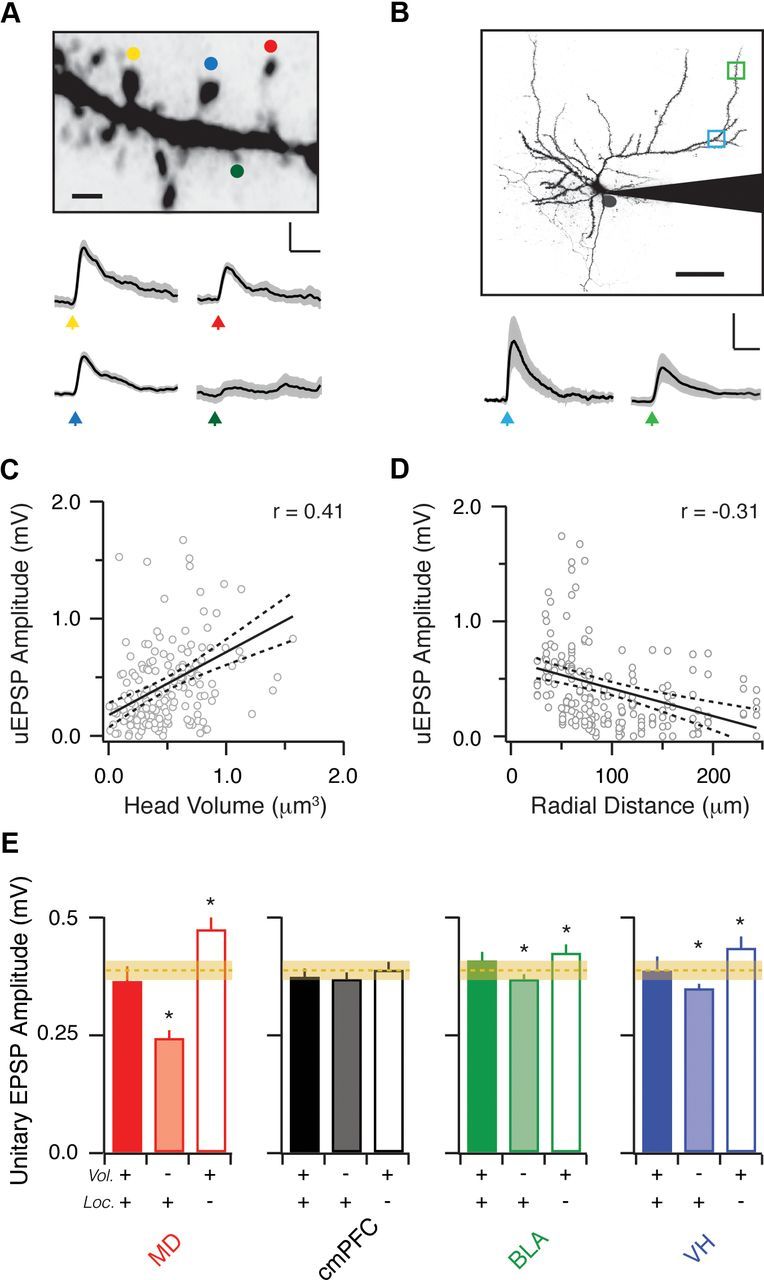
Spine location and morphology impact synaptic efficacy. A, Top, Two-photon image stack of a dendritic segment, showing heterogeneous spine morphologies, where colored dots indicate two-photon uncaging targets. Scale bar, 1 μm. Bottom, uEPSPs evoked with a brief pulse of 725 nm light. Black lines are the average of 10 trials, and gray regions indicate the SEM. Colored arrows indicate uncaging times at indicated spines. Scale bar: 0.2 mV, 25 ms. B, Top, Two-photon image stack of an L2 pyramidal neuron, showing two regions (green, blue) targeted for two-photon uncaging. Scale bar, 50 μm. Bottom, Average uEPSPs generated at the two regions. Colored arrows indicate uncaging times at different locations. Scale bar: 0.4 mV, 25 ms. C, D, uEPSP amplitude as a function of spine head volume (C) and radial distance from the soma (D). Solid and dashed lines represent linear fits and 5–95% confidence intervals, respectively. Correlation coefficients (r values) are labeled in the upper right-hand corners. E, Predicted unitary EPSP amplitude for each input, calculated by combining results from the mapping and uncaging experiments. The x-axis indicates the variables included in the prediction calculation (head volume, location, or both). Orange dotted and faint lines represent the median and SE of the average response expected if no selective targeting occurs on spines or dendrites. Asterisks denote significant differences between the full and reduced predictions.
Stereotaxic injections.
Stereotaxic injections were performed on P9–P14 mice, which were subcutaneously injected with 0.02 mg/kg atropine 10 min before surgery, and then deeply anesthetized with 40 mg ketamine/5 mg xylazine per kilogram of body weight. Injection site coordinates were relative to bregma (dorsoventral axis, medial-lateral axis, and rostrocaudal axis, respectively: MD, +0.4, −2.7, and −0.7; cmPFC, +0.3, −2.3 to −1.3, and +1.7; BLA, +2.8, −4.6, and −0.7; VH, +2.8, −4.7 to −3.7, and −3.1). Borosilicate pipettes with tip diameters between 5 and 10 μm were backfilled with 1–2 μl of virus (AAV-ChR2-Venus, AAV-hChR2-mCherry, or AAV-mCherry; Penn Vector Core). A craniotomy was made above the injection site, and the pipette was slowly lowered to minimize tissue damage. Six to 14 13 nL boluses of virus were then pressure injected (Nanoject II; Drummond), with 30 s spacing between injections, for a total volume of 80–190 nL. After the final injection, the pipette was left in place for an additional 5 min to allow the virus to diffuse away from the pipette tip, before being slowly removed from the brain. Animals were returned to their cages for 2–3 weeks before being used for experiments.
Electrophysiology.
L2 pyramidal neurons located ∼200 μm from the pial surface and within ∼15 μm of the L1/L2 border were targeted using infrared-differential interference contrast. All neurons had a characteristic morphology, consisting of compact dendrites extending both horizontally and vertically from the soma. For voltage-clamp experiments, we filled borosilicate pipettes (2–5 MΩ) with the following (in mm): 135 Cs-gluconate, 10 HEPES, 10 Na-phosphocreatine, 4 Mg2-ATP, 0.4 NaGTP, and 0.6 D600, 290–295 mOsm, pH 7.35 with CsOH. For current-clamp recordings, we used the following (in mm): 135 K-gluconate, 7 KCl, 10 HEPES, 10 Na-phosphocreatine, 4 Mg2-ATP, and 0.4 NaGTP, 290–295 mOsm, pH 7.35 with KOH. For imaging experiments, we also included 40 μm Alexa Fluor 594 and 1 mm Fluo-4FF (Invitrogen) in the internal solution. The concentration of Fluo-4FF was chosen to maximize our ability to detect Ca signals while also reducing baseline fluorescence in our subcellular mapping experiments. Before beginning mapping, we waited at least 30 min for complete dye diffusion throughout the cell. In other experiments, we also allowed at least 15–30 min before recording. Physiology data were collected with a Multiclamp 700B amplifier. Signals were filtered at 5 kHz for current-clamp recordings and at 2 kHz for voltage-clamp recordings, and were sampled at 10 kHz.
Optogenetics.
Glutamate release was triggered by activating channelrhodopsin-2 (ChR2) present in the presynaptic terminals of different long-range excitatory inputs to the mPFC. For wide-field illumination experiments, a single 1–10 ms pulse of 473 nm light from an LED triggered release. For mapping experiments, the back focal plane of the objective was filled with collimated 473 nm light from a DPSS laser (Laserglow Technologies) using a fiber optic cable (Thorlabs), planoconvex lenses (Edmund Optics), and a dichroic mirror (Chroma), similar to that previously used for one-photon uncaging (Chalifoux and Carter, 2011). Beam diameter at the slice surface was ∼30 μm, allowing for focal ChR2 activation within the imaging window. Laser power was set between 1 and 5 mW, and pulse duration was set to 1 ms. A fast shutter (Uniblitz) was placed in the detection path to protect the photomultiplier tubes from intense laser light during ChR2 activation. Laser power and duration were chosen to both elicit reliable EPSCs at the soma and limit photo damage at spines and dendrites.
Two-photon microscopy.
Two-photon imaging and glutamate uncaging were performed on a custom microscope, as previously described (Carter and Sabatini, 2004; Chalifoux and Carter, 2010). For imaging, a Ti:Sapphire laser (Coherent) tuned to 810 nm was used to excite Alexa Fluor 594 and Fluo-4FF to image morphology and detect Ca signals, respectively. Ca signals were quantified as the change in Fluo-4FF fluorescence [green (G)] normalized to the Alexa Fluor 594 fluorescence [red (R)], giving units of ΔG/R. These signals were then normalized to the G/R value measured with a saturating concentration of Ca added to the internal solution in a thin-walled pipette, giving final measurements in units of ΔG/Gsat. Single line scans were acquired at 500 Hz, while interleaved line scans were acquired at 500 Hz divided by the number of lines (between 3 and 5, giving sampling rates between 167 and 100 Hz). For uncaging, a second laser tuned to 725 nm was used to photo-release 2.5 mm MNI-glutamate (Tocris Bioscience) with a 1 ms pulse of 80 mW light. Uncaging was restricted to within 40 μm of the slice surface, and the uncaging spot was placed 0.5 μm from the edge of the spine head, perpendicular to the local dendritic axis. All imaging and uncaging was conducted with a 63× 0.9 numerical aperture (NA) objective (Olympus).
Subcellular mapping.
After allowing dyes to equilibrate, we performed a systematic search of the dendrites to detect active spines. For each L2 pyramidal neuron, we randomly began sampling at dendrites terminating in either L1 or L2/3 and at dendritic segments found either proximally near the soma or distally near the tips. Each segment was sampled in consecutive and contiguous 15 × 7.5 μm imaging windows. For each segment, we noted the x, y, and z position relative to soma for off-line analysis of spine locations.
For each dendritic segment, we acquired seven baseline frames at 8 Hz, stimulated ChR2-positive axons with a 1 ms pulse from the 473 nm laser, and then collected four additional poststimulus frames. To ensure unbiased and quantitative determination of candidate spines, we first computed the Z-score for each pixel in our images (128 × 64 pixels, 0.1 μm per pixel). We then thresholded these Z-score images to define initial regions-of-interest (ROIs), summed these ROIs over trials, combined overlapping ROIs, and computed their average integrated fluorescence over time. Finally, we regressed these fluorescence transients against a template synaptic Ca signal, which reduced false-positive ROIs caused by noise, and eliminated dendritic ROIs with slow Ca signals that are not characteristic of direct synaptic responses. Z-score and regression coefficient thresholds were set to bias in favor of false-positive detection.
To further validate that candidate ROIs reflected functional synapses, we also performed line scans at higher temporal resolution through both active spines and their inactive neighbors. For these measurements, we used interleaved line scans through three to five spines while stimulating ChR2-positive axons. We found that multiline scanning was essential for reducing total imaging time and therefore any effects of photo damage. For each sampled dendritic segment, we acquired a high-resolution two-photon image stack (0.1 × 0.1 × 0.2 μm) for off-line analysis of spine morphology. At the end of each mapping experiment, we also acquired a two-photon image stack of the cell (1.0 × 1.0 × 1.0 μm or 0.5 × 0.5 × 1.0 μm) for off-line analysis of dendrite morphology.
Histology and confocal microscopy.
Mice were anesthetized and perfused intracardially, as described above. Brains were blocked and transferred to 4% paraformaldeyhde in 0.01 m PBS for 16–24 h at 4°C before being transferred to 0.01 m PBS. Slices were cut on a VT-1000S vibratome (Leica) at 50 μm, and placed on gel-coated glass slides. ProLong Gold antifade reagent with DAPI (Invitrogen) was applied with 0.01 m PBS to the surface of the slices, which were then covered with a glass coverslip. All confocal images were taken on a Leica TCX SP5. Images of anterograde anatomy were taken with a 40× 1.5 NA oil-immersion objective at 1024 × 1024 pixels (0.34 × 0.34 μm).
Data analysis.
Imaging and physiology data were acquired using National Instruments boards and custom software written in MATLAB (Mathworks). Online ROI detection was performed in MATLAB. Image preprocessing was performed in ImageJ (NIH) and MATLAB. Morphological analysis was conducted in NeuronStudio (Dumitriu et al., 2011). Ca imaging and physiology analysis was performed in Igor Pro (Wavemetrics).
For analysis of two-photon image stacks, all visible dendrites of each mapped neuron were reconstructed in NeuronStudio. To analyze spine morphology, high-resolution image stacks of each dendrite segment were deconvolved using 500 iterations of the “deblur” function in MATLAB, using the raw image cross-correlation as the initial point-spread function estimate. Deconvolved images were subsequently treated with a 3 × 3 median filter to remove remaining noise, and a Gaussian filter to improve the signal-to-noise ratio (SNR). Seed points were manually placed along the dendrites in the image at the heads of all visible spines. NeuronStudio was used to automatically determine the boundaries of spines and dendrites in three dimensions. We found that three-dimensional analysis of morphology was essential for accurate spine quantification, as many large or long spines can appear deceptively small or short in two-dimensional projections.
To quantify the distributions of axons from our confocal images, we imaged both the ipsilateral and contralateral side of the cortex. For background subtraction, we took advantage of the fact that projections from the MD, BLA, and VH are strictly ipsilateral, and subtracted the contralateral image from the ipsilateral image. For background subtraction of cmPFC images, we subtracted the average contralateral image from the MD input, as MD axons were similar in brightness and density to those from the cmPFC. After background subtraction, we then manually aligned and averaged these images across multiple slices (for each input, n = 3 animals, two slices per animal).
To generate axon density distributions, we averaged fluorescent profiles across rows or columns, and binned these distributions at the same resolution as our input maps. To generate spine density distributions, we computed the average dendrite length per bin along rows or columns, and multiplied these distributions by a constant, experimentally determined spine density coefficient (1.9 spines/μm). We then multiplied these axon and spine density distributions and normalized them to generate probability distributions of the number of synapses at each spatial location. To quantify the differences between predicted and measured distributions, we resampled our measured data (10,000 surrogates) and computed the Pearson's correlation coefficient (r).
To predict the amplitude of unitary EPSPs generated by different inputs, we combined the results from our mapping and uncaging experiments. We first sampled the head volumes and locations of spines contacted by a given input (see Figs. 5, 7). We then used linear fits to our uncaging data to determine the unitary EPSP size (see Fig. 8). We resampled our dataset 10,000 times for each input to generate median unitary EPSP amplitudes. To independently assess the impact of head volume and location, we generated predictions in which (1) the input-specific distribution of head volume was replaced by the generic distribution for all spines (median = 0.25 μm3) or (2) input-specific distribution of location was replaced with the generic distribution for all spines (see Fig. 6). Finally, to create an average response expected if no selective targeting occurred, we generated predictions in which both input-specific distributions were substituted by their generic versions.
Figure 5.

Different inputs target select dendritic locations. A, Reconstructed L2 pyramidal neurons contacted by MD, cmPFC, BLA, and VH inputs, showing sampled dendrites (black) and active spines (colored dots). B, Probability distributions of synapse position as a function of vertical (y) displacement from the soma for each input. C, Cumulative probability distributions of synapse position as a function of y displacement from the soma for each input. Orange line shows the position of the L1/L2 border. D, Summary of y displacement for each input. Asterisks indicate significant differences. Color of asterisks and lines indicates which inputs are compared. E, F, Similar to C and D but in the horizontal (x) dimension.
Figure 7.
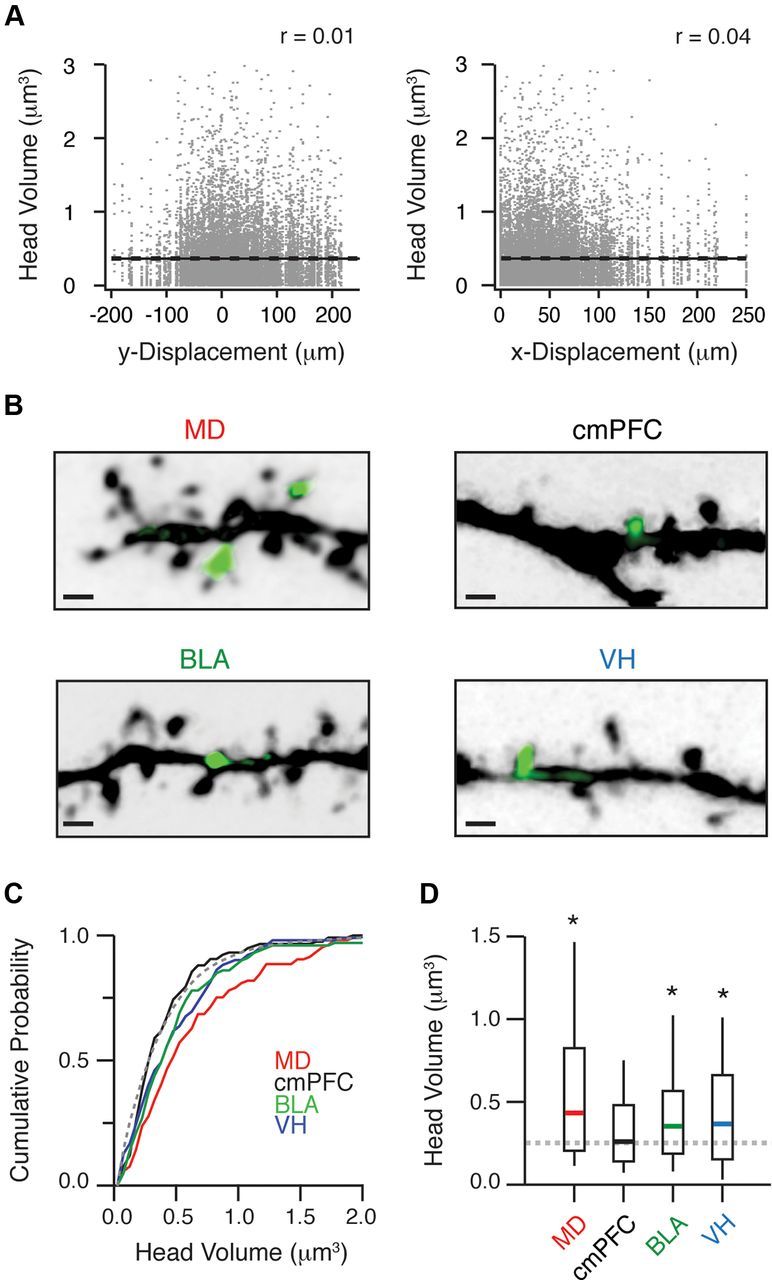
Different inputs target biased populations of spines. A, Head volumes of all reconstructed spines as a function of vertical (y; left) and horizontal (x; right) displacement from the soma. Solid black lines represent linear fits to the data, and dashed black lines indicate the 5 and 95% confidence intervals. Correlation coefficients (r values) are labeled in the upper right-hand corners. B, Two-photon image stacks of representative dendrites and spines contacted by each input, where green indicates evoked Ca signals (ΔG/R). Scale bars, 1 μm. C, Cumulative probability distributions for each input, showing the head volumes of detected spines (colored lines) and the entire nonactive population (gray dashed line). D, Summary of head volumes of spines contacted by different inputs. Gray line shows median of entire nonactive population. Asterisks denote significant differences between the head volumes contacted by a given input and the entire nonactive population.
Figure 6.

Anatomy does not predict functional connectivity. A, Axon density maps (left) are multiplied by spine density maps (middle) and normalized to generate maps of predicted synapse location (right). Boxed regions are one-dimensional profiles of y and x displacements. B, Probability distributions of predicted (lines) and measured (bars) synapse location as a function of vertical (y) displacement from the soma for each input. C, Measured cumulative probability distributions plotted against predicted cumulative probability distributions for each input in the y dimension. Dashed gray line indicates unity. Orange dots indicate L1/L2 border (closed) and soma (open). D, Correlation coefficients between measured and predicted distributions for each input in the y dimension. E, F, Similar to C and D but in the horizontal (x) dimension.
EPSP and uncaging-evoked EPSP (uEPSP) amplitudes were calculated as the average value over a 1 ms window around the peak. Ca signal amplitudes are averages over a 100 ms window starting 5 ms after the stimulus. Data in the text are reported as medians. SEs were calculated via bootstrap resampling (10,000 surrogates). Summary data in figures are in box-plot form, showing the median, interquartile range, and 10–90% range (whiskers). Average EPSPs, uEPSPs, and Ca signals are shown in figures as individual trials or mean ± SEM. Comparisons between groups were performed using the nonparametric Kruskal–Wallis test and post hoc Dunn–Holland–Wolfe test. All other comparisons were performed using the two-tailed Mann–Whitney rank-sum test. For correlated data, linear fits were produced via regression and reported as the r value. Statistical significance was defined as p < 0.05, with adjusted α for multiple-comparison tests.
Results
Anatomical organization of the prefrontal cortex
We studied the functional connections made by different long-range excitatory inputs onto L2 pyramidal neurons in the prelimbic area of the mouse mPFC. We first used whole-cell recordings to fill these neurons with the fluorescent dye Alexa Fluor 594 (40 μm) and two-photon microscopy to visualize their morphologies (Fig. 1A). Using high-resolution reconstructions (see Materials and Methods), we found that the dendrites extend from L1 to L2/3. The entire dendritic arbor was densely covered with spines, which receive the majority of glutamatergic inputs onto cortical pyramidal neurons (Nimchinsky et al., 2002; Yuste, 2011). Thus, while the cell bodies of these neurons are located near the L1/L2 border, their dendrites are positioned to receive inputs arriving in multiple layers.
Figure 1.

Anatomical overlap of axons, dendrites, and spines. A, Left, Two-photon image stack of an L2 pyramidal neuron. Dashed lines designate pia and L1/L2 border. Scale bar, 50 μm. Right, Magnified views of spines in L1 (top, blue) and L2/3 (bottom, green) from the boxed regions on left. Scale bars, 1 μm. B, Confocal images showing mCherry-labeled axons arriving from MD, cmPFC, BLA, and VH. To the right of each image is the average normalized fluorescent intensity profile as a function of distance from the pial surface (n = 6). Scale bar, 50 μm.
We next determined how different long-range excitatory inputs are distributed in the superficial layers of the mPFC. We labeled inputs from the MD, cmPFC, BLA, and VH using adeno-associated viruses (AAVs) expressing mCherry. After 2 weeks, we detected red fluorescence profiles from axons projecting in distinct patterns (Fig. 1B). Averaging these profiles from multiple slices (n = 6) revealed that MD projects moderately to L1 and strongly to L2/3, cmPFC projects primarily to L1 but also to L2/3, BLA projects to a narrow band within L2, and VH projects throughout L1 and L2/3. These different distributions are similar to those previously observed in other species (Krettek and Price, 1977; Sesack et al., 1989; Bouwmeester et al., 2002; Cenquizca and Swanson, 2007). The close anatomical overlap of axons, dendrites, and spines suggests that L2 pyramidal neurons may be able to sample diverse long-range excitatory inputs.
Functional connectivity at the cellular level
These anatomical findings suggest but do not prove connections between different inputs and L2 pyramidal neurons. Exploring functional connectivity is particularly challenging in the mPFC because most long-range excitatory inputs are severed in acute slices and cannot be electrically stimulated. To circumvent this problem, we used an optogenetic approach (Boyden et al., 2005), separately injecting AAVs expressing ChR2 into the MD, cmPFC, BLA, and VH. After 2 weeks, we prepared acute slices and measured light-evoked EPSCs at the soma of L2 pyramidal neurons (Petreanu et al., 2007). For these experiments, we triggered glutamate release from presynaptic axon terminals with brief wide-field illumination of blue light. We included TTX (1 μm) in our ACSF to block action potentials and polysynaptic activity. We also added both 4-AP (100 μm) and high Ca (4 mm) to restore presynaptic glutamate release. In voltage-clamp recordings at +40 mV, we found that all four inputs generated pronounced EPSCs (Fig. 2A). The NMDAR antagonist 3-((R)-2-Carboxypiperazin-4-yl)propyl-1-phosphonic acid (CPP; 10 μm) blocked the slow component of these responses (MD = 31% of control, n = 5; cmPFC = 31%, n = 8; BLA = 25%, n = 5; VH = 27%, n = 5) and the AMPA receptor (AMPAR) antagonist NBQX (10 μm) blocked the residual fast component (MD = 2% of control; cmPFC = 2%; BLA = 1%; VH = 2%) (Fig. 2B). The contributions of these glutamate receptors were similar between inputs, as indicated by their AMPA/NMDA ratios, which were not significantly different (Fig. 2C). These findings indicate that a variety of long-range excitatory inputs synapse onto L2 pyramidal neurons.
Figure 2.
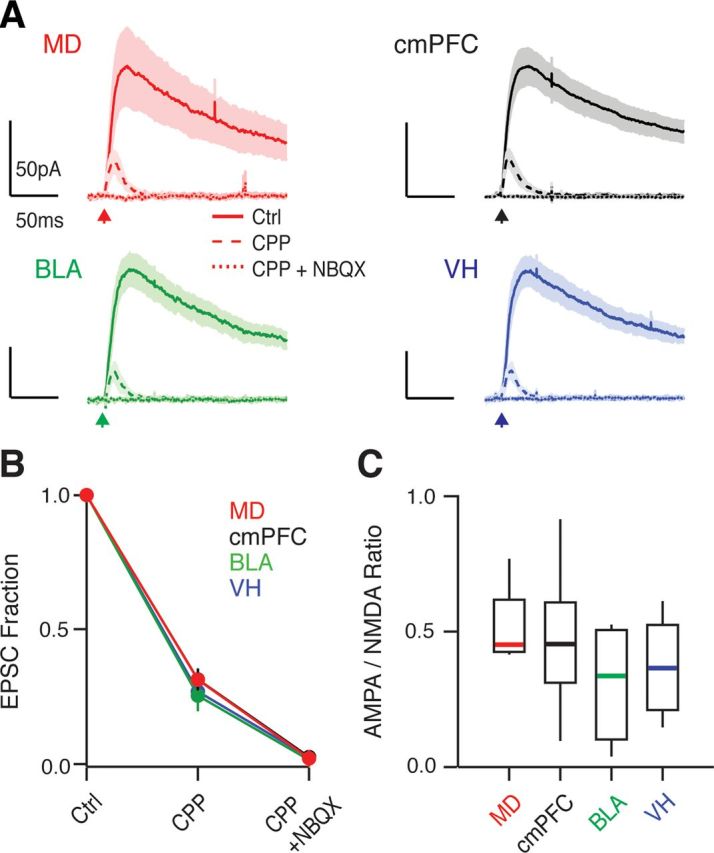
L2 pyramidal neurons receive diverse excitatory inputs. A, Average light-evoked EPSCs for the different inputs, recorded in voltage-clamp at +40 mV in control conditions (solid lines), after wash-in of 10 μm CPP (long-dash lines) and subsequent addition of 10 μm NBQX (short-dash lines). Arrows indicate the time of light pulses. B, Quantification of the data in A, expressed as a fraction of control EPSC for each condition. C, AMPA/NMDA ratios from the data in A.
Subcellular mapping of long-range inputs
Having established that different inputs converge onto L2 pyramidal neurons, we next investigated their subcellular properties. Demonstrating functional connections onto dendrites and spines has been challenging in neurons throughout the brain. Recently, optogenetic approaches have been used to map inputs in the dendrites of cortical pyramidal neurons (Petreanu et al., 2009; Mao et al., 2011). This approach is similar to mapping with one-photon uncaging and involves tiling a spot of light over the dendrites while measuring electrical responses at the soma (Callaway and Katz, 1993; Dalva and Katz, 1994; Shepherd et al., 2003, 2005; Yoshimura et al., 2005; Petreanu et al., 2007). However, the low resolution of the excitation light makes it challenging to map compact neurons and impossible to identify active spines.
To map subcellular connections onto L2 pyramidal neurons, we developed a novel approach that combines optogenetics with two-photon microscopy. Our rationale was to detect functional inputs by the synaptic Ca signals they generate in spines (Zhang and Oertner, 2007; Chen et al., 2011). In whole-cell recordings, we first filled neurons with Alexa Fluor 594 (40 μm) to visualize their morphology and Fluo-4FF (1 mm) to detect light-evoked Ca signals (Fig. 3A). Using two-photon microscopy, we then identified a stretch of dendrite possessing several spines in the same focal plane. While holding neurons at +10 mV, we triggered presynaptic release with a brief flash of focused blue light (see Materials and Methods). To identify postsynaptic spines, we initially detected Ca signals using relatively slow frame scans (8 Hz) (see Materials and Methods) (Fig. 3B). To confirm the presence of stimulus-locked Ca signals, we then sequentially imaged these spines and their inactive neighbors at higher temporal resolution with interleaved line scans (100–167 Hz) (see Materials and Methods) (Fig. 3C). Spines were determined to be contacted by a ChR2-expressing axon only when we detected Ca signals with both scanning types. This approach allowed us to unambiguously detect the presence of active spines within individual dendritic segments. By evenly mapping many segments across the dendrites (see Materials and Methods), we were routinely able to identify multiple active spines in each recorded neuron. For each segment, we acquired two-photon images to generate high-resolution reconstructions of spines. At the end of each recording, we also obtained two-photon images to reconstruct the entire dendritic arbor. These images allowed us to determine both the morphology of spines and their locations in the dendrites (Fig. 3D). Thus, despite the low resolution of our excitation light, using two-photon microscopy allowed us to map different functional inputs at high resolution.
Figure 3.
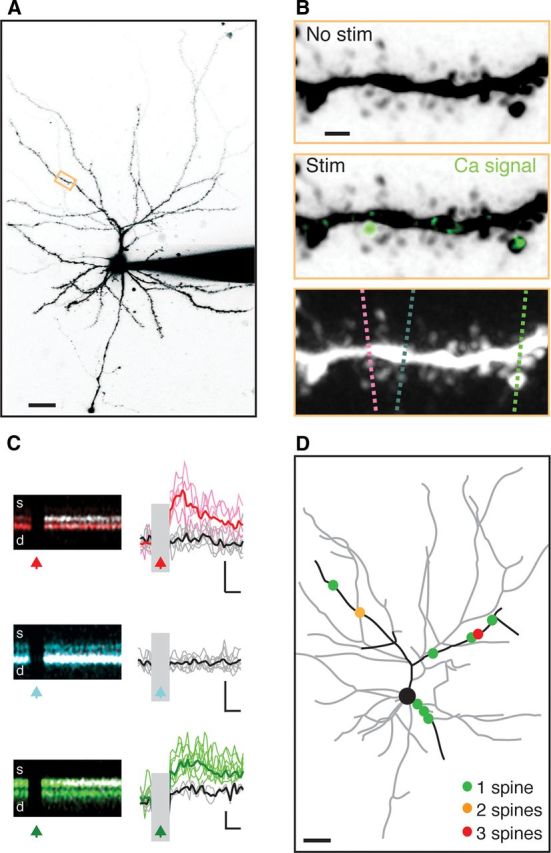
Mapping functional connections at the subcellular level. A, Two-photon image stack of an L2 pyramidal neuron. Scale bar, 30 μm. B, Top, Magnified view of the orange boxed region in A with no ChR2 stimulation. Middle, The same segment overlaid with ΔG/R signal (green) following ChR2 stimulation. Bottom, Positions of interleaved line scans through active spines (red and green) and a nearby neighbor (blue). Scale bar, 1 μm. C, Left, Individual line scans through spines (top) and dendrites (bottom) indicated in B, where morphology is color coded and Ca signals are white. Right, Quantified Ca signals, showing successes (color) and failures (black) of synaptic transmission at the three spines. Scale bar: top, middle = 0.25 ΔG/Gsat, 75 ms; bottom = 0.05 ΔG/Gsat, 75 ms. Arrows indicate stimulus times. D, Reconstruction of the recorded neuron, with sampled dendrites in black and active spines indicated by colored dots. Scale bar, 30 μm. Stim, Stimulation.
These subcellular mapping experiments depended on our ability to use synaptic Ca signals as a proxy for synaptic transmission. It was thus essential to establish that all spines have detectable Ca signals in response to glutamate. To test this, we held L2 pyramidal neurons under the same recording conditions, and used two-photon uncaging to activate randomly chosen spines in the same focal plane (Fig. 4A) (Carter and Sabatini, 2004; Sobczyk et al., 2005; Bloodgood and Sabatini, 2007; Chalifoux and Carter, 2010). We found that all sampled spines possessed prominent synaptic Ca signals (ΔG/Gsat = 0.14, n = 285). Importantly, the Ca signal amplitude did not change as a function of distance from the cell body (r = 0.03; p = 0.58) (Fig. 4B). Moreover, the SNR of these signals was always greater than our detection threshold (median = 5.8; threshold = 2). To assess any detection biases in our mapping experiments, we also quantified the presynaptic and postsynaptic properties of light-evoked Ca signals from our mapping experiments. We found that both Ca signal amplitude and probability of release were similar across all four inputs under our recording conditions (Fig. 4C). The presence of these robust Ca signals confirmed that they are an effective readout of functional connectivity at spines throughout the dendrites.
Figure 4.
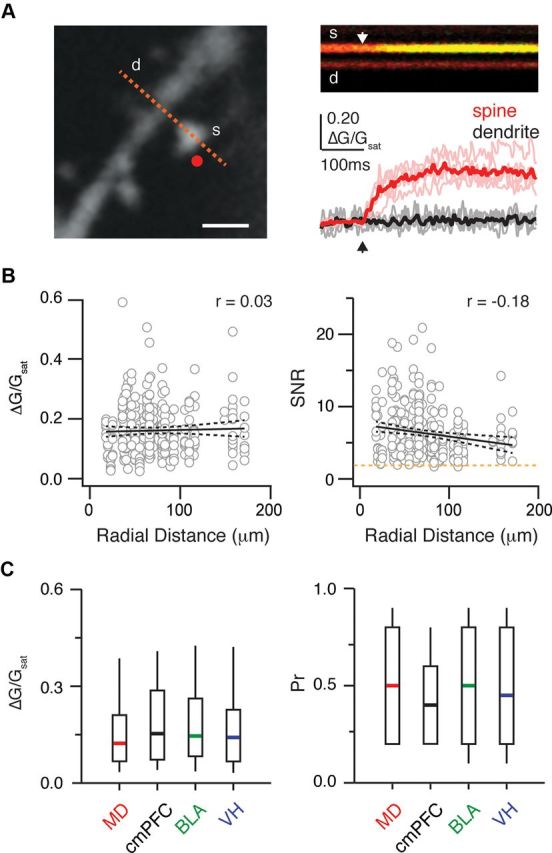
Unbiased detection of connections onto spines. A, Left, Two-photon image of dendrite (d) and spine (s), showing two-photon uncaging spot (red dot) and line-scan path (red dashed line). Scale bar, 1 μm. Top right, Example line scan showing morphology (red) and ΔG/R signal (green) in the spine and dendrite. White arrow indicates the uncaging time. Bottom right, Mean (thick lines) and individual (thin lines) ΔG/Gsat transients in the spine (red) and dendrite (black). Arrow indicates the uncaging time. B, Amplitudes (left) and SNR (right) of uncaging-evoked synaptic Ca signals as a function of radial distance from the soma. Solid and dashed lines represent linear fits and 5–95% confidence intervals, respectively. Orange dashed line indicates the detection threshold. Correlation coefficients (r values) are labeled in the upper right-hand corners. C, Left, Summary of light-evoked synaptic Ca signal amplitudes for each input from mapping experiments. Right, Summary of probability of release (Pr) for each input from these light-evoked synaptic Ca signals.
Dendritic locations of different long-range inputs
We used this combination of optogenetics and two-photon microscopy to determine the dendritic locations of long-range excitatory inputs onto L2 pyramidal neurons (Fig. 5A). Compiling multiple maps revealed that inputs from MD (n = 105), cmPFC (n = 115), BLA (n = 105) and VH (n = 97) each make targeted connections in the dendrites. Prominent differences were found in the vertical (y) displacement of active spines from the cell body (Fig. 5B). We found that MD inputs were concentrated on the distal dendrites in both superficial L1 and deep L2/3. In contrast, cmPFC and BLA inputs were focused in L2/3, at more proximal dendritic locations. Finally, VH inputs were more evenly distributed throughout deep L1 and L2/3. When quantifying the extent to which these different inputs form unique distributions in the dendrites (Fig. 5C), we found that the median vertical displacements were significantly different at the group level (Kruskal–Wallis test, p = 3.3 × 10⁻⁷). Most distributions were also significantly different from each other (Dunn–Holland–Wolfe test; MD vs cmPFC, p = 2.5 × 10⁻⁸; MD vs BLA, p = 8.2 × 10⁻¹¹; MD vs VH, p = 0.028; cmPFC vs VH, p = 0.023; BLA vs VH, p = 5.5 × 10⁻⁴), with the exception of cmPFC and BLA (p = 0.16) (Fig. 5D). In contrast, the distributions of horizontal (x) displacements were generally similar and focused close to the soma (Fig. 5E). The exception was MD, which had a substantial fraction of inputs lateral to the soma, consistent with their greater distance along the dendrites. Thus, only the MD distribution was significantly different from other inputs (Dunn–Holland–Wolfe test; MD vs cmPFC, p = 6.5 × 10⁻⁷; MD vs BLA, p = 6.3 × 10⁻⁷; MD vs VH, p = 1.1 × 10⁻⁵) (Fig. 5F). Importantly, the even sampling of dendrites that we used in our mapping experiments ensured that these differences do not reflect biased sampling of the dendrites (see Materials and Methods). Together, these results indicate that different inputs contact specific layers and dendritic locations in these relatively compact neurons.
Comparing measured and predicted locations
We next assessed the extent to which our initial anatomical descriptions of axons, dendrites, and spines predict the locations of functional connections in the dendrites. Our anterograde anatomy provided two-dimensional maps of axon density for each input (see Materials and Methods). Our high-resolution reconstructions also yielded two-dimensional maps of spine density for each neuron (see Materials and Methods). The product of these two maps provides a predicted distribution of synapse location at L2 pyramidal neurons (see Materials and Methods) (Fig. 6A). Comparing this distribution with the measured distribution of different inputs indicates how well anatomy alone reveals functional connectivity.
In the vertical (y) dimension, we found that the measured distributions generally failed to match the predicted distributions (Fig. 6B). These discrepancies were highlighted when plotting the measured and predicted cumulative distributions against each other (Fig. 6C). Inputs that are well predicted will fall along the diagonal of this plot, while those that are poorly predicted will deviate. Compared with their predictions, we found that measured MD inputs were much greater in L1, cmPFC inputs were slightly greater in L2/3, BLA inputs were much greater in deeper L2/3, and VH inputs were slightly greater in L1. To quantify these deviations, we determined the correlation coefficient between the measured and predicted distributions for each input. We found that correlations were relatively close to unity for cmPFC (r = 0.75 ± 0.06) and VH (r = 0.65 ± 0.07), but substantially lower for MD (r = 0.25 ± 0.09) and BLA (r = 0.31 ± 0.06) (Fig. 6D). In contrast, we found that the measured and predicted distributions generally matched when considering horizontal (x) displacement (Fig. 6E). The exception was again MD, whose inputs were located further from the soma horizontally than predicted by anatomy (r = 0.50 ± 0.07) (Fig. 6F). This is consistent with the more distant locations of MD inputs on L2 pyramidal neurons, which are consequently displaced in both dimensions. Together, these results demonstrate that functional connectivity is often not well predicted by anatomy alone and must be experimentally determined.
Spine targeting by different long-range inputs
Our results indicate that different inputs make selective connections throughout the dendrites of L2 pyramidal neurons. However, synaptic efficacy can also strongly correlate with the morphology of postsynaptic spines (Matsuzaki et al., 2001). Given the importance of morphology, we assessed whether different inputs also target unique spines in L2 pyramidal neurons. While the properties of these spines are usually difficult to determine, they are directly revealed by the two-photon images from our mapping experiments. To examine spine targeting, we first measured the head volumes of all imaged spines from these experiments (0.25 μm3, n = 14,625) (see Materials and Methods) (Fig. 7A). We found that spine morphology was heterogeneous throughout the dendrites of L2 pyramidal neurons, consistent with other brain regions (Arellano et al., 2007). However, there was no evidence for obvious grouping into distinct morphological categories, such as mushroom, stubby, or thin spines (Peters and Kaiserman-Abramof, 1970). Moreover, there was no correlation between head volume and vertical or horizontal displacement from the soma. These results indicate that we could not use our input maps to predict the morphologies of spines contacted by different inputs.
Instead, we used our high-resolution images to directly determine the morphologies of active spines contacted by different long-range excitatory inputs (Fig. 7B). While we observed a wide range of head volumes, we found that MD preferentially targeted large spines (median volume = 0.43 μm3, n = 105), cmPFC targeted small spines (0.26 μm3, n = 117), and BLA and VH targeted intermediate spines (BLA: 0.35 μm3, n = 100; VH: 0.37 μm3, n = 102) (Fig. 7C). The distributions of spine volumes were significantly different at the group level (Kruskal–Wallis test: p = 1.6 × 10⁻⁹). The spines targeted by MD, BLA, and VH inputs were also significantly different from the overall population (Mann–Whitney rank-sum test: MD, p = 2.0 × 10⁻⁸; BLA, p = 0.002; VH, p = 0.0095), while those contacted by cmPFC inputs were similar (p = 0.36) (Fig. 7D). These results indicate that long-range excitatory inputs also make selective contacts onto different populations of spines. Together, our mapping experiments revealed that functional connections onto L2 pyramidal neurons are targeted at both dendrites and spines.
Functional consequences of subcellular connectivity
In many neurons, inputs onto smaller spines or distal dendrites generate diminished synaptic responses at the soma (Rall, 1967; Matsuzaki et al., 2001; Williams and Stuart, 2002). However, these effects ultimately depend on the receptors, channels, and anatomical properties of particular neurons. Given their relatively compact dendrites, this influence may not occur in L2 pyramidal neurons (Jaffe and Carnevale, 1999). Moreover, in other pyramidal neurons, this influence can be compensated by postsynaptic properties (Magee and Cook, 2000). Thus, any relationship among spine morphology, dendritic location, and synaptic efficacy must be experimentally determined.
We used two-photon uncaging to assess how synaptic responses depend on the subcellular properties of L2 pyramidal neurons. In current-clamp recordings, we filled these neurons with Alexa Fluor 594 (40 μm) to image their dendrites and spines. We sequentially uncaged glutamate at four randomly chosen spines in a field of view and measured uEPSPs at the cell body (Fig. 8A). We used the same uncaging power and duration for all spines, regardless of morphology or location (see Materials and Methods). We restricted our analysis to spines in the superficial slice to maintain uncaging power at a standard value. In each cell, we sampled several dendritic segments at varying radial distances from the cell body (Fig. 8B). Within a single segment, we found substantial variability in the amplitudes of uEPSPs generated at nearby spines. However, using high-resolution reconstructions of each segment, we found that uEPSP amplitude increased with spine volume (r = 0.41, p = 2.5 × 10⁻⁸, n = 179) (Fig. 8C). Thus, excitatory inputs arriving on larger spines will have a greater impact on the somatic potential. Using reconstructions of the dendritic arbor, we also found that uEPSP amplitude decreased with distance from the soma (r = −0.31, p = 4.9 × 10⁻⁶, n = 204) (Fig. 8D). Therefore, excitatory inputs at proximal locations will also have a greater impact on the somatic potential. These results indicate that subcellular connectivity will strongly impact synaptic efficacy measured at the soma.
Our results suggest that selective targeting of different long-range inputs could have a powerful impact on synaptic responses. To assess this influence, we combined the results from our mapping and uncaging experiments to predict the amplitude of unitary EPSPs generated by different inputs (see Materials and Methods). We found that all four inputs generated equivalent responses that were similar to the average response expected with no selective targeting (Fig. 8E). We then assessed the contributions of spine morphology and location to these predicted responses. When we replaced the input-specific distributions of head volume with the distribution for all spines, we found that MD, BLA, and VH inputs evoked significantly smaller unitary EPSPs. In contrast, when we replaced the input-specific distributions of location with the distribution for all spines, we found that these inputs instead generated significantly larger unitary EPSPs. Together, these results indicate that both spine morphology and location strongly impact the synaptic efficacy of different long-range inputs to L2 pyramidal neurons in the mPFC.
Discussion
We have studied the functional connections made by long-range excitatory inputs onto L2 pyramidal neurons in the mouse mPFC. We first used optogenetics to show that these neurons receive a wide range of inputs from other brain regions. We then used a combination of optogenetics and two-photon microscopy to study the subcellular properties of these inputs. We found that each input synapses at different dendritic locations, which are often poorly predicted by anatomy alone. We also found that each input contacts populations of spines with different morphological distributions. Using two-photon uncaging, we showed that both levels of subcellular targeting strongly influence synaptic efficacy. Our results reveal that different long-range excitatory inputs make targeted and unpredicted functional connections onto L2 pyramidal neurons.
The mPFC plays a critical role in the learning and expression of multiple cognitive and emotional behaviors (Goldman-Rakic, 1995; Fuster, 2008). Excitatory inputs from the MD, cmPFC, BLA, and VH carry distinct functional signals to the mPFC (Kolb, 1984; Vertes, 2006). Our initial anatomical observations indicated that these inputs could make different connections onto L2 pyramidal neurons. However, the overlap of axons and dendrites does not necessarily imply the formation of functional synapses (Shepherd et al., 2005; Stepanyants and Chklovskii, 2005). We then used optogenetics to show that diverse inputs make synaptic contacts with L2 pyramidal neurons. Each input generates EPSCs mediated by both AMPARs and NMDARs, leading to similar AMPA/NMDA ratios. The ability to activate NMDARs was important for our subcellular mapping experiments, as Ca influx through these receptors was used ultimately to identify functional connections. Our findings indicate that L2 pyramidal neurons can process a variety of excitatory inputs from other brain regions. In the future, the use of spectrally separated optogenetic tools may allow interactions between different inputs to be explored in the same neuron (Yizhar et al., 2011).
Motivated by our finding of functional connections at the cellular level, we developed a combination of optogenetics and two-photon microscopy to study selective targeting at the levels of dendrites and spines. Our rationale was to use synaptic Ca signals to detect functional connections at the single-spine level (Zhang and Oertner, 2007; Chen et al., 2011). The resolution of the one-photon excitation light was relatively low, and normally would not allow us to detect active spines (Petreanu et al., 2009; Mao et al., 2011). However, the resolution of two-photon microscopy is extremely high, enabling mapping at the micrometer scale (Yuste and Denk, 1995; Denk and Svoboda, 1997; Zhang and Oertner, 2007; Chen et al., 2011). With this approach, we identified spines activated by different inputs to L2 pyramidal neurons. Importantly, these Ca signals do not diminish with distance, avoiding space-clamp errors that can complicate electrical signals (Spruston et al., 1993). This combination of optogenetics and two-photon microscopy is a powerful way to map functional connectivity. Complementary approaches to identify subcellular contacts include serial electron microscopy (Briggman and Denk, 2006) and novel fluorescent indicators (Kim et al., 2012). In the future, these and other approaches will continue to enable the identification of selective targeting onto the dendrites and spines of neurons throughout the brain.
Our mapping experiments revealed that each input makes targeted connections in the dendrites of L2 pyramidal neurons. The distributions of these inputs were different from each other, suggesting that they may play unique functional roles. In several cases, the distributions of inputs did not qualitatively agree with the laminar profiles of axonal projections in the mPFC. For example, MD axon density was moderate in L1 and greatest in L2/3; however, MD inputs peaked in L1 and were relatively sparse in superficial L2/3. In principle, the product of axon and spine densities should serve as a more accurate predictor of input location. However, this more quantitative analysis usually failed to predict the connections made by different inputs, and instead confirmed our qualitative assessments. Thus, we found that comparing the distributions of axons, dendrites and spines cannot be used to identify synaptic contacts. This is consistent with studies showing that anatomical proximity often does not equate with functional connectivity (Shepherd et al., 2005; Stepanyants and Chklovskii, 2005).
Our mapping experiments also revealed the distributions of spines contacted by different long-range inputs. Because there was no relationship between spine morphology and distance from the soma, it was not possible to use our location maps to predict differences in spine targeting. Instead, we directly compared the morphologies of spines targeted by different inputs using high-resolution reconstructions of our two-photon images. We found that inputs from different brain regions target spines with a wide range of morphologies, consistent with results from other cortical L2/3 pyramidal neurons (Arellano et al., 2007). We saw no evidence that spines fall into clear morphological categories (Peters and Kaiserman-Abramof, 1970). However, inputs from BLA, VH, and MD, in particular, preferentially targeted spines with large head volumes. In contrast, cmPFC inputs targeted spines that are similar in morphology to the overall population. The targeting of these inputs is similar to that seen in the amygdala (Humeau et al., 2005), but contrasts with other cortical areas (Richardson et al., 2009). Together, these results indicate that different inputs selectively contact spines with distinct morphological distributions. In the future, it will be interesting to identify the spines contacted by other excitatory inputs, including those from the local circuit.
In many neurons, both the location and morphology of spines have been shown to strongly influence synaptic efficacy (Rall, 1967; Matsuzaki et al., 2001; Williams and Stuart, 2002). However, the impact of distance can be compensated (Magee and Cook, 2000) and may be reduced in smaller neurons (Jaffe and Carnevale, 1999). We used two-photon uncaging to show that efficacy decreases with distance from the soma in L2 pyramidal neurons. Because MD inputs target the more distal dendrites, their influence on the somatic potential could be diminished. However, these same experiments also demonstrate that efficacy correlates with spine head volume in these neurons. Because MD inputs also connect with larger spines, their influence at the soma is ultimately restored. Indeed, the unitary EPSPs predicted for MD, cmPFC, BLA, and VH inputs are equivalent and closely match the average response expected for all spines. Moreover, this alignment is perturbed when either level of subcellular targeting is not included in the predictions. This unexpected reciprocal relationship between spine morphology and location allows diverse long-range excitatory inputs to influence L2 pyramidal neurons.
Finally, our results have important implications for how changes in subcellular connectivity may contribute to neuropsychiatric diseases associated with the mPFC. For example, schizophrenia may result from impairment of interactions of the mPFC with multiple other brain regions (Egan and Weinberger, 1997; Arnsten, 2011). Schizophrenia is also associated with dendritic pathologies, including changes in spine density and morphology (Garey et al., 1998; Glantz and Lewis, 2000; Lee et al., 2011). We have shown subcellular targeting onto dendrites and spines strongly influences synaptic efficacy in L2 pyramidal neurons. Thus, pathological changes in dendrite and spine targeting could dramatically alter the balance of neuronal activity in the mPFC. In the future, studying the rewiring of subcellular connectivity may provide new insights into the causes of schizophrenia, drug addiction, and other neuropsychiatric diseases.
Footnotes
This work was supported by the Whitehall Foundation, the Dana Foundation, the McKnight Foundation, and NIH Grant R01-MH085974 (A.G.C.). We thank members of the Carter laboratory for helpful discussions and comments on the manuscript; Eero Simoncelli and Jeremy Freeman for advice on image analysis; and Adam Weiss for help with programming.
The authors declare they have no financial conflicts of interest.
References
- Arellano JI, Benavides-Piccione R, Defelipe J, Yuste R. Ultrastructure of dendritic spines: correlation between synaptic and spine morphologies. Front Neurosci. 2007;1:131–143. doi: 10.3389/neuro.01.1.1.010.2007. [DOI] [PMC free article] [PubMed] [Google Scholar]
- Arnsten AF. Prefrontal cortical network connections: key site of vulnerability in stress and schizophrenia. Int J Dev Neurosci. 2011;29:215–223. doi: 10.1016/j.ijdevneu.2011.02.006. [DOI] [PMC free article] [PubMed] [Google Scholar]
- Bloodgood BL, Sabatini BL. Nonlinear regulation of unitary synaptic signals by CaV(2.3) voltage-sensitive calcium channels located in dendritic spines. Neuron. 2007;53:249–260. doi: 10.1016/j.neuron.2006.12.017. [DOI] [PubMed] [Google Scholar]
- Bouwmeester H, Wolterink G, van Ree JM. Neonatal development of projections from the basolateral amygdala to prefrontal, striatal, and thalamic structures in the rat. J Comp Neurol. 2002;442:239–249. doi: 10.1002/cne.10084. [DOI] [PubMed] [Google Scholar]
- Boyden ES, Zhang F, Bamberg E, Nagel G, Deisseroth K. Millisecond-timescale, genetically targeted optical control of neural activity. Nat Neurosci. 2005;8:1263–1268. doi: 10.1038/nn1525. [DOI] [PubMed] [Google Scholar]
- Briggman KL, Denk W. Towards neural circuit reconstruction with volume electron microscopy techniques. Curr Opin Neurobiol. 2006;16:562–570. doi: 10.1016/j.conb.2006.08.010. [DOI] [PubMed] [Google Scholar]
- Callaway EM, Katz LC. Photostimulation using caged glutamate reveals functional circuitry in living brain slices. Proc Natl Acad Sci U S A. 1993;90:7661–7665. doi: 10.1073/pnas.90.16.7661. [DOI] [PMC free article] [PubMed] [Google Scholar]
- Carter AG, Sabatini BL. State-dependent calcium signaling in dendritic spines of striatal medium spiny neurons. Neuron. 2004;44:483–493. doi: 10.1016/j.neuron.2004.10.013. [DOI] [PubMed] [Google Scholar]
- Cenquizca LA, Swanson LW. Spatial organization of direct hippocampal field CA1 axonal projections to the rest of the cerebral cortex. Brain Res Rev. 2007;56:1–26. doi: 10.1016/j.brainresrev.2007.05.002. [DOI] [PMC free article] [PubMed] [Google Scholar]
- Chalifoux JR, Carter AG. GABAB receptors modulate NMDA receptor calcium signals in dendritic spines. Neuron. 2010;66:101–113. doi: 10.1016/j.neuron.2010.03.012. [DOI] [PMC free article] [PubMed] [Google Scholar]
- Chalifoux JR, Carter AG. Glutamate spillover promotes the generation of NMDA spikes. J Neurosci. 2011;31:16435–16446. doi: 10.1523/JNEUROSCI.2777-11.2011. [DOI] [PMC free article] [PubMed] [Google Scholar]
- Chen X, Leischner U, Rochefort NL, Nelken I, Konnerth A. Functional mapping of single spines in cortical neurons in vivo. Nature. 2011;475:501–505. doi: 10.1038/nature10193. [DOI] [PubMed] [Google Scholar]
- Dalva MB, Katz LC. Rearrangements of synaptic connections in visual cortex revealed by laser photostimulation. Science. 1994;265:255–258. doi: 10.1126/science.7912852. [DOI] [PubMed] [Google Scholar]
- Denk W, Svoboda K. Photon upmanship: why multiphoton imaging is more than a gimmick. Neuron. 1997;18:351–357. doi: 10.1016/s0896-6273(00)81237-4. [DOI] [PubMed] [Google Scholar]
- Douglas RJ, Martin KA. Neuronal circuits of the neocortex. Annu Rev Neurosci. 2004;27:419–451. doi: 10.1146/annurev.neuro.27.070203.144152. [DOI] [PubMed] [Google Scholar]
- Dumitriu D, Rodriguez A, Morrison JH. High-throughput, detailed, cell-specific neuroanatomy of dendritic spines using microinjection and confocal microscopy. Nat Protoc. 2011;6:1391–1411. doi: 10.1038/nprot.2011.389. [DOI] [PMC free article] [PubMed] [Google Scholar]
- Egan MF, Weinberger DR. Neurobiology of schizophrenia. Curr Opin Neurobiol. 1997;7:701–707. doi: 10.1016/s0959-4388(97)80092-x. [DOI] [PubMed] [Google Scholar]
- Fuster JM. The prefrontal cortex. Ed 4. London: Academic; 2008. [Google Scholar]
- Garey LJ, Ong WY, Patel TS, Kanani M, Davis A, Mortimer AM, Barnes TR, Hirsch SR. Reduced dendritic spine density on cerebral cortical pyramidal neurons in schizophrenia. J Neurol Neurosurg Psychiatry. 1998;65:446–453. doi: 10.1136/jnnp.65.4.446. [DOI] [PMC free article] [PubMed] [Google Scholar]
- Glantz LA, Lewis DA. Decreased dendritic spine density on prefrontal cortical pyramidal neurons in schizophrenia. Arch Gen Psychiatry. 2000;57:65–73. doi: 10.1001/archpsyc.57.1.65. [DOI] [PubMed] [Google Scholar]
- Goldman-Rakic PS. Cellular basis of working memory. Neuron. 1995;14:477–485. doi: 10.1016/0896-6273(95)90304-6. [DOI] [PubMed] [Google Scholar]
- Hoover WB, Vertes RP. Anatomical analysis of afferent projections to the medial prefrontal cortex in the rat. Brain Struct Funct. 2007;212:149–179. doi: 10.1007/s00429-007-0150-4. [DOI] [PubMed] [Google Scholar]
- Humeau Y, Herry C, Kemp N, Shaban H, Fourcaudot E, Bissière S, Lüthi A. Dendritic spine heterogeneity determines afferent-specific Hebbian plasticity in the amygdala. Neuron. 2005;45:119–131. doi: 10.1016/j.neuron.2004.12.019. [DOI] [PubMed] [Google Scholar]
- Jaffe DB, Carnevale NT. Passive normalization of synaptic integration influenced by dendritic architecture. J Neurophysiol. 1999;82:3268–3285. doi: 10.1152/jn.1999.82.6.3268. [DOI] [PubMed] [Google Scholar]
- Kim J, Zhao T, Petralia RS, Yu Y, Peng H, Myers E, Magee JC. mGRASP enables mapping mammalian synaptic connectivity with light microscopy. Nat Methods. 2012;9:96–102. doi: 10.1038/nmeth.1784. [DOI] [PMC free article] [PubMed] [Google Scholar]
- Kolb B. Functions of the frontal cortex of the rat: a comparative review. Brain Res. 1984;320:65–98. doi: 10.1016/0165-0173(84)90018-3. [DOI] [PubMed] [Google Scholar]
- Krettek JE, Price JL. The cortical projections of the mediodorsal nucleus and adjacent thalamic nuclei in the rat. J Comp Neurol. 1977;171:157–191. doi: 10.1002/cne.901710204. [DOI] [PubMed] [Google Scholar]
- Lee FH, Fadel MP, Preston-Maher K, Cordes SP, Clapcote SJ, Price DJ, Roder JC, Wong AH. Disc1 point mutations in mice affect development of the cerebral cortex. J Neurosci. 2011;31:3197–3206. doi: 10.1523/JNEUROSCI.4219-10.2011. [DOI] [PMC free article] [PubMed] [Google Scholar]
- Magee JC, Cook EP. Somatic EPSP amplitude is independent of synapse location in hippocampal pyramidal neurons. Nat Neurosci. 2000;3:895–903. doi: 10.1038/78800. [DOI] [PubMed] [Google Scholar]
- Mao T, Kusefoglu D, Hooks BM, Huber D, Petreanu L, Svoboda K. Long-range neuronal circuits underlying the interaction between sensory and motor cortex. Neuron. 2011;72:111–123. doi: 10.1016/j.neuron.2011.07.029. [DOI] [PMC free article] [PubMed] [Google Scholar]
- Markram H, Lübke J, Frotscher M, Roth A, Sakmann B. Physiology and anatomy of synaptic connections between thick tufted pyramidal neurones in the developing rat neocortex. J Physiol. 1997;500:409–440. doi: 10.1113/jphysiol.1997.sp022031. [DOI] [PMC free article] [PubMed] [Google Scholar]
- Matsuzaki M, Ellis-Davies GC, Nemoto T, Miyashita Y, Iino M, Kasai H. Dendritic spine geometry is critical for AMPA receptor expression in hippocampal CA1 pyramidal neurons. Nat Neurosci. 2001;4:1086–1092. doi: 10.1038/nn736. [DOI] [PMC free article] [PubMed] [Google Scholar]
- Nimchinsky EA, Sabatini BL, Svoboda K. Structure and function of dendritic spines. Annu Rev Physiol. 2002;64:313–353. doi: 10.1146/annurev.physiol.64.081501.160008. [DOI] [PubMed] [Google Scholar]
- Peters A, Kaiserman-Abramof IR. The small pyramidal neuron of the rat cerebral cortex. The perikaryon, dendrites and spines. Am J Anat. 1970;127:321–355. doi: 10.1002/aja.1001270402. [DOI] [PubMed] [Google Scholar]
- Petreanu L, Huber D, Sobczyk A, Svoboda K. Channelrhodopsin-2-assisted circuit mapping of long-range callosal projections. Nat Neurosci. 2007;10:663–668. doi: 10.1038/nn1891. [DOI] [PubMed] [Google Scholar]
- Petreanu L, Mao T, Sternson SM, Svoboda K. The subcellular organization of neocortical excitatory connections. Nature. 2009;457:1142–1145. doi: 10.1038/nature07709. [DOI] [PMC free article] [PubMed] [Google Scholar]
- Rall W. Distinguishing theoretical synaptic potentials computed for different soma-dendritic distributions of synaptic input. J Neurophysiol. 1967;30:1138–1168. doi: 10.1152/jn.1967.30.5.1138. [DOI] [PubMed] [Google Scholar]
- Richardson RJ, Blundon JA, Bayazitov IT, Zakharenko SS. Connectivity patterns revealed by mapping of active inputs on dendrites of thalamorecipient neurons in the auditory cortex. J Neurosci. 2009;29:6406–6417. doi: 10.1523/JNEUROSCI.0258-09.2009. [DOI] [PMC free article] [PubMed] [Google Scholar]
- Sesack SR, Deutch AY, Roth RH, Bunney BS. Topographical organization of the efferent projections of the medial prefrontal cortex in the rat: an anterograde tract-tracing study with Phaseolus vulgaris leucoagglutinin. J Comp Neurol. 1989;290:213–242. doi: 10.1002/cne.902900205. [DOI] [PubMed] [Google Scholar]
- Shepherd GM, Pologruto TA, Svoboda K. Circuit analysis of experience-dependent plasticity in the developing rat barrel cortex. Neuron. 2003;38:277–289. doi: 10.1016/s0896-6273(03)00152-1. [DOI] [PubMed] [Google Scholar]
- Shepherd GM, Stepanyants A, Bureau I, Chklovskii D, Svoboda K. Geometric and functional organization of cortical circuits. Nat Neurosci. 2005;8:782–790. doi: 10.1038/nn1447. [DOI] [PubMed] [Google Scholar]
- Sobczyk A, Scheuss V, Svoboda K. NMDA receptor subunit-dependent [Ca2+] signaling in individual hippocampal dendritic spines. J Neurosci. 2005;25:6037–6046. doi: 10.1523/JNEUROSCI.1221-05.2005. [DOI] [PMC free article] [PubMed] [Google Scholar]
- Spruston N. Pyramidal neurons: dendritic structure and synaptic integration. Nat Rev Neurosci. 2008;9:206–221. doi: 10.1038/nrn2286. [DOI] [PubMed] [Google Scholar]
- Spruston N, Jaffe DB, Williams SH, Johnston D. Voltage- and space-clamp errors associated with the measurement of electrotonically remote synaptic events. J Neurophysiol. 1993;70:781–802. doi: 10.1152/jn.1993.70.2.781. [DOI] [PubMed] [Google Scholar]
- Stepanyants A, Chklovskii DB. Neurogeometry and potential synaptic connectivity. Trends Neurosci. 2005;28:387–394. doi: 10.1016/j.tins.2005.05.006. [DOI] [PubMed] [Google Scholar]
- Vertes RP. Interactions among the medial prefrontal cortex, hippocampus and midline thalamus in emotional and cognitive processing in the rat. Neuroscience. 2006;142:1–20. doi: 10.1016/j.neuroscience.2006.06.027. [DOI] [PubMed] [Google Scholar]
- Williams SR, Stuart GJ. Dependence of EPSP efficacy on synapse location in neocortical pyramidal neurons. Science. 2002;295:1907–1910. doi: 10.1126/science.1067903. [DOI] [PubMed] [Google Scholar]
- Yizhar O, Fenno LE, Prigge M, Schneider F, Davidson TJ, O'Shea DJ, Sohal VS, Goshen I, Finkelstein J, Paz JT, Stehfest K, Fudim R, Ramakrishnan C, Huguenard JR, Hegemann P, Deisseroth K. Neocortical excitation/inhibition balance in information processing and social dysfunction. Nature. 2011;477:171–178. doi: 10.1038/nature10360. [DOI] [PMC free article] [PubMed] [Google Scholar]
- Yoshimura Y, Dantzker JL, Callaway EM. Excitatory cortical neurons form fine-scale functional networks. Nature. 2005;433:868–873. doi: 10.1038/nature03252. [DOI] [PubMed] [Google Scholar]
- Yuste R. Dendritic spines and distributed circuits. Neuron. 2011;71:772–781. doi: 10.1016/j.neuron.2011.07.024. [DOI] [PMC free article] [PubMed] [Google Scholar]
- Yuste R, Denk W. Dendritic spines as basic functional units of neuronal integration. Nature. 1995;375:682–684. doi: 10.1038/375682a0. [DOI] [PubMed] [Google Scholar]
- Zhang YP, Oertner TG. Optical induction of synaptic plasticity using a light-sensitive channel. Nat Methods. 2007;4:139–141. doi: 10.1038/nmeth988. [DOI] [PubMed] [Google Scholar]