

Abstract
The effective population size (Ne) is proportional to the loss of genetic diversity and the rate of inbreeding, and its accurate estimation is crucial for the monitoring of small populations. Here, we integrate temporal studies of the gecko Oedura reticulata, to compare genetic and demographic estimators of Ne. Because geckos have overlapping generations, our goal was to demographically estimate NbI, the inbreeding effective number of breeders and to calculate the NbI/Na ratio (Na = number of adults) for four populations. Demographically estimated NbI ranged from 1 to 65 individuals. The mean reduction in the effective number of breeders relative to census size (NbI/Na) was 0.1 to 1.1. We identified the variance in reproductive success as the most important variable contributing to reduction of this ratio. We used four methods to estimate the genetic based inbreeding effective number of breeders NbI(gen) and the variance effective populations size NeV(gen) estimates from the genotype data. Two of these methods - a temporal moment-based (MBT) and a likelihood-based approach (TM3) require at least two samples in time, while the other two were single-sample estimators - the linkage disequilibrium method with bias correction LDNe and the program ONeSAMP. The genetic based estimates were fairly similar across methods and also similar to the demographic estimates excluding those estimates, in which upper confidence interval boundaries were uninformative. For example, LDNe and ONeSAMP estimates ranged from 14–55 and 24–48 individuals, respectively. However, temporal methods suffered from a large variation in confidence intervals and concerns about the prior information. We conclude that the single-sample estimators are an acceptable short-cut to estimate NbI for species such as geckos and will be of great importance for the monitoring of species in fragmented landscapes.
Introduction
The effective population size (Ne), which is inversely related to the rate of loss of genetic diversity through genetic drift and inbreeding [1], is one of the most essential parameter in population genetics, evolutionary ecology, and conservation biology [2], [3], [4], [5], [6], [7]. Habitat fragmentation leads to small, isolated populations that are susceptible to the fixation of deleterious alleles, inbreeding depression, and local extinction [8]. In addition, Ne is affected by life histories, population dynamics, and demographic history of individuals [9], [10], [11], [12] and the exact nature of the relationship between demographic and genetic Ne is unknown and will vary between species and populations. Monitoring Ne would provide an excellent tool for monitoring the status of fragmented populations of conservation concern [7], [11], [12].
Effective population sizes have been estimated using both genetic and demographic approaches, but only rarely in combination [10], [13], [14]. Primarily, this is because it has been extremely difficult to estimate demographic effective population size Ne(demo) in natural populations. However, recent developments in theory and in analytical tools have simplified the analysis of demographic parameters and made possible more robust estimation of Ne(demo) [2], [3], [15], [16], [17], [18], [19].
In populations with overlapping generations, demographic based approaches usually focus on estimation of the effective number of breeders, which is the effective size of a breeding population in a given year [2]. Estimating Ne can be complex because methods that account for age structure either require long-term studies in which a population is sampled annually for several generations [20] or restrictive assumptions (such as stable age structure, age-independent variance in reproductive success, random mortality within all age classes) must be met when analysing the data [18], [19], [21], [22].
Variation in four main life history and population traits (sex ratio; variance in individual reproductive success; age structure; and fluctuating population size) can reduce the effective number of reproducing individuals Ne(demo) below the number of sexually mature adults (Na) in a population [2], [3], [10], [13], [18], [23]. Of these variables, estimating the variance in individual reproductive success and accounting for age-structure provide particular challenges. In the past, variance in individual reproductive success could only be obtained from intensive long-term studies of individually known animals [9]. More recently, polymorphic genetic markers, such as microsatellite loci, have been used to measure individual reproductive success by directly assigning offspring to parents through the comparison of genotypes [13], [17], [24], [25], [26]. The genetic approach can be enormously powerful, but failing to sample all potential parents and assignment errors can potentially bias the estimate of relative reproductive success [27], [28].
Numerous procedures for estimating Ne(gen) from genetic data have been developed [26], [29], [30], [31], [32], [33], [34], [35], [36], [37]. By far the most common is the temporal approach, which estimates variance effective population size NeV and is based on the idea that allele frequencies will differ between samples taken at two different times from the same population as a result of random genetic drift. The amount by which they will differ is inversely proportional to effective population size. In addition to the F-statistic estimators [2], [23], [38], [39] several likelihood-based approaches have been developed, which require temporal data, but have increased accuracy because they incorporate a greater proportion of the available data [29], [35], [40]. Surprisingly, methods for estimating the effective population size that require only a single sample in time have only been applied in recent years because they were often imprecise and biased [30], [32], [33], [34]. Accurate single sample approaches would be advantageous in the analysis of long-lived species for which two or more samples collected at least a generation apart may take many years or even decades to gather [41]. The standard linkage disequilibrium method (LDNe) [30], [34], [42] is the most frequently used single sample method. Another recently developed point estimator is implemented in the program ONeSAMP and uses summary statistics and approximate Bayesian computation to estimate effective population size [33]. If a single cohort has been sampled, both methods are directly related to inbreeding NbI, which predicts the rate of decrease in heterozygosity. However, their relationship to NbI and Ne is less clear should more than a single cohort of adults be sampled, as in this study [43] and neither method should be expected to exactly reproduce NbI Variance and inbreeding Ne can also converge in empirical studies and are usually not distinguished in practice [4], [44]. However, they will differ depending on whether populations are increasing or decreasing [45].
Empirical tests of numerous genetic approaches to estimating Ne and Nb are essential if we are to fully evaluate their usefulness in different situations. Such evaluations are difficult, not least of all for species with long life spans and slow reproductive histories because obtaining the necessary temporal population demographic and genetic information as well as estimates of reproductive success is extremely difficult. Here, we report on a comparative empirical study in which we estimate Na (adult population size) in four Western Australian populations of the reticulated velvet gecko (Oedura reticulata). We take advantage of extensive long-term demographic data [46], [47], [48] and microsatellite DNA analyses to estimate the genetic temporal and single-sample effective population size. We also estimate the inbreeding number of breeders using the demographic parameter NbI and assess which parameters are responsible for the decrease relative to census size. We focus on estimating Nb because the estimation of Ne is extremely difficult for long live species [2]. Specifically, it would require that the life-time reproductive success of all individuals in each population be known. Those data are not available for the populations in question.
As a result of similar territorial behaviour in male and female geckos, we predict that sex ratio will influence the inbreeding number of breeders (NbI) only marginally and that variance in reproductive success will reduce NbI more strongly. As part of our analysis, we use an approach to estimating the variance in reproductive success that accounts for incomplete sampling. Finally, we evaluate the genetic estimates of NbI and NeV derived from single and temporal population microsatellite studies against demographic based population estimates of NbI and adult population size Na. We base this evaluation on whether the genetic estimates could be obtained and were consistent among methods and whether confidence intervals were informative.
Methods
Study Species
Oedura reticulata is endemic to the southwest of Western Australia and is a habitat specialist. It is limited in its range of habitat, being exclusively arboreal and restricted to smooth-barked Eucalyptus woodlands [49]. Males mature one year earlier than females, usually reproducing for the first time at an age of 3.8 years (compared with 4.8 years in females) but adult mortality is similar for both sexes [46], [49].
Study Area and Sampling
The study area is located between Kellerberrin and Trayning in the Western Australian wheatbelt. Large areas of native vegetation have been removed from this region and replaced by agricultural crops, pastures, and livestock. Since 1900, approximately 93% of the original vegetation has been cleared, with the remnant vegetation distributed over thousands of patches of varying size. The study species occurs in small woodland remnants that are separated from other remnants by expanses of land cleared for agriculture. The species has been subjected to severe population fragmentation [50]. Four populations (ORF1, ORF3, ORF7, ORF8) were selected (Figure 1) for comparative purposes based on the fact that tissue samples and demographic data were collected concurrently in time [51], [52], [53], [54].
Figure 1. Map of the study area and location of sites in the Western Australian wheatbelt.

O. reticulata populations inhabit fragments ORF1, ORF3, ORF7, and ORF8.
The field sampling and population estimates were conducted from 1989 to 1991 and from November 2000 to March 2002. Geckos were spotted at night using head-torches and captured by hand during 5–7 sampling sessions (consecutive nights). Each animal was marked individually by clipping the tip of the toe, a standard procedure in lizards [55], [56], for which no negative effects have been detected in other studies [57], [58]. Each sampling session lasted for up to four hours after sunset. The tip of the tail of each individual sampled was removed and stored in liquid nitrogen. Snout-vent length, body mass, sex, and age were recorded for all individuals. Sex can be accurately determined based on the shape of the tail base and the presence/absence of pre-anal pores in sexually mature individuals of both species. All procedures involving animals were carried out according to the ‘Australian Code of Practise for the Care and Use of Animals for Scientific Purposes’ and were approved by the University of Canberra Animal Ethics Committee (CEAE # 02/13 and 05/17). Permits to take Fauna was given by the Department of Conservation and Land Management (CALM Licence # SF004040.).
Census Population Size
We estimated adult (Na) and adult female (Nf) population size with models for closed populations, using program CAPTURE. In studies with adequate data, the assumptions about capture probability are more flexible when using CAPTURE. We estimated adult male population size (Nm) as the difference of the estimates of Na and Nf. The closure assumption required by CAPTURE is reasonable because movement between isolated habitat fragments is rare [50], [54] and deaths are unlikely in the time span of one week given the high life expectancy of the gecko species [46]. CAPTURE incorporates seven models that allow for time-dependence (model Mt), trap response (model Mb), and individual variation (model Mh) of capture probabilities as well as all combinations thereof, except for model Mtbh [59]. The discriminant function of CAPTURE to select an appropriate estimation model has limited performance, especially when population sizes are small [60], [61]. Therefore, we also inspected individual model tests and whether confidence intervals were suspiciously small. Individual tests and model selection suggested model M0 in most cases. In the six remaining cases the confidence intervals of the selected models were suspiciously small and no biological evidence was available that justified differences in the capture process. Therefore, we used M0 for all data sets.
Demographic Estimates of NbI
The inbreeding effective number of breeders (NbI) depends on sex ratio and the number (k) of offspring produced by the potential parents and its interindividual variance (σk2) in a particular year. The estimates were made in a stepwise fashion to assess how much these factors contribute to a reduction of NbI compared to census population size. The effects of unequal sex ratios can be accounted for with the equation [22]:
| (1) |
with Nf and Nm signifying the number of adult females and males, respectively.
To account for variance in reproductive success among individuals, Nf and Nm in equation (1) need to be replaced by the inbreeding effective number of males and females (Nbm, Nbf) in a given year [10, equation 2–4]:
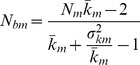 |
(2) |
and
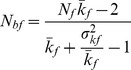 |
(3) |
to get the inbreeding number of breeders for year i:
| (4) |
Estimates of Mean and Interindividual Variance in Reproductive Success ( and σk2)
We estimated  and σk2 using parentage and mating system analysis [17], [24], [25]. We obtained our parentage data from an independent microsatellite DNA study of mating systems in four populations of O. reticulata (Lange and Hoehn unpubl.). Of the four populations, two (ORF3 and ORF7) are common to the populations of the current study. Microsatellite genotypes of nine loci were determined for all candidate parents from 423 individuals captured over a three months period. We incorporated the data into program CERVUS 3.0
[62], [63], which calculates log-likelihood ratio scores for parentage. Statistical confidence (Delta) was estimated for critical values at strict (95%) confidence levels based on computer simulation of paternity inference with allele frequencies from the population under study. Simulation parameters were as follows: 100,000 cycles, 100% of loci typed with an error rate of 0.01, and 0.8 of candidate parents sampled. Individual reproductive success was recorded as the total number of offspring (juveniles) assigned to each parent in the above analysis.
and σk2 using parentage and mating system analysis [17], [24], [25]. We obtained our parentage data from an independent microsatellite DNA study of mating systems in four populations of O. reticulata (Lange and Hoehn unpubl.). Of the four populations, two (ORF3 and ORF7) are common to the populations of the current study. Microsatellite genotypes of nine loci were determined for all candidate parents from 423 individuals captured over a three months period. We incorporated the data into program CERVUS 3.0
[62], [63], which calculates log-likelihood ratio scores for parentage. Statistical confidence (Delta) was estimated for critical values at strict (95%) confidence levels based on computer simulation of paternity inference with allele frequencies from the population under study. Simulation parameters were as follows: 100,000 cycles, 100% of loci typed with an error rate of 0.01, and 0.8 of candidate parents sampled. Individual reproductive success was recorded as the total number of offspring (juveniles) assigned to each parent in the above analysis.
For the two populations shared with the independent mating study, we used the parentage estimates for these two populations. For the remaining two populations we used the weighted mean of the mean number of offspring of the four populations, for which parentage analyses were made, with the number of potential parents analysed as weights. For variances, we used the weighted mean of the within sample variances of the four populations with parentage data [64].
Estimates from parentage analysis have unknown bias unless all individuals in the pool of potential breeders of the next generation are sampled, genotyped, and reliably assigned to their parents. We therefore regard estimates obtained from genetic parentage analysis unadjusted estimates,  and
and  ; the dot indicates male or female. If sampling probability is constant and random, then unadjusted estimates and estimates adjusted for a sampling probability less than 1 (
 and
and  ) will result in the same estimate of the inbreeding effective number of breeders [65], [66]. Nevertheless, this is an approximation. When population size and the mean number of offspring are small, and/or the proportion of offspring sampled and assigned to a parent is low, estimates may differ considerably. Therefore, we corrected the estimates from the parentage analyses. In addition, weighted means across populations can only be calculated with corrected k, unless the percentage p of juveniles sampled and successfully assigned to parents would have been identical across populations. Adjusted values of the mean number of offspring can be obtained by noting that:
| (5) |
The percentage p of juveniles sampled and successfully assigned to parents can be calculated as:
| (6) |
with  being the number of juveniles sampled and successfully assigned to a parent and
  being the estimated total number of successfully assigned offspring produced by all sampled parents. The dot indicates male or female parent. Offspring that didn’t assigned to a parent was disregarded when estimating the number of offspring. We estimated
  for each population with the Lincoln-Peterson method, which is preferable to methods implemented in CAPTURE, if the number of individuals is small [60].
To obtain adjusted individual variances of the number of offspring, we use the relationship between the variance at an earlier and the variance at a later stage derived by Crow and Morton (1955) [65] under the assumption of random survival ( ). The assumption that all juveniles had the same probability of being sampled and successfully assigned to parents is equivalent to the assumption of random survival so that p can be substituted for
  in the equation and resolve for
  .
.
| (7) |
Microsatellite DNA Analysis for Estimating NbI(gen) and NeV(gen)
DNA was extracted from the tip of the tail of each individual using the Chelex extraction method [67]. We genotyped individuals of O. reticulata using nine tetranucleotide microsatellite loci (OR205, OR220, OR266, OR6F4, OR10H7, OR11G3, OR12D7, OR12D9, OR14A7) described in Hoehn and Sarre [68], [69]. Multiplexed PCR products of all nine loci were analysed by capillary electrophoresis on a CEQ8000 (Beckman-Coulter). DNA size standard 600 (Genome Lab) was included within each sample, allowing accurate sizing of alleles and comparison between analyses. Results were analysed with fragment analysis software version 8.0.52 (Beckman-Coulter). FSTAT 2.9.3 [70], [71] and GENEPOP 3.2a [72] were used to calculate descriptive statistics and departure from Hardy-Weinberg equilibrium by comparing the observed inbreeding coefficient (FIS) with a distribution of 1000 bootstrap replicates using FSTAT 2.9.3. Additionally, evidence for the presence of null alleles at each locus within each population was assessed using the program MICROCHECKER v 2.2.3 [73].
Estimation of the Effective Population Size NbI(gen) and NeV(gen)
We used four methods of analysis to estimate NbI(gen) and NeV(gen) from the genotype data of O. reticulata. Two of these methods require at least two samples in time – a temporal moment-based (MBT) and a likelihood-based approach (TM3) implemented in the program NeEstimator [74]. We chose MBT as it is a standard approach, which has been used in a wide range of studies [2], [3], [10], [38], [75], [76]. The TM3 approach was chosen since it was assumed to perform satisfactorily with data from populations with small NeV [29]. For the point-in-time approach we also used two methods. We used the linkage disequilibrium method with bias correction as implemented in LDNe [30], [34], [41]. The standard linkage disequilibrium method [42] was shown to be biased [32], so we apply the empirical correction developed by Waples [41]. We calculated estimates assuming random mating and excluded all frequencies lower than 0.05. We used a jackknife procedure to construct 95% confidence intervals. We also estimated NbI with program ONeSAMP 1.1 [33], which uses summary genetic statistics for approximate Bayesian computation. The upper and lower bounds of the prior distribution in all populations were 2 and 250, respectively. Priors of 2–100 and 10–250 were also tested to assess whether the results were robust to changes in these assumed values.
Results
Adult Population Size Na
We observed a significant increase in the size of two populations of O. reticulata over the ten years period (Table 1, Figure 2) while the remaining two populations remained more or less stable. In particular, the population in fragment ORF8 doubled in size from 46 to 94 individuals.
Table 1. Estimates of adult ( )and adult female (
 ) population sizes, and the inbreeding number of breeders when accounting only for sex ratio of O. reticulata (
 ).
).
| Frag | Ref | Year | Samp |

|

|
LCI | UCI |

|
LCI | UCI |

|
|
| ORF1 | 170 | 1990 | 7 | 0.24 | 104 | 97 | 118 | 68 | 58 | 77 | 91 | 0.88 |
| ORF1 | 170 | 2000 | 7 | 0.20 | 105 | 90 | 136 | 62 | 52 | 71 | 99 | 0.95 |
| ORF3 | s84 | 1990 | 6 | 0.24 | 10 | 9 | 21 | 7 | 4 | 10 | 8 | 0.81 |
| ORF3 | s84 | 2000 | 5 | 0.37 | 17 | 17 | 25 | 12 | 8 | 15 | 14 | 0.80 |
| ORF7 | 168 | 1990 | 7 | 0.25 | 37 | 34 | 47 | 22 | 16 | 28 | 35 | 0.94 |
| ORF7 | 168 | 2000 | 7 | 0.29 | 55 | 48 | 71 | 29 | 21 | 36 | 54 | 0.99 |
| ORF8 | 175 | 1990 | 6 | 0.26 | 46 | 39 | 65 | 24 | 17 | 31 | 45 | 0.99 |
| ORF8 | 175 | 2000 | 6 | 0.24 | 94 | 83 | 116 | 55 | 46 | 64 | 89 | 0.95 |
| 59 | 0.91 |
Habitat fragments sampled and reference number (Ref) referring to the study of Sarre et al. (1995). Samp: number of sampling occasions,  : daily capture probability: LCI and UCI: lower and upper 95% confidence interval.
Figure 2. Comparison of estimates of adult population size  and of inbreeding effective number of breeders
  .
.

The comparison is shown between 1990 and 2000 for four populations of O. reticulata. Site codes follow Table 1.
Demographic Estimates of Inbreeding NbI
Influence of sex ratio on NbI(demo)
The sex ratios within the O. reticulata populations were slightly biased towards females with an average  = 0.61. This bias resulted in minor reductions in the estimated inbreeding number of effective breeders
  with the mean
  ratio over all populations being 0.91. The reduction was highest in fragment ORF3 (
 = 0.80) with a very small adult population size and biased sex ratio in both study periods.
Influence of variance in reproductive success on NbI(demo)
The number of offspring per female in the mating study ranged from 0 to 2, with a mean number  = 0.57 and variance
  in population ORF1 and with
  = 0.11 and variance
  in ORF7. The number of offspring per male also ranged from 0 to 2, with
  = 0.41 and variance
  in ORF1 and
  = 0.15 and variance
  in ORF7. Corrected estimates of
  ranged from 0.11 to 0.65 with
  ranging from 0.10 to 0.72 in females. In males,
  ranged from 0.15 to 0.49 and
  ranging from 0.14 to 0.64 (Table 2). The inbreeding effective number of females for both years ranged from 1 to 55 and for males from 0 to 31. For population ORF3, no Nbm estimate (1990) was obtained due to the small number of offspring. Variance in reproductive success caused a considerably stronger reduction of the number of breeders than sex ratio, with the mean
  = 0.43 and
  = 0.46 in 1990 and
  = 0.62 and
  = 0.60.
Table 2. Estimates of reproductive parameters and the demographic effective inbreeding number of breeders ( ) for four populations of O. reticulata and its comparison to census population size (
 ).
).
| Frag | Year |

|

|

|

|

|

|

|

|
| ORF1 | 1990 | 0.65 | 0.49 | 0.72 | 0.64 | 55 | 20 | 58 | 0.6 |
| ORF1 | 2000 | 0.65 | 0.49 | 0.72 | 0.64 | 50 | 24 | 65 | 0.6 |
| ORF3 | 1990 | 0.36* | 0.45* | 0.48* | 0.56* | 1 | –** | –** | –** |
| ORF3 | 2000 | 0.36* | 0.45* | 0.48* | 0.56* | 3 | 0 | 1 | 0.1 |
| ORF7 | 1990 | 0.11 | 0.15 | 0.10 | 0.14 | 9 | 5 | 12 | 0.3 |
| ORF7 | 2000 | 0.11 | 0.15 | 0.10 | 0.14 | 27 | 31 | 58 | 1.1 |
| ORF8 | 1990 | 0.36* | 0.45* | 0.48* | 0.56* | 9 | 12 | 21 | 0.5 |
| ORF8 | 2000 | 0.36* | 0.45* | 0.48* | 0.56* | 25 | 23 | 48 | 0.5 |
 and
and  are the estimated corrected mean number of juveniles produced by female and male potential breeders and
  and
and  are the estimated corrected inter-individual variances (see methods).
  and
and  are the inbreeding effective number of females and males.*: estimates based on the weighted mean from four populations (see methods). **: no estimates possible due to few numbers of offspring.
Inbreeding effective number of breeders NbI(demo)
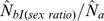
The inbreeding effective number of breeders ranged from 12 to 58 in 1990 and from 1 to 65 in 2000. ORF3 occupied the smallest and ORF1 the largest inbreeding effective numbers of breeders (Table 2). The overall mean influence of sex ratio and variance in reproductive success on the ratio of the inbreeding effective number of breeders relative to census population size ( ) ranged from 0.1 to 0.6 with the exception of ORF7 where the ratio was 1.1.
Genetic Analyses for the Estimation of NbI(gen) and NeV(gen)
A total of 228 O. reticulata were genotyped at nine microsatellite loci. We analysed between 24 and 30 randomly selected individuals from each of the two temporal samples from ORF1, ORF7, ORF3, and ORF8. The DNA amplification had a high success rate, even for the tail samples taken in 1990. MICROCHECKER v 2.2.3 [73] revealed no evidence of null alleles in any of the O. reticulata loci.
Genetic Estimates of NbI(gen) and NeV(gen)
The genetic estimates of NbI(gen) and NeV(gen) gave fairly similar results among methods excluding those estimates, in which upper confidence interval boundaries were uninformative (Table 3). The moment-based temporal MBT method gave estimates for all populations but upper confidence intervals could be constructed for two estimates only. The likelihood-based TM3 method also created estimates for all populations. However, one estimate did not produce upper confidence intervals below the boundary imposed as input value. In addition, the maximum NeV allowed substantially influenced the results of the estimations and confidence intervals (data not shown). The linkage disequilibrium method LDNe and ONeSAMP generated fairly consistent estimates within populations across years, except for the LDNe estimate in ORF8, where upper confidence intervals were not obtained in 1990. Upper and lower confidence intervals were obtained for all ONeSAMP estimates and were narrower than confidence intervals from other methods. The results were not sensitive to the prior.
Table 3. Genetic based estimates of effective population size  (MBT, TM3) and
  (LDNe, ONeSAMP) and comparison with the demographic estimates of the inbreeding effective number of breeders
  for four populations of O. reticulata.
| Frag | Ref | Year |

|
MBT | TM3 | LDNe | ONeSAMP | |
| ORF1 | 170 | 1990 | 58 | 243 (52 - ∞) | 64 (30–242) | 55 (31–156) | 37 (32–50) | |
| ORF1 | 170 | 2000 | 65 | 34 (21–73) | 37 (32–56) | |||
| ORF3 | s84 | 1990 | –** | 45 (17- 364) | 26 (13–74) | 16 (10–25) | 25 (21–35) | |
| ORF3 | s84 | 2000 | 1 | 14 (7–30) | 24 (20–35) | |||
| ORF7 | 168 | 1990 | 12 | 27 (13–64) | 17 (10–33) | 20 (14–30) | 27 (24–31) | |
| ORF7 | 168 | 2000 | 58 | 25 (17–40) | 27 (25–32) | |||
| ORF8 | 175 | 1990 | 21 | 132 (37– ∞) | 104 (19–999*) | 118 (44– ∞) | 48 (37–81) | |
| ORF8 | 175 | 2000 | 48 | 37 (22–80) | 45 (35–68) | |||
MBT: moment based temporal method; TM3: likelihood based temporal method. LDNe: the linkage disequilibrium method with bias correction; ONeSAMP is a program that uses summary statistics and approximate Bayesian computation. Lower and upper 95% confidence intervals are in brackets. *: TM3 did not produce upper confidence intervals below the imposed boundary of 999 individuals. **: no estimate possible due to too few of offspring.
Estimates from the TM3 and MBT method ranged from 17 to 64 and from 27 to 45 individuals, respectively. Only estimates with informative upper boundaries for the confidence interval are included. Estimates generated by LDNe ranged from 14–55 individuals (excluding ORF8) and included demographic estimates of  in 95%-confidence intervals in three of six cases (1 to 65) (excluding ORF8 1990 and ORF3 1990). Estimates generated by ONeSAMP ranged from 24–48 and were also similarly correlated to
  but not as well as for LDNe. When excluding estimates, in which upper confidence interval were uninformative, results across all the genetic estimators were fairly consistent with the exception of the MBT estimate in population ORF3.
Discussion
The comparative approach in this study draws upon population size estimates and population genetics data of a long-lived gecko species at two points in time across four populations. Our study also incorporates genetic data on the mating system and reproductive success. As a result of this we have obtained demographic estimates of NbI. These estimates show that all populations surveyed were small with  ranging from 1 to 65 individuals and
 , ranging from 10 to 105. The reduction in the inbreeding effective number of breeders relative to census size (
 ) ranged from 0.1 to 0.6 with ORF7 in 2000 being the exception with a ratio of 1.1. The variance in reproductive success was the primary cause for reduction in most populations. We used four methods to estimate the genetic based NbI(gen) and NeV(gen) from the genotype data. Two of these methods require at least two samples in time, while the other two were point-in-time approaches. Genetic based estimates were fairly similar across methods and also similar to the demographic estimates (excluding those estimates, in which upper confidence interval boundaries were uninformative). For example, estimates from the point estimator ranged from 14–55 (LDNe) and from 24–48 individuals (ONeSAMP). However, temporal methods suffer from a large variation in confidence intervals and concerns about the prior information.
Demographic-based Estimates of NbI
Our estimates of NbI, (1 to 65 individuals) and of Na (10 to 105) are very low for all four populations raising concerns for the long-term viability of O. reticulata in the Western Australian wheatbelt. The values are consistent with severe habitat fragmentation into small vegetation remnants and the observed increase in the genetic isolation of the wheatbelt populations over the last 100 years [50]. A reduction in the effective number of breeders will lead to a rapid loss of genetic variability, especially in small populations [8], and might increase the risk of extinction in both gecko species [50], [77].
Demographic-based Estimates of NbI/Na
For most animals studied, NbI(demo) is usually lower than population size owing to unequal sex ratio and variance in reproductive success. When each demographic variable was examined independently, variance in reproductive success resulted in the largest reduction in NbI/Na for most populations. Unequal sex ratios had only a minor effect on the number of breeders. NbI/Na ranged from 0.1 - 0.6. However, one population (ORF7) was an exception, with a ratio of 1.1. The larger effective number of breeders relative to census size was probably due to its much smaller variance in reproductive success compared to the other population.
Fluctuating population size may strongly reduce Ne [3], [10]. As our estimates are based on two single years only (taken ten years apart), it is possible that they may not be a good representation of the values that arise across more years, However, we do not expect this to be the case particularly because low adult mortality and high overlap of generations [46], [49] set stringent limits to annual fluctuations of population size This is reflected in similar Nb/Na ratio observed for all populations across years, except for one rapidly increasing population.
These results are in line with previous studies [78], [79], [80], [81]. In particular, in Pacific salmon species with their high fecundity, variation in reproductive success can have a substantial impact on the reduction of demographic Ne/Na [2], [10], [13], [25], [26]. The reduction observed in these studies is larger than those observed in the present study but geckos are considered to have particular low fecundity and O. reticulata females usually lay a clutch of two eggs per year.
The effect of the mating system (especially polygyny) on Ne has been studied both theoretically [78], [82] and empirically [75], [79], [80], [83]. In feral cat populations for example, estimates of Ne/Na were higher in a promiscuous cat population (42%) than in a polygynous one (33%) [75]. In the Italian agile frog (Rana latastei) Ne increased with population size, but was negatively related to polygyny; as polygyny increased in large populations, this was associated with reduced Ne/Na [80]. Compared to the species in these studies, the gecko O. reticulata was observed to have a particularly low fecundity and a fixed clutch size.
We also observed that variance of reproductive success in males and females was similar in all four populations of O. reticulata, which may be explained by the territoriality of both sexes. Higher variance of reproductive success in males has been reported regularly, for example Pacific salmon (Salmo spec.) and wrens (Malurus cyaneus) [13], [84], [85].
Corrected Estimates of Variance in Reproductive Success
It has been suggested that uncorrected and corrected estimates of mean k and its variance will result in the same estimates of Ne (or Nb) [26], [65], [66]. This theory is based on an approximation, which can lead to substantial deviation of mean k and its variance in species with small population size, low reproductive output, and low variance in reproductive success. This might particularly be true for species in fragmented landscapes. Conventional uncorrected parentage assignment estimates, which are increasingly being used to measure individual reproductive success [13], [17], [24], [25], [84], are subject to errors, such as failing to identify the true parent and incorrectly assigning offspring to a parent, which can potentially bias estimates of reproductive success [27], [28]. Although methods have been developed to correct these estimates [28], they require independent information on parentage or the assumption that offspring and parents have the same probability of being sampled. Data to correct estimates is rarely available in natural populations and sampling probability is not the same for offspring and parents in this species (Henle and Gruber unpubl.) and might not be the same in many other species. Moreover, estimates of the mean reproductive success and its variance require absolute values of reproductive success, unless the probability for offspring being sampled and successfully assigned to parents is identical for all populations. This is rarely the case and similar difficulties apply for the comparison of males and females when parentage assignment success varies between sexes.
Genetic-based Estimates of NbI(gen) and NeV(gen)
The genetic estimates gave fairly similar results among methods apart from those estimates, whose confidence intervals were too wide to be informative. Temporal methods suffer from a large variation in confidence intervals and concerns about the prior information, which has also been reported from studies on other species [75], [86], [87], [88]. This is especially problematic when sample sizes are small, which is often the case in natural populations of endangered species. In addition, sampling should be spread out over at least four generation to reduce stochastic noise, but our data was collected only two generations apart. Another weakness of temporal genetic methods is that they ignore the effects of migration, which can bias estimates upwards. Over the long-term, constant migration can slow down the rate of change relative to what would be expected under genetic drift alone. As a consequence, the estimate of NeV will be overestimated [38], [89]. However, in previous studies we showed that O. reticulata exhibited extremely low levels of gene flow in fragmented habitat [50], [52] and as a result it is unlikely that NeV will be affected by immigration. In addition, the MBT method assumes that generations are discrete. Despite obvious limitations, the method has been applied to species with overlapping generations and the results have been considered to be satisfactory without rigorously testing for the effects of violating the discrete-generation assumption [75], [86], [89].
Regarding the point estimators, the results from LDNe followed the demographic estimates comparably well. LDNe did not produce an upper confidence limit in one of eight cases and ONeSAMP estimates had narrower confidence intervals. Estimates obtained with ONeSAMP were also not influenced by the priors. The accuracy of single-sample estimators was also compared in other studies. Using empirical data from several natterjack toad (Bufo calamita) populations, [44] the Bayesian method [33] and the sibship method [31] performed best (correlations with other census and effective size estimates) while the LDNe method gave confidence intervals for only approximately half of the populations. Nevertheless, consistent with our results, estimates for all toad populations could be obtained. That consistency was also seen in a study that estimated Ne for 90 populations of four ranid frog species where values from ONeSAMP and the sibship method were positively correlated in all four species, had mostly similar values, and had smaller nominal confidence intervals than values from LDNe [90]. Several temporal and single-sample Ne estimators were evaluated in natural populations of Drosophila buzzatii. ONeSAMP was the single-sample estimator that performed the most precise [88]. It is expected to suffer from less imprecision than the LDNe method, given that ONeSAMP is based on linkage disequilibrium plus seven other parameters that are related to Ne [33], [81], [90]. However, precise does not necessarily mean best, because an estimator may be very precise but highly biased. For example, simulation studies showed that the LDNe method was found to have greater precision than the temporal method unless the latter was based on samples taken many generations apart [34]. These results suggest that the method might also be highly relevant for conservation studies in the future [34] An empirical study that monitors the effective population size of a brown bear (Ursus arctos) population found a high similarity between the estimates derived from the ONeSAMP, LDNe method and sibship method [91]. In addition, the study used a new Estimator by Parentage Assignment (EPA) to estimate Ne and the generation interval (Wang 2010) [92]. The estimates were largely consistent with the estimates obtained from the other methods, but the comparison was complex because EPA applies to a different time period and the generation overlap had to be taken into account. However, it is the only currently method that can directly estimate Ne from a single sample of genotypes in species with overlapping generations and has a considerable potential to be implemented in future monitoring [91].
Monitoring of change using a snap-shot approach would be attractive to both researchers and managers alike, but only if estimators of Ne are accurate. LDNe and ONeSAMP estimates are related directly to Nb [44] only if a single cohort has been sampled. Its relationship to Ne is less clear should more than a single cohort of adults be sampled, as in this study [43]. Temporal estimators are closer related to NeV. However, in increasing populations NbI will be less than NeV [45], which might explain why estimates for NeV were slightly higher than for NbI in our study. The methods used in this study differ considerably in their assumptions and in the way they estimate Ne. Thus the fact that we obtained fairly similar results across methods demonstrates that we can be fairly confident about the results. In addition the similarity of the point and temporal estimates suggests that the point estimates might be relatively close to NeV.
Comparison of Demographic and Genetic-based Estimates
The genetic based estimates, in particular the single sample estimates from ONeSAMP and LDNe were in the same order of magnitude compared to the demographically estimated inbreeding effective number of breeders when excluding those estimates, in which upper confidence interval boundaries were uninformative. Three of the demographically obtained estimates fell within the 95%-confidence interval of the LDNe method but only one within the ONeSAMP method. This might be a consequence of the smaller confidence intervals of the ONeSAMP method and because this estimate is based on summary statistics that are influenced by both NeI and NeV. Although genetic and demographic estimates of effective population size are rare, the few that have been conducted have noted that genetically-based estimates are often substantially smaller than demographically-based estimates [14], [86], [93]. An explanation for this could be that the genetic based estimates represent Nb estimates in which overlapping generations and generation length are not fully considered. Future studies are needed to better understand the reasons for these differences.
Conclusion
In summary, the single sample estimators - ONeSAMP and LDNe - performed best among the genetic estimators of effective population size evaluated in this study, when considering confidence intervals and plausibility in relation to known population sizes. If budgets and timeframes are constrained and insufficient demographic data are available for the robust estimation of population size in endangered species, then single-sample genetic estimators may provide an acceptable alternative to monitor the change of a population. However, information on individual life history and population dynamics, such as sex ratio, variance in reproductive success, fluctuating population size, and generation length will always contribute a much more complete picture of the viability of a population. In addition to the estimate of the demographic based inbreeding effective number of breeders, robust demographic data will enable predictions about the factors that contribute to a reduction in Ne/Na. It is encouraging that in general all estimates were reasonable and within the same order of magnitude for different methods although we are studying very small populations and the methods differ considerably in their assumptions and in the way they estimate Ne. Methods to estimate Ne for species with over-lapping generations have improved [18], [19], [92]. We suggest that managers should monitor both demography and genetics whenever feasible if they are to accurately assess and monitor populations of conservation concern.
Acknowledgments
We thank Lachlan Farrington, Alex Quinn, Oliver Berry, and Niccy Aitken for laboratory assistance and advice on laboratory techniques. Thanks to Dr Katarina Mikac and Niccy Aitken for proof-reading. We thank Robin Waples for comments on an earlier manuscript.
Funding Statement
DAAD - German Exchange Organisation, University Erlangen-Nürnberg in Germany and a Collaborative Industry Grant from the University of Canberra, Australia and the Helmholtz Centre for Environmental Research – UFZ, Leipzig, Germany. The funders had no role in study design, data collection and analysis, decision to publish, or preparation of the manuscript.
References
- 1. Wright S (1931) Evolution in Mendelian populations. Genetics 16: 97–159. [DOI] [PMC free article] [PubMed] [Google Scholar]
- 2. Waples RS (1989) A general approach for estimating effective population size from temporal changes in allele frequency. Genetics 121: 379–391. [DOI] [PMC free article] [PubMed] [Google Scholar]
- 3. Waples RS (2002a) Effective size of fluctuating salmon populations. Genetics 161: 783–791. [DOI] [PMC free article] [PubMed] [Google Scholar]
- 4. Wang JL (2005) Estimation of effective population size from data on genetic markers. Philos T R Soc B 360: 1395–1409. [DOI] [PMC free article] [PubMed] [Google Scholar]
- 5. Charlesworth B (2009) Effective population size and patterns of molecular evolution and variation. Nature Reviews Genetics 10: 195–205. [DOI] [PubMed] [Google Scholar]
- 6. Laikre L, Schwartz MK, Waples RS, Ryman N (2010) Compromising genetic diversity in the wild: unmonitored large-scale release of plants and animals. Trends Ecol Evol 25: 520–529. [DOI] [PubMed] [Google Scholar]
- 7. Hare MP, Nunney L, Schwartz MK, Ruzzante DE, Burford M, et al. (2011) Understanding and estimating effective population size for practical application in marine species management. Conserv Biol 25: 438–449. [DOI] [PubMed] [Google Scholar]
- 8. Frankham R (2007) Effective population size/adult population size ratios in wildlife: a review. Genet Res 89: 491–503. [DOI] [PubMed] [Google Scholar]
- 9. Storz JF, Ramakrishnan U, Alberts SC (2002) Genetic effective size of a wild primate population: Influence of current and historical demography. Evolution 56: 817–829. [DOI] [PubMed] [Google Scholar]
- 10. Ardren WR, Kapuscinski AR (2003) Demographic and genetic estimates of effective population size (N-e) reveals genetic compensation in steelhead trout. Mol Ecol 12: 35–49. [DOI] [PubMed] [Google Scholar]
- 11. Schwartz MK, Luikart G, Waples RS (2007) Genetic monitoring as a promising tool for conservation and management. Trends Ecol Evol 22: 25–33. [DOI] [PubMed] [Google Scholar]
- 12. Tallmon DA, Gregovich D, Waples RS, Baker S, Jackson J, et al. (2010) When are genetic methods useful for estimating contemporary abundance and detecting population trends? Mol Ecol Resour 10: 684–692. [DOI] [PubMed] [Google Scholar]
- 13. Araki H, Waples RS, Ardren WR, Cooper B, Blouin MS (2007) Effective population size of steelhead trout: influence of variance in reproductive success, hatchery programs, and genetic compensation between life-history forms. Mol Ecol 16: 953–966. [DOI] [PubMed] [Google Scholar]
- 14. Schmeller DS, Merila J (2007) Demographic and genetic estimates of effective population and breeding size in the amphibian Rana temporaria . Conserv Biol 21: 142–151. [DOI] [PubMed] [Google Scholar]
- 15. Nunney L, ELam DR (1994) Estimating the effective population-size of conserved populations. Conserv Biol 8: 175–184. [Google Scholar]
- 16. Hedrick P (2005) Large variance in reproductive success and the N-e/N ratio. Evolution 59: 1596–1599. [PubMed] [Google Scholar]
- 17. Wang CM, Lo LC, Zhu ZY, Lin G, Feng F, et al. (2008) Estimating reproductive success of brooders and heritability of growth traits in Asian sea bass (Lates calcarifer) using microsatellites. Aquac Res 39: 1612–1619. [Google Scholar]
- 18. Engen S, Lande R, Saether B, Gienapp P (2010) Estimating the ratio of effective to actual size of an age-structured population from individual demographic data. J Evolution Biol 23: 1148–1158. [DOI] [PubMed] [Google Scholar]
- 19. Waples RS, Do C, Chopelet J (2011) Calculating N(e) and N(e)/N in age-structured populations: a hybrid Felsenstein-Hill approach. Ecology 92: 1513–1522. [DOI] [PubMed] [Google Scholar]
- 20. Hill WG (1972) Effective size of populations with overlapping generations. Theor Popul Biol 3: 278–280. [DOI] [PubMed] [Google Scholar]
- 21. Felsenstein J (1971) Inbreeding and variance effective numbers in populations with overlapping generations. Genetics 68: 581–597. [DOI] [PMC free article] [PubMed] [Google Scholar]
- 22.Lande R, Barrowclough GF (1987) Effective population size, genetic variation, and their use in population management. In: Soule ME, ed. Viable Population for Conservation. New York: Cambridge University Press. 87–123.
- 23. Wright S (1938) Size of populations and breeding structure in relation to evolution. Science 87: 430–431. [Google Scholar]
- 24. Garant D, Dodson JJ, Bernatchez L (2001) A genetic evaluation of mating system and determinants of individual reproductive success in Atlantic salmon (Salmo salar L.). J Hered 92: 137–145. [DOI] [PubMed] [Google Scholar]
- 25. Mclean JE, Seamons TR, Dauer MB, Bentzen P, Quinn TP (2008) Variation in reproductive success and effective number of breeders in a hatchery population of steelhead trout (Oncorhynchus mykiss): examination by microsatellite-based parentage analysis. Conserv Genet 9: 295–304. [Google Scholar]
- 26. Waples RS, Waples RK (2011) Inbreeding effective population size and parentage analysis without parents. Mol Ecol Resour 11: 162–171. [DOI] [PubMed] [Google Scholar]
- 27. Nielsen R, Mattila DK, Clapham PJ, Palsboll PJ (2001) Statistical approaches to paternity analysis in natural populations and applications to the North Atlantic humpback whale. Genetics 157: 1673–1682. [DOI] [PMC free article] [PubMed] [Google Scholar]
- 28. Araki H, Blouin MS (2005) Unbiased estimation of relative reproductive success of different groups: evaluation and correction of bias caused by parentage assignment errors. Mol Ecol 14: 4097–4109. [DOI] [PubMed] [Google Scholar]
- 29. Berthier P, Beaumont MA, Cornuet JM, Luikart G (2002) Likelihood-based estimation of the effective population size using temporal changes in allele frequencies: A genealogical approach. Genetics 160: 741–751. [DOI] [PMC free article] [PubMed] [Google Scholar]
- 30. Waples RS, Do C (2008) LDNE: a program for estimating effective population size from data on linkage disequilibrium. Mol Ecol Resour 8: 753–756. [DOI] [PubMed] [Google Scholar]
- 31. Wang JL (2009) A new method for estimating effective population sizes from a single sample of multilocus genotypes. Mol Ecol 18: 2148–2164. [DOI] [PubMed] [Google Scholar]
- 32. England PR, Cornuet JM, Berthier P, Tallmon DA, Luikart G (2006) Estimating effective population size from linkage disequilibrium: severe bias in small samples. Conserv Genet 7: 303–308. [Google Scholar]
- 33. Tallmon DA, Koyuk A, Luikart G, Beaumont MA (2008) ONeSAMP: a program to estimate effective population size using approximate Bayesian computation. Mol Ecol Resour 8: 299–301. [DOI] [PubMed] [Google Scholar]
- 34. Waples RS, Do C (2010) Linkage disequilibrium estimates of contemporary N(e) using highly variable genetic markers: a largely untapped resource for applied conservation and evolution. Evol Appl 3: 244–262. [DOI] [PMC free article] [PubMed] [Google Scholar]
- 35. Wang JL (2001) A pseudo-likelihood method for estimating effective population size from temporally spaced samples. Genet Res 78: 243–257. [DOI] [PubMed] [Google Scholar]
- 36. Tallmon DA, Luikart G, Beaumont MA (2004) Comparative evaluation of a new effective population size estimator based on approximate Bayesian computation. Genetics 167: 977–988. [DOI] [PMC free article] [PubMed] [Google Scholar]
- 37. Zhdanova OL, Pudovkin AI (2008) Nb_HetEx: A program to estimate the effective number of breeders. J Hered 99: 694–695. [DOI] [PubMed] [Google Scholar]
- 38. Waples RS (2010) Spatial-temporal stratification in natural populations and how they affect understanding and estimation of effective population size. Mol Ecol Resour 10: 785–796. [DOI] [PubMed] [Google Scholar]
- 39. Waples RS, Masuda M, Pella J (2007) SALMONNb: a program for computing cohort-specific effective population sizes (N-b) in Pacific salmon and other semelparous species using the temporal method. Mol Ecol Notes 7: 21–24. [Google Scholar]
- 40. Wang JL, Whitlock MC (2003) Estimating effective population size and migration rates from genetic samples over space and time. Genetics 163: 429–446. [DOI] [PMC free article] [PubMed] [Google Scholar]
- 41. Waples RS (2006) A bias correction for estimates of effective population size based on linkage disequilibrium at unlinked gene loci. Conserv Genet 7: 167–184. [Google Scholar]
- 42. Hill WG (1981) Estimation of effective population size from data on linkage disequilibrium. Genet Res 38: 209–216. [Google Scholar]
- 43. Waples RS (2005) Genetic estimates of contemporary effective population size: to what time periods do the estimates apply? Mol Ecol 14: 3335–3352. [DOI] [PubMed] [Google Scholar]
- 44. Beebee TJC (2009) A comparison of single-sample effective size estimators using empirical toad (Bufo calamita) population data: genetic compensation and population size-genetic diversity correlations. Mol Ecol 18: 4790–4797. [DOI] [PubMed] [Google Scholar]
- 45. Crow JF, Kimura M (1972) Effective number of a population with overlapping generations - correction and further discussion. Am J Hum Genet 24: 1–10. [PMC free article] [PubMed] [Google Scholar]
- 46. Kitchener DJ, How RA, Dell J (1988) Biology of Oedura reticulata and Gehyra variegata (Gekkonidae) in an isolated woodland of Western Australia. J Herpetol 22: 401–412. [Google Scholar]
- 47. Gruber B (2004) Measuring activity of geckos with an automatic movement monitoring system. Herpetol Rev 35: 245–247. [Google Scholar]
- 48. Gruber B, Henle K (2008) Analysing the effect of movement on local survival: a new method with an application to a spatially structured population of the arboreal gecko Gehyra variegata . Oecologia 54: 679–690. [DOI] [PubMed] [Google Scholar]
- 49. How RA, Kitchener DJ (1983) The biology of the gecko Oedura reticulata Bustard, in a small habitat isolate in the Western Australian wheatbelt. Aust Wildlife Res 10: 543–556. [Google Scholar]
- 50. Hoehn M, Sarre SD, Henle K (2007) The tales of two geckos: does dispersal prevent extinction in recently fragmented populations? Mol Ecol 16: 3299–3312. [DOI] [PubMed] [Google Scholar]
- 51. Sarre S (1995a) Size and structure of populations of Oedura reticulata (Reptilia: Gekkonidae) in woodland remnants: implications for the future regional distribution of a currently common species. Aust J Ecol 20: 288–298. [Google Scholar]
- 52. Sarre S (1995b) Mitochondrial DNA variation among population of Oedura reticulata (Gekkonidae) in remnant vegetation: implications for metapopulation structure and population decline. Mol Ecol 4: 395–405. [Google Scholar]
- 53. Sarre S (1998) Demographics and population persistence of Gehyra variegata (Gekkonidae) following habitat fragmentation. J Herpetol 32: 153–162. [Google Scholar]
- 54. Sarre S, Smith GT, Meyers JA (1995) Persistence of two species of gecko (Oedura reticulata and Gehyra variegata) in remnant habitat. Biol Conserv 71: 25–33. [Google Scholar]
- 55. Henle K, Kuhn J, Podloucky R, Schmidt-Loske K, Bender C (1997) Individualerkennung und Markierung mitteleuropäischer Amphibien und Reptilien: Übersicht und Bewertung der Methoden; Empfehlungen aus Natur- und Tierschutzsicht. Mertensiella 7: 133–184. [Google Scholar]
- 56.Ferner JW (2007) A Review of Marking and Individual Recognition Techniques for Amphibians and Reptiles. Salt Lake City: Society for the Study of Amphibians and Reptiles: Herpetological Circulars 35.
- 57. Paulissen MA, Meyer HA (2000) The effect of toe-clipping on the gecko Hemidactylus turcicus . J Herpetol 34: 282–285. [Google Scholar]
- 58. Borges-Landaez PA, Shine R (2003) Influence of toe-clipping on running speed in Eulamprus quoyii, an Australian scincid lizard. J Herpetol 37: 592–595. [Google Scholar]
- 59.Otis DL, Burnham KP, White GC, Anderson DR (1978) Statistical inference for capture-recapture data in closed animal populations. Wildlife Monogr 62.
- 60. Menkens GE, Anderson SH (1988) Estimation of Small-Mammal Population-Size. Ecology 69: 1952–1959. [Google Scholar]
- 61. Henle K (1990) Population ecology and life history of the arboreal gecko Gehyra variegata in arid Australia. Herpetol Monogr 4: 30–60. [Google Scholar]
- 62. Marshall TC, Slate J, Kruuk LEB, Pemberton JM (1998) Statistical confidence for likelihood-based paternity inference in natural populations. Mol Ecol 7: 639–655. [DOI] [PubMed] [Google Scholar]
- 63. Kalinowski ST, Taper ML, Marshall TC (2007) Revising how the computer program CERVUS accommodates genotyping error increases success in paternity assignment. Mol Ecol 16: 1099–1106. [DOI] [PubMed] [Google Scholar]
- 64.Sachs L (1982) Applied Statistics. New York, Heidelberg, Berlin: Springer.
- 65. Crow JF, Morton NE (1955) Measurement of gene frequency drift in small populations. Evolution 9: 202–214. [Google Scholar]
- 66. Waples RS (2002b) Evaluating the effect of stage-specific survivorship on the N-e/N ratio. Mol Ecol 11: 1029–1037. [DOI] [PubMed] [Google Scholar]
- 67. Walsh PS, Metzger DA, Higuchi R (1991) Chelex-100 As a medium for simple extraction of DNA for PCR-based typing from forensic material. Biotechniques 10: 506–513. [PubMed] [Google Scholar]
- 68. Hoehn M, Sarre SD (2005) Tetranucleotide microsatellites in the gecko Oedura reticulata isolated from an enriched library. Mol Ecol Notes 5: 730–732. [Google Scholar]
- 69. Hoehn M, Sarre S (2006) Microsatellite DNA markers for Australian geckos. Conserv Genet 7: 795–798. [Google Scholar]
- 70. Goudet J (1995) FSTAT (Version 1.2): A computer program to calculate F-statistics. J Hered 86: 485–486. [Google Scholar]
- 71.Goudet J. FSTAT, a program to estimate and test gene diversities and fixation indices (version 2.9.3.2). Available: http://en.bio-soft.net/tree/FSTAT.html. Accessed 2012 Oct 6.
- 72. Raymond M, Rousset F (1995) Genepop (version 1.2) – population-genetics software for exact tests and ecumeniscism. J Hered 86: 248–249. [Google Scholar]
- 73. Van Oosterhout C, Hutchinson WF, Wills DPM, Shipley P (2004) MICRO-CHECKER: software for identifying and correcting genotyping errors in microsatellite data. Mol Ecol Notes 4: 535–538. [Google Scholar]
- 74. Ovenden J, Peel D, Street R, Courtney A, Hoyle S, et al. (2007) The genetic effective and adult census size of an Australian population of tiger prawns (Penaeus esculentus). Mol Ecol 16: 127–138. [DOI] [PubMed] [Google Scholar]
- 75. Kaeuffer R, Pontier D, Devillard S, Perrin N (2004) Effective size of two feral domestic cat populations (Felis catus L.): effect of the mating system. Mol Ecol 13: 483–490. [DOI] [PubMed] [Google Scholar]
- 76. Aspi J, Roininen E, Ruokonen M, Kojola I, Vila C (2006) Genetic diversity, population structure, effective population size and demographic history of the Finnish wolf population. Mol Ecol 15: 1561–1576. [DOI] [PubMed] [Google Scholar]
- 77. Henle K, Lindenmayer DB, Margules CR, Saunders DA, Wissel C (2004) Species survival in fragmented landscapes: where are we now? Biodivers Conserv 13: 1–8. [Google Scholar]
- 78. Nunney L (1993) The influence of mating system and overlapping generations on effective population-size. Evolution 47: 1329–1341. [DOI] [PubMed] [Google Scholar]
- 79. Storz JF, Bhat HR, Kunz TH (2001) Genetic consequences of polygyny and social structure in an Indian fruit bat, Cynopterus sphinx. I. Inbreeding, outbreeding, and population subdivision. Evolution 55: 1215–1223. [DOI] [PubMed] [Google Scholar]
- 80. Ficetola G, Padoa-Schioppa E, Wang J, Garner T (2010) Polygyny, census and effective population size in the threatened frog, Rana latastei . Anim Conserv 13: 82–89. [Google Scholar]
- 81. Luikart G, Ryman N, Tallmon DA, Schwartz MK, Allendorf FW (2010) Estimation of census and effective population sizes: the increasing usefulness of DNA-based approaches. Conserv Genet 11: 355–373. [Google Scholar]
- 82. Engen S, Ringsby TH, Saether BE, Lande R, Jensen H, et al. (2007) Effective size of fluctuating populations with two sexes and overlapping generations. Evolution 61: 1873–1885. [DOI] [PubMed] [Google Scholar]
- 83. Stiver JR, Apa AD, Remington TE, Gibson RM (2008) Polygyny and female breeding failure reduce effective population size in the lekking Gunnison sage-grouse. Biol Conserv 141: 472–481. [Google Scholar]
- 84. Garant D, Dodson JJ, Bernatchez L (2003) Differential reproductive success and heritability of alternative reproductive tactics in wild Atlantic salmon (Salmo salar L.). Evolution 57: 1133–1141. [DOI] [PubMed] [Google Scholar]
- 85. Cockburn A, Sims RA, Osmond HL, Green DJ, Double MC, et al. (2008) Can we measure the benefits of help in cooperatively breeding birds: the case of superb fairy-wrens Malurus cyaneus ? J Anim Ecol 77: 430–438. [DOI] [PubMed] [Google Scholar]
- 86. Poulsen NA, Nielsen EE, Schierup MH, Loeschcke V, Gronkjaer P (2006) Long-term stability and effective population size in North Sea and Baltic Sea cod (Gadus morhua). Mol Ecol 15: 321–331. [DOI] [PubMed] [Google Scholar]
- 87. Borrell YJ, Bernardo D, Blanco G, Vazquez E, Sanchez JA (2008) Spatial and temporal variation of genetic diversity and estimation of effective population sizes in Atlantic salmon (Salmo salar, L.) populations from Asturias (Northern Spain) using microsatellites. Conserv Genet 9: 807–819. [Google Scholar]
- 88. Barker JSF (2011) Effective population size of natural populations of Drosophila buzzatii, with a comparative evaluation of nine methods of estimation. Mol Ecol 20: 4452–4471. [DOI] [PubMed] [Google Scholar]
- 89. Johnson JA, Bellinger MR, Toepfer JE, Dunn P (2004) Temporal changes in allele frequencies and low effective population size in greater prairie-chickens. Mol Ecol 13: 2617–2630. [DOI] [PubMed] [Google Scholar]
- 90. Phillipsen IC, Funk WC, Hoffman EA, Monsen KJ, Blouin MS (2011) Comparative analyses of effective population size within and among species: ranid frogs as a case study. Evolution 65: 2927–2945. [DOI] [PubMed] [Google Scholar]
- 91. Skrbinsek T, Jelencic M, Waits L, Kos I, Jerina K, et al. (2012) Monitoring the effective population size of a brown bear (Ursus arctos) population using new single-sample approaches. Mol Ecol 21: 862–875. [DOI] [PubMed] [Google Scholar]
- 92. Wang JL, Brekke P, Huchard E, Knapp LA, Cowlishaw G (2010) Estimation of parameters of inbreeding and genetic drift in populations with overlapping generations. Evolution 64: 1704–1718. [DOI] [PubMed] [Google Scholar]
- 93. Hutchinson WF, Van Oosterhout C, Rogers SI, Carvalho GR (2003) Temporal analysis of archived samples indicates marked genetic changes in declining North Sea cod (Gadus morhua). P Roy Soc B-Biol Sci 270: 2125–2132. [DOI] [PMC free article] [PubMed] [Google Scholar]