Abstract
The use of color LCDs in medical imaging is growing as more clinical specialties use digital images as a resource in diagnosis and treatment decisions. Telemedicine applications such as telepathology, teledermatology, and teleophthalmology rely heavily on color images. However, standard methods for calibrating, characterizing, and profiling color displays do not exist, resulting in inconsistent presentation. To address this, we developed a calibration, characterization, and profiling protocol for color-critical medical imaging applications. Physical characterization of displays calibrated with and without the protocol revealed high color reproduction accuracy with the protocol. The present study assessed the impact of this protocol on observer performance. A set of 250 breast biopsy virtual slide regions of interest (half malignant, half benign) were shown to six pathologists, once using the calibration protocol and once using the same display in its “native” off-the-shelf uncalibrated state. Diagnostic accuracy and time to render a decision were measured. In terms of ROC performance, Az (area under the curve) calibrated = 0.8570 and Az uncalibrated = 0.8488. No statistically significant difference (p = 0.4112) was observed. In terms of interpretation speed, mean calibrated = 4.895 s; mean uncalibrated = 6.304 s which is statistically significant (p = 0.0460). Early results suggest a slight advantage diagnostically for a properly calibrated and color-managed display and a significant potential advantage in terms of improved workflow. Future work should be conducted using different types of color images that may be more dependent on accurate color rendering and a wider range of LCDs with varying characteristics.
Keywords: Color displays, Diagnostic accuracy, Color calibration, Color management, Pathology
Introduction
Clinicians in all specialties rely on images as part of the arsenal with which diseases and other abnormalities are detected, diagnosed, and treated. Optimal display of these images is critical to this interpretation process. To date, there has been a significant amount of research in radiology on how to calibrate both medical-grade and commercial off-the-shelf displays [1–7], but for the most part, radiology uses monochrome displays and grayscale images, and the techniques are in general not applicable to color images and displays.
However, color displays are increasingly being used in other diagnostic imaging applications such as pathology, ophthalmology, and telemedicine. These displays (as well as the images displayed on them) vary in size, contrast, resolution, luminance, color primaries, color gamut, and white point. While there are some standards regarding the acquisition of images for some of these applications [8, 9], guidance regarding calibration of color displays is fragmented without consensus regarding what type of calibration should be performed even with a given clinical specialty [10–13]. A single validated color display calibration protocol is not in place for color image applications in medicine.
One specialty in particular that has seen increased interest in color display calibration is pathology. With the advent of more technologically advanced and improved whole slide imaging (WSI) techniques, the challenges associated with the display of these images have arisen as a key barrier to wider clinical use of WSI in clinical practice and education [14–17]. There are some proposed methods for image acquisition and display for WSI, but in general, they have not been validated or evaluated with respect to their impact on diagnostic interpretation performance. For example, Yagi [18] has been developing techniques for color validation and optimization. One proposed method starts out by taking two standard slides that are scanned and displayed by a given imaging system. One of the slides is embedded with nine filters having colors purposely selected for hematoxylin and eosin (H&E)-stained WSIs, and the other slide is an H&E-stained mouse embryo. The displayed images are then compared to a standard to identify inaccurate display of color and its causes. The question of whether inaccurate display affects observer performance is not addressed.
Another group has concentrated more on display characterization and the tools used during the calibration process. For example, one study [19] characterized three probes for measuring display color: a modification of a small-spot luminance probe and two conic probes based on black frusta. They found that there are significant differences between the probes that effect the measurements used to quantify display color. They have proposed a method to evaluate the performance of color calibration kits for LCD monitors using the idea of a virtual display—a universal platform to emulate tone reproduction curves [20]. The model processes video signals based on a preprogrammed look-up table containing the tone reproduction curves of a display being evaluated and determines whether the calibration kits are sufficient. Sufficiency, however, is not judged with respect to observer performance but rather with respect to physical display property characterization and measurement.
Clearly, there is a significant lack of data showing that poor or inappropriate calibration can affect diagnostic performance, and therefore, there is no universally accepted image quality program for color displays. Because of limited experience with routine diagnosis on softcopy color displays in any healthcare applications that use color digital images, the clinical consequences of degraded monitor performance are not well established. To address this, we developed a calibration, characterization, and profiling protocol for color-critical medical imaging applications [21].
Materials and Methods
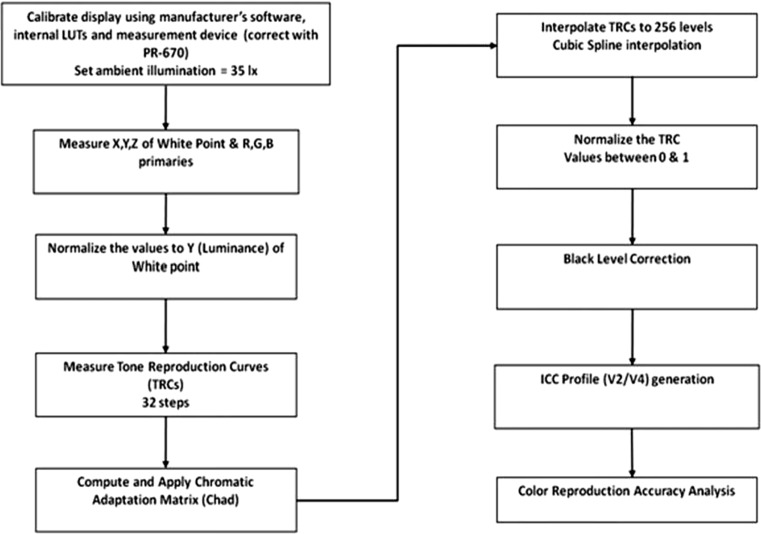
The details of our color calibration protocol have been presented elsewhere [21], along with a complete description of our novel black-level correction methodology which is compatible with the color profile structure specified by the International Color Consortium (ICC) methods for color management [22]. Properly measuring and accounting for the contributions of the display black level are important for color reproduction and critical for LCDs since the LC panel serves as an array of filtered light valves that modulate illumination from a backlight module that constantly emits light (i.e., there is always some light leakage even in the pixel off state). Figure 1 provides a flowchart which summarizes our methodology for calibration, characterization, and profiling of color LCDs for medical applications [21].
Fig. 1.
Flowchart for calibration, characterization, and ICC profile generation for color LCDs used in medical imaging
We have demonstrated with physical characterization of displays calibrated with and without our protocol that high color reproduction accuracy can be achieved with the protocol [21]. The question addressed in the present study was whether this improved color calibration and color reproduction accuracy would impact diagnostic accuracy or efficiency.
Test images were selected from regions in a set of 93 uncompressed virtual slides produced by a DMetrix scanner for stained breast biopsy specimens (DMetrix, Inc, Tucson, AZ) [23]. Briefly, the DMetrix ultrarapid virtual slide scanner uses an array microscope as an imaging engine and can produce 1.5 × 1.5-cm virtual slides (the industry de facto standard for assessing virtual slide processing rates) in less than 1 min. The processor scans images at 0.47 μm per pixel resolution and captures more than 200,000 images per second. The high slide throughput is accomplished through the use of massive parallel processing. The case diagnoses were verified by the original report and a second confirmatory review by a board-certified pathologist not participating in the study.
Regions (512 × 512) in each slide were selected by this expert pathologist as being areas that contained relevant diagnostic information that would allow an observer to determine if the case was benign or malignant. The regions of interest (ROIs) were also chosen with respect to having good quality in terms of no blurring due to the scanning process and no excess tissue material irrelevant to the task (e.g., blood cells). Based on a sample size analysis to achieve a power of 0.80, a total of 250 regions of interest (half benign, half malignant) were selected for inclusion in the study. All images were also graded by another independent pathologist as having excellent or good quality.
Six pathologists (based on the sample size estimate) participated in two study sessions using a counterbalanced design. Two of the readers were board-certified pathologists, one was a fellow, and three were pathology residents. The first three were considered experienced readers, while the residents were considered less experienced. One session used a calibrated/color-managed NEC 2690 LCD (1,920 × 1,200; Lmax = 320 cd/m2; contrast ratio = 1,000:1; wide gamut), and the other used a matched, off-the-shelf, uncalibrated NEC 2690 LCD without the benefit of color management. The pathologists' task was to determine for each biopsy image if the specimen was benign or malignant and report decision confidence using a 6-point scale (1 = benign, definite; 2 = benign, probable; 3 = benign, possible; 4 = malignant, possible; 5 = malignant, probable; 6 = malignant, definite). Decision times (time from when an image first appeared until after a decision and rating had been made and the reader selected the “next image” option) were also recorded as a measure of diagnostic efficiency. Half of the subjects viewed the images first on the color-managed/calibrated display then about 3 weeks later on the uncalibrated display, while the other half viewed the images in the opposite order. This counterbalanced presentation design was used to avoid presentation order bias in the results. Three weeks was used to promote forgetting of the images, which is typical in counterbalanced studies.
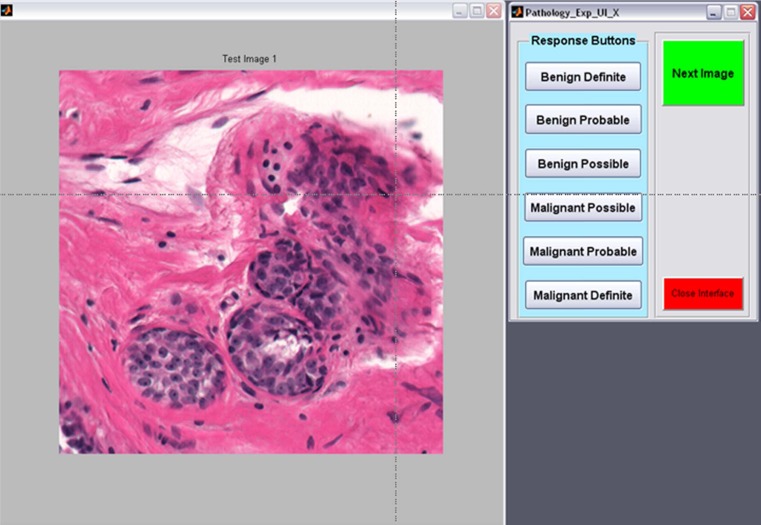
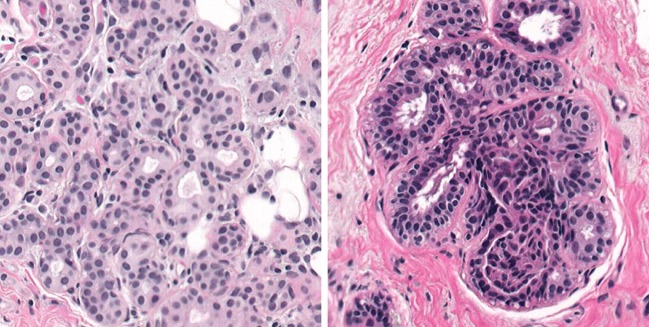
A dedicated interface (Fig. 2) was developed and used for the study. The interface presented the images at full resolution in the center of the display to simulate what the pathologist would likely see if they were zooming on a particular ROI during clinical reading. Figure 3 shows examples of a malignant (left) and benign (right) specimen. The room lights were set to 25 lx to simulate a typical reading environment in which the room lights are approximately the level of an average image displayed on the monitor used for viewing.
Fig. 2.
Dedicated interface for the observer study. The image appears on the left, and the observer inputs confidence ratings on the right. Time is automatically recorded
Fig. 3.
Typical malignant (left) and benign (right) images
Prior to the first session, each subject was given Ishihara's Test for Color Deficiency (Kanehara Trading, Inc. Tokyo, Japan), and all passed. The Ishihara color test is a perception test for color deficiencies. The test consists of sets of images containing a circle of dots that appear to be randomized in color and size, but within the pattern are dots that form a number visible to those with normal color vision and invisible, or hard to see, for those with a color vision defect.
Results
The observer confidence data were analyzed using the multireader multicase receiver operating characteristic technique (MRMC ROC). MRMC allows for the comparison of multiple treatments (e.g., displays) using data from multiple readers and multiple cases and performing an analysis of variance on the resulting area under the curve (Az) values [24]. In terms of ROC performance, Az for the calibrated display was 0.8570, and for the uncalibrated display, Az = 0.8488. No statistically significant difference (F = 0.71, p = 0.4112) was observed. The individual Az values are shown in Table 1. Five out of the six readers had higher performance (as indicated by the ROC Az values where 0.50 is chance and 1.0 is perfect performance) with the calibrated than with the uncalibrated display, but the differences were relatively small and, as noted, not statistically significant.
Table 1.
ROC Az values for the six readers using the uncalibrated and calibrated color display
| Reader | Uncalibrated Az | Calibrated Az |
|---|---|---|
| 1 | 0.9003 | 0.9142 |
| 2 | 0.9747 | 0.9856 |
| 3 | 0.8235 | 0.8586 |
| 4 | 0.7827 | 0.7884 |
| 5 | 0.8098 | 0.7889 |
| 6 | 0.8015 | 0.8062 |
| Mean | 0.8488 | 0.8570 |
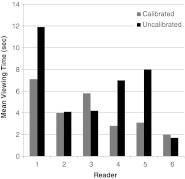
In terms of interpretation speed (see Fig. 4), the mean calibrated total viewing time was 4.895 s, and the mean total viewing time for the uncalibrated display was 6.304 s which was statistically significant (p = 0.0460) when tested with a paired t test.
Fig. 4.
Average viewing times for the six pathologists using the calibrated and uncalibrated displays
Discussion
There are a variety of ways that have been proposed to characterize and calibrate color displays for medical image interpretation tasks that involve the use of color images such as WSI for pathology [16–20]. To date, however, there have been few, if any, studies examining the impact of calibrating or color-managing color displays on diagnostic accuracy or efficiency for the interpretation of virtual pathology slides. Thus, this work represents one of the first studies to do so and may have significant implications for the way pathologists carry out quality control measures in their digital reading rooms.
Although we did not observe a significant impact on diagnostic accuracy with the color-managed/calibrated display, we did observe a significant impact on interpretation speed. Despite the lack of a significant difference in diagnostic accuracy, there was a slight trend for performance being better with the calibrated display. The lack of a significant difference could mean a variety of things, but further research is of course needed. Speed with the uncalibrated display was just over 1 s longer than with the calibrated display. It is important to remember that the images used in this study were relatively small regions of interest (512 × 512) and not the entire pathology virtual slide. If the entire slides were used, it seems likely that this difference in viewing time might extend into many seconds per slide, and cumulatively, this could result in significantly longer viewing times over a large set of images for viewing on an uncalibrated versus calibrated color display. Clearly, there are other factors that would contribute to overall viewing time of actual cases, but if simply using the proper calibration method could reduce even one contributing factor, it could make a significant difference in terms of overall efficiency and thus acceptance of reading pathology virtual slides.
In terms of the lack of a significant difference in diagnostic accuracy, it simply may be that color, although a very important aspect of the pathology images, is not the only diagnostic feature that pathologists use during the interpretation process, so completely accurate rendering may not be as important as one would think. There are many features that the pathologist processes visually when examining a typical specimen slide. The configuration of the cells and the cell structures are critical for example in determining whether a given specimen is benign or malignant, and although color may aid in visualizing these structures, it is the basic configuration and relationship between the structures that matter rather than color. Color may help in the visualization and/or identification of these structures, but the structure itself is likely to be more critical in rendering a diagnostic interpretation.
Another possibility is that even uncalibrated off-the-shelf displays are really quite good in their ability to accurately reproduce and render color information, so the gains one gets with more sophisticated calibration methods are only marginal. Finally, it may be that other types of pathology images with different stains, different diagnostic features, etc. may require accurate color rending while breast biopsy specimens with the H&E stain may not. The fact that we did observe an impact on efficiency with the calibrated display does indicate, however, that even if all of these are true to some extent, there is still an advantage to accurate color calibration and rendering. As with all clinical practices today, workflow is critical as clinicians are being required to deal with more and more patients. Finding ways to improve workflow even to a moderate degree could be very important.
The final possibility for the small differences in performance is that the types of images used may not be that dependent on the color information for their interpretation. Within pathology, there are huge differences in the appearance of different specimen samples depending on the organ, the disease, the type of staining, and so on. Breast biopsy specimens may not be as highly dependent on color information as other specimens, but only future study on this topic will determine if this is the case. Pathology itself may actually be less impacted by color differences than other medical imaging specialties. For example, dermatology and ophthalmology are now acquiring digital color images for a variety of diagnostic uses, and these images contain numerous color components that may be more important to the diagnostic process than color is in pathology. Again, only future studies with different types of images from different clinical specialties will reveal the extent to which color calibration and color management of the display is important in terms of diagnostic accuracy and efficiency.
It is interesting to note that histopathology laboratories use various hematoxylin and eosin staining protocols and staining techniques. At a university hospital laboratory, pathologists typically view glass slides from multiple outside laboratories almost daily (second opinions, QA, etc.). There is a large variance in the actual staining of the glass slides, as well as section thickness which also affects color appearance. Therefore, pathologists are able to work around large variations in slide appearances introduced by differences in staining. Also, light microscope alignments within a single laboratory can vary a great deal, also affecting color. Unlike radiology, for example, where many radiologists in an individual practice share the same imaging devices, pathologists may view glass slides through a number of different light microscopes in any given day. At a university medical center laboratory, pathologists are very accustomed to dealing with differences in histopathology image appearances produced using a number of different light microscopes in a given day. Microscope alignment testing is rarely carried out in service pathology laboratories. When alignment measurements are carried out, the degree to which some light microscopes, used for routine diagnostic pathology, are out of alignment can be quite striking. Thus, pathologists may be so used to compensating for differences in the color of not only the specimens themselves but in the viewing devices that calibration efforts have very little impact.
Conclusions
There was no significant impact on diagnostic accuracy with the color-managed/calibrated display, although there was a slight trend for performance being better with the calibrated display. We did, however, observe a significant impact on interpretation speed. Further study on this topic is warranted as we only studied one type of display and one type of pathology specimen example. The impact of a well-managed/calibrated display on diagnostic accuracy in pathology as well as other medical imaging applications where color is important may well differ as a function of these two variables, and thus, future work should investigate these other reading scenarios.
Acknowledgments
This work was supported in part by NIH/ARRA grant 1R01EB007311-01A2.
References
- 1.Geijer H, Geijer M, Forsberg L, et al. Comparison of color LCD and medical-grade monochrome LCD displays in diagnostic radiology. J Digit Imaging. 2007;20:114–121. doi: 10.1007/s10278-007-9028-5. [DOI] [PMC free article] [PubMed] [Google Scholar]
- 2.Lowe JM, Brennan PC, Evanoff MG, McEntee MF. Variations in performance of LCDs are still evident after DICOM gray-scale standard display calibration. Am J Roentgenol. 2010;195:181–187. doi: 10.2214/AJR.09.2851. [DOI] [PubMed] [Google Scholar]
- 3.Butt A, Mahoney M, Savage NW. The impact of computer display performance on the quality of digital radiographs: a review. Aust Dent J. 2012;57:16–23. doi: 10.1111/j.1834-7819.2011.01660.x. [DOI] [PubMed] [Google Scholar]
- 4.Wang J, Xu J, Baladandayuthapani V. Contrast threshold sensitivity of digital imaging display systems: contrast threshold dependency on object type and implications for monitor quality assurance and quality control in PACS. Med Phys. 2009;36:3682–3692. doi: 10.1118/1.3173816. [DOI] [PMC free article] [PubMed] [Google Scholar]
- 5.Fetterly KA, Blume HR, Flynn MJ, Samei E. Introduction to grayscale calibration and related aspects of medical imaging grade liquid crystal displays. J Digit Imaging. 2008;21:193–207. doi: 10.1007/s10278-007-9022-y. [DOI] [PMC free article] [PubMed] [Google Scholar]
- 6.Krupinski EA. Medical grade vs off-the-shelf color displays: influence on observer performance and visual search. J Digit Imaging. 2009;22:363–368. doi: 10.1007/s10278-008-9156-6. [DOI] [PMC free article] [PubMed] [Google Scholar]
- 7.Krupinski EA, Roehrig H. The influence of a perceptually linearized display on observer performance and visual search. Acad Radiol. 2000;7:8–13. doi: 10.1016/S1076-6332(00)80437-7. [DOI] [PubMed] [Google Scholar]
- 8.Krupinski EA, Burdick A, Pak H, et al. American Telemedicine Association's practice guidelines for teledermatology. Telemed J E Health. 2008;14:289–302. doi: 10.1089/tmj.2007.0129. [DOI] [PubMed] [Google Scholar]
- 9.Cavalcanti PG, Scharcanski J, Lopes CBO, et al. Shading attenuation in human skin color. In: Bebis G, Boyle R, Parvin B, et al., editors. Advances in visual computing 6th International Symposium. Berlin: Springer; 2010. pp. 190–198. [Google Scholar]
- 10.Li HK, Esquivel A, Techavipoo U, et al. Teleophthalmology computer display calibration. Invest Ophthalmol Vis Sci. 2005;46:4580. [Google Scholar]
- 11.Li HK, Esquivel A, Hubbard L, et al. Mosaics versus early treatment diabetic retinopathy seven standard fields for evaluation of diabetic retinopathy. Retina. 2011;31:1553–1563. doi: 10.1097/IAE.0b013e3182084273. [DOI] [PubMed] [Google Scholar]
- 12.Ricur G, Zaldivar R, Batiz MG. Cataract and refractive surgery post-operative care: teleophthalmology's challenge in Argentina. In: Yogesan K, Kumar S, Goldschmidt L, editors. Teleophthalmology. Berlin: Springer; 2006. pp. 213–226. [Google Scholar]
- 13.Poucke S, Haeghen YV, Vissers K, et al. Automatic colorimetric calibration of human wounds. BMC Med Imag. 2010;10:7. doi: 10.1186/1471-2342-10-7. [DOI] [PMC free article] [PubMed] [Google Scholar]
- 14.Weinstein RS, Graham AR, Richter LC, et al. Overview of telepathology, virtual microscopy, and whole slide imaging: prospects for the future. Hum Pathol. 2009;40:1057–1069. doi: 10.1016/j.humpath.2009.04.006. [DOI] [PubMed] [Google Scholar]
- 15.Krupinski EA. Optimizing the pathology workstation “cockpit”: challenges and solutions. J Pathol Inform. 2010;1:19. doi: 10.4103/2153-3539.70708. [DOI] [PMC free article] [PubMed] [Google Scholar]
- 16.Yagi Y, Gilbertson JR. Digital imaging in pathology: the case for standardization. J Telemed Telecare. 2005;11:109–116. doi: 10.1258/1357633053688705. [DOI] [PubMed] [Google Scholar]
- 17.Yagi Y, Gilbertson JR. Digital pathology from the past to the future. J eHealth Tech App. 2010;8:73–80. [Google Scholar]
- 18.Yagi Y. Color standardization and optimization in whole slide imaging. Diagn Pathol. 2011;6:1–15. doi: 10.1186/1746-1596-6-S1-S15. [DOI] [PMC free article] [PubMed] [Google Scholar]
- 19.Saha A, Kelley EF, Badano A. Accurate color measurement methods for medical displays. Med Phys. 2010;37:74–81. doi: 10.1118/1.3265879. [DOI] [PubMed] [Google Scholar]
- 20.Cheng WC, Caceres H, Badano A. Evaluating color calibration kits with virtual display. Proc SPIE Med Imag. 2012;8292:82920A. doi: 10.1117/12.912297. [DOI] [Google Scholar]
- 21.Silverstein LD, Hashmi SF, Lang K, Krupinski EA: Paradigm for achieving color reproduction accuracy in LCDs for medical imaging. J Soc Info Disp In Press, 2012
- 22.International Color Consortium: Specification ICC.1:2004–10, Image technology colour management-Architecture, profile format, and data structure. 2006
- 23.Weinstein RS, Descour MR, Liang C, et al. An array microscope for ultrarapid virtual slide processing and telepathology. Design, fabrication, and validation study. Hum Pathol. 2004;35:1303–1314. doi: 10.1016/j.humpath.2004.09.002. [DOI] [PubMed] [Google Scholar]
- 24.Dorfman DD, Berbaum KS, Metz CE. Receiver operating characteristic rating analysis: Generalization to the population of readers and patients with the jackknife method. Invest Radiol. 1992;27:723–731. doi: 10.1097/00004424-199209000-00015. [DOI] [PubMed] [Google Scholar]


