Abstract
The human vocal folds are layered structures with intrinsically anisotropic elastic properties. Most testing methods assume isotropic behavior. Biaxial testing of vocal folds is strictly difficult because the very soft tissue tends to delaminate under transverse traction loads. In the present study, a linear transversely isotropic model was used to characterize the tissue in-vitro. Shear rheometry was used in conjunction with traction testing to quantify the elasticity of porcine vocal fold tissue. Uniaxial traction testing along with optical measurements were used to obtain the longitudinal modulus. The alternate vocal fold of each animal was subjected to a test-specific sample preparation and concurrently tested using dynamic shear rheometry. The stiffness ratio (i.e., the ratio of the longitudinal modulus and the transverse modulus) varied between ~5 and ~7 at low frequencies. The proposed methodology can be applied to other soft tissues.
Keywords: Soft tissue, Tensile test, Rheometry, Linear transversely isotropic, Stiffness ratio
1. Introduction
Human phonation is produced by flow-induced self-oscillations of the vocal folds, two lips of soft tissue located within the larynx. A knowledge of the glottal airflow, the geometry of the glottis, and the elasticity of vocal fold tissue is essential to understand the basic physics of phonation. Previous studies have investigated the effects of geometry on vocal fold modal properties (Cook et al., 2009) and the effects of tissue stiffness on vibratory motion (Berry and Titze, 1996). Numerical models of the elastic deformations of the vocal fold lamina propria require constitutive equations relating tissue strain and the associated mechanical stress (Titze and Talkin, 1979). The elastic properties of vocal fold tissue have been measured using conventional and customized testing methods (Alipour and Titze, 1991; Chan and Titze, 2000). Uniaxial traction testing has been used to measure the longitudinal Young’s modulus (e.g., Alipour and Titze, 1991). The Young’s modulus of the human vocal folds from traction tests was found to be in the range between 20–50 kPa. Shear rheometry has also been used to characterize vocal fold tissue. A commercially available Gemini rheometer was used to apply homogenous torsional shear loading (Chan and Titze, 2000). A linear skin rheometer was used to excite vocal folds in the coronal plane (Goodyer et al., 2007). The two methods reported the linear shear modulus of human vocal folds to be between 0.1 and 3 kPa, at low frequencies (< 15 Hz). These values are considerably lower than the range of moduli obtained from uniaxial traction testing. It was hypothesized in the present study that the differences between traction-testing and rheometry data are due to anisotropy.
Although the vocal folds are generally believed to be anisotropic, a few attempts have been made to consider the anisotropy in their elastic properties. Those studies lack consistency of planes that are subjected to mechanical loading. To solve this problem, test-specific sample preparations were introduced here. Traction testing yields the overall longitudinal Young’s modulus along the axial direction. Rheometry, for an ideal homogenous loading, yields the overall linear shear modulus. In cases where the tissue sample is smaller than the rotating plates, the sample needs to be forced into the volume, which can cause inaccurate measurements. The goal of the present study was to estimate the tissue anisotropy using data obtained from the two testing methods. Dynamic shear loading was imposed in the sagittal plane. Additional analysis was done to model the anisotropic behavior. Both methods, along with some assumptions on the tissue biomechanics, were used to identify the parameters of a linear transversely isotropic model (Cook and Mongeau, 2007; Titze and Talkin, 1979).
2. Methods
2.1 Sample Preparation
Porcine vocal fold tissue was used because of compositional similarities (Hahn et al., 2006) and resemblances in phonatory properties (Alipour et al., 2011) between porcine and human vocal folds. However, the porcine vocal fold lamina propria is single layered rather than multilayered (Hahn et al., 2006), which facilitates modeling of the tissue. A recently developed testing protocol (Miri et al., 2011) was used to prepare the samples for traction testing. The lamina propria was separated from the glottal wall and the muscle, but left attached to segments of the extremities through the thyroid and arytenoids cartilages. For the rheological measurements, a 1-cm diameter circular disk was extracted from the middle third portion (in the anterior-posterior direction) of the vocal fold. The sample included the vocal fold lamina propria along with a portion of the adjacent subglottal wall, which has been shown to have similar mechanical stiffness (Alipour et al., 2011). Efforts were made to obtain a uniform thickness to ensure contact over the entire surface of the two parallel plates. One vocal fold from each larynx was used for traction testing, and the opposite fold was concurrently used for rheometry.
2.2 Traction testing
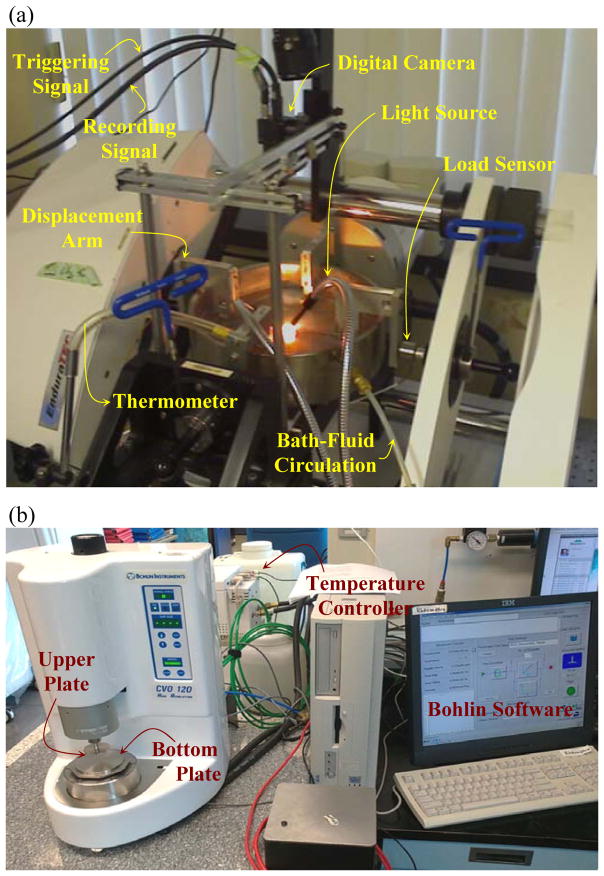
Uniaxial traction testing was performed using an EnduraTEC tester (ElectroForce [ELF] 3200, Bose Inc., Eden Prairie, MN) equipped for biaxial testing (Fig. 1a). The second-axis output signal of the ELF machine was used to trigger a digital camera (Flea2, Point Grey Research Inc., Richmond, BC). The tester was set for displacement control, imposing frequency-dependent sinusoidal waveforms. The thickness of samples was measured using a 1μm-precision caliper (Mitutoyo, Tokyo, Japan). The current technique uses non-contact optical measurements for tissue deformation. Hence, a random black-yellow speckle pattern was applied onto the tissue using tissue dyes. The sample was then installed in the grips using four black silk sutures (3.0 metric), as shown in Fig. 1a. It was submerged in a normal phosphate buffer solution (PBS) at 37°C such that a thin layer of fluid covered the upper surface, i.e., the epithelium. A fiber-optic light source (Cole-Parmer Instrument Co, Montreal, QC) was used to illuminate the surface of the sample. Images of the deformed tissue were imported into commercial software (Vic2D 2009, Correlated Solutions Inc.) to calculate in-plane strain components, using digital image correlation (DIC) (Miri et al., 2011). The slope of the axial stress-strain curves for strain magnitudes lower than 10% was reported as the longitudinal Young’s modulus.
Figure 1.
Experimental apparatus: a) EnduraTEC traction testing machine equipped with a digital camera; b) Bohlin rheometer working with a temperature controller.
2.3 Rheometry
A commercially available Gemini rheometer (CVO 120 Bohlin, Westborough, MA) equipped with a digital temperature controller was used to perform dynamic rheological tests (Fig. 1b). The initial thickness was measured using a Mitutoyo caliper. A parallel-plate configuration with a 10-mm diameter disk was used. The tissue sample was oriented such that mechanical torsion was applied in the sagittal plane — an important detail in the present work. Oscillation tests were performed in a controlled stress mode over the frequency range from 0 to 10 Hz. A constant normal force of 0.1 N, corresponding to a 1.27-kPa normal stress, (Figs. 1b and 2b) was applied, although most previous data (Chan and Titze, 2000; Titze et al., 2004) were recorded with the fixed-gap arrangement. The imposition of a constant normal stress improved the consistency of the shear modulus data because the tissue relaxes during the tests. Subtraction of the final thickness, at steady state, from the initial thickness, before installation, yields the normal strain along the transverse direction. This information was used to calculate the normal modulus of the tissue sample, as described later. The samples were immersed in a cup filled with 37°C normal phosphate buffer solution, according to a protocol detailed in Titze et al. (2004).
Figure 2.
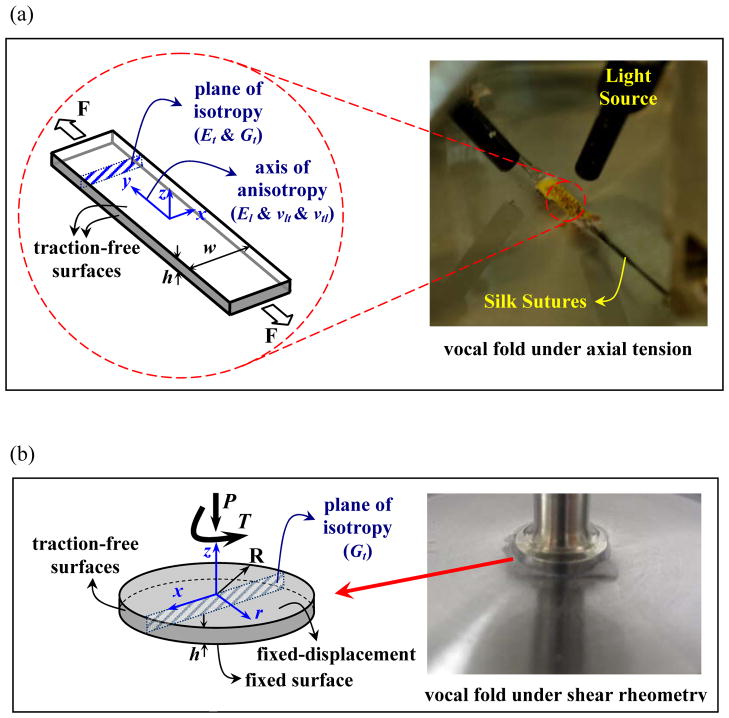
a) Picture of a porcine vocal fold sample under traction-test (right-hand side) and the corresponding cubic model, based on a transversely isotropic material model. b) A porcine vocal fold sample subjected to shear rheometry (right-hand side) and the associated model based on a transversely isotropic material model. The x and z axes are orientated along the plane of isotropy.
2.4 Transversely isotropic model
The assumption of one-axis anisotropy leads to the transversely anisotropic model, which requires five independent constants. Following the work of Titze and Talkin (1979), Berry and Titze (1996) and Cook and Mongeau (2007) applied this model to the vocal fold lamina propria. Collagen fibers within the lamina propria provide the greatest resistance to mechanical loading along the anterior-posterior direction, which is perpendicular to the coronal plane (Miri et al., 2012). The model was applied to the porcine tissue samples, as illustrated in Fig. 2. Cartesian coordinates are used to identify the orientation of the samples, with the y-direction in the longitudinal direction and the x-z plane being the plane of isotropy (Fig. 2). Cook and Mongeau (2007) characterized the stress-strain relationship (see also Titze and Talkin 1979) as
| (1) |
The vectors σ and ε represent stress and strain fields, respectively. Young’s modulus in the y-direction direction is El, and Et is the corresponding modulus in the plane of isotropy (i.e., x-z). The transverse shear modulus in the x-z plane is Gt (≡ Et/2(1 + νt)), where Gl is the longitudinal shear modulus. The transverse Poisson ratio, νt, is the ratio of the strain in the x-direction and the strain applied in the z-direction. The longitudinal Poisson ratio, νl, is the ratio of the strain in the x-z plane and the longitudinal strain. The incompressibility assumption yields νt = 0.5 and νt = 1 − Et/2 El (Cook and Mongeau, 2007). Substitution into equation (1) yields the compliance matrix, expressed as
| (2) |
Berry and Titze (1996) provide further justification for the constants in equations (1) and (2). The matrix in equation (2) has only three independent bulk constants. The longitudinal Young’s modulus, El, (Fig. 2a) may be directly calculated from traction-test data (≡ σy/εy). The remaining constants Et ≡ 2(1 + νt)Gt and Gl may be deduced from the rheological test data. As shown in Fig. 2b, the rheometer simultaneously imposes shear torsion, T, and a normal force, P, to ensure enough friction to prevent slippage between the sample and the plates. The zero-load and steady-state thicknesses were measured for a fixed normal force. This procedure allowed the estimation of the transverse modulus, Et, from division of the normal stress and the normal strain (≡ σz/εz). It was assumed that the sample was subjected to shear rheometry, as shown in Fig. 2b. The relation between the output of the rheometer and the anisotropic material properties was obtained by analysis. The detailed derivation is provided in Appendix A. The result may be summarized as
| (3) |
where G′ is the rheometer output (Fig. 1b). The stiffness ratio of the tissue is El/Et, the primary indicator of anisotropy.
3. Results
3.1 Physical model (experimental validation)
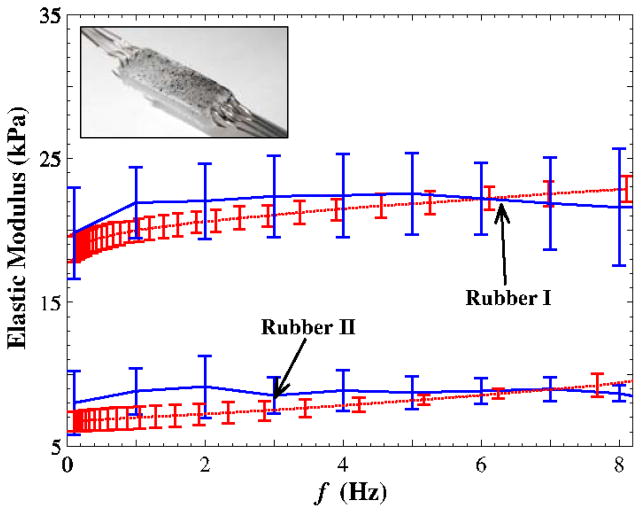
The accuracy and consistency of the two methods for the measurement of the elastic mechanical properties was evaluated using a silicon rubber material (Dragon Skin; Smooth-On Inc., PA). Rectangular rubber samples were molded to perform the uniaxial traction testing. Thin, cylindrical samples were fabricated of the same material for the rheological measurements. Four samples (n = 4) were tested using both protocols. The elastic shear modulus was calculated using the relation E = 2(1+ν)G, as illustrated in Fig. 3 (ν ≃ 0.5). A good agreement between the shear moduli obtained from the two methods was observed.
Figure 3.
Isotropic elastic shear modulus of silicon rubber samples (n = 4) versus the applied frequency for two testing systems. The error bar represents the standard deviation.(
 G;
G;
 E/3)
E/3)
3.2 Porcine vocal folds
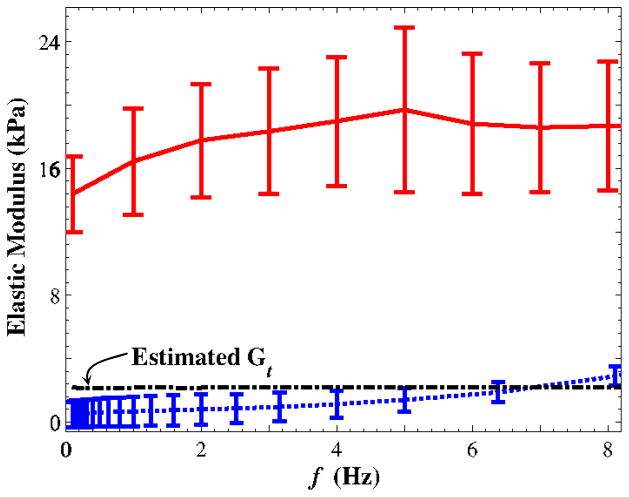
It was assumed that the two healthy vocal folds belonging to each animal’s larynx had the same mechanical elastic properties. This assumption was assessed throughout a preliminary study using a set of (n = 4) porcine vocal folds. Left and right folds were subjected to rheometry. Over the frequency range of the present study, there was less than a 25% difference in shear moduli between the left and the right porcine vocal folds. Six sets of porcine vocal folds were then subjected to both testing protocols. The mean values of the three model constants, i.e., the longitudinal modulus and the two shear moduli defined in equation (1), are shown in Fig. 4, along with the standard deviations of two measured moduli. As mentioned before, the longitudinal shear modulus was estimated in a quasi-static sense. The stiffness ratio of the porcine vocal fold lamina propria varied between ~5 and ~7 over the frequency range between 0 and 8 Hz. A factor of three was used to infer the shear modulus from the measured longitudinal modulus.
Figure 4.
Transversely isotropic moduli for porcine vocal fold samples (n = 6) versus the loading frequency. The error bar represents the standard deviation.(
 El/3;
El/3;
 Gl; _ _ _Gt)
The observed anisotropy is likely caused by the microstructure composition of extracellular proteins in vocal fold tissue (Miri et al., 2012). More than half of the proteins are collagen fibrils (Hahn et al., 2006), which are mostly oriented longitudinally, according to unpublished nonlinear laser scanning microscopy data. The fibrils are supposedly stiffer in tension than in other loading conditions and should therefore contribute less to tissue resistance for shear rheometry.
The measured elastic properties vary more in the traction-testing data than in the rheometry data, as shown in Fig. 4, particularly in comparison with Fig. 3. This may be because the greatest tissue stiffness is along the longitudinal direction. Thus, slight variations in tissue gripping may have led to significant differences in the traction-test data. The rheometry data are less dependent on variations in the sample geometry if the sample thickness is uniform. Furthermore, unidirectional traction data may be contaminated by noise from tissue-bath interactions and misalignments of suture needles with respect to the x-axis and the plane of tension (Fig. 2a).
One fundamental dynamic property of the vocal folds is their eigenfrequencies. The vibratory motion of vocal folds is a superposition of their (mostly lowest) eigenmodes (Berry and Titze, 1996). However, attempts to measure the eigenmodes have not been successful because the vocal folds are overdamped. The role of tissue anisotropy on the eigenfrequencies of the vocal folds was quantified analytically for a simple rectangular beam (van Rensburg and van der Merwe, 2006). Among the classical beam models, the Timoshenko model includes the effect of the transverse shear deflections (van Rensburg and van der Merwe, 2006). The results are presented in Appendix B.
4. Conclusions
A linear transversely isotropic model was used to describe the anisotropic elasticity of the vocal fold lamina propria. The incompressibility assumption was made. Three independent constitutive model constants were determined for pairs of porcine vocal folds using uniaxial traction testing and torsional shear rheometry. Two test-specific sample preparations were proposed and the stiffness ratio was found to be between 5.19 and 7.11. The proposed methodology is not specific for vocal fold tissue. The effect of anisotropy on the fundamental frequency of a simple Timoshenko beam model of the vocal folds was approximately 20%.
Acknowledgments
This work was supported by National Institute of Health grant R01-DC005788 (Luc Mongeau, principal investigator).
Appendix A
Referring to Fig. 2b, the applied torsional torque ideally produces a shear stress field with only one nonvanishing cylindrical stress term, i.e., σθz. For ease of derivation, the stress tensor is best expressed in Cartesian coordinates, being attached to the plane of isotropy. This yields [σ(x, y, z)] = [a][σ(r, θ, z)][a]T, in which the rotation matrix is
| (A-1) |
The nonzero terms in the Cartesian stress tensor are related through the relations
| (A-2) |
The imposition of the transversely isotropic constitutive law (1) yields
| (A-3) |
Transformation into cylindrical coordinates using [ε(r, θ, z)] = [a]T [σ(x, y, z)][a] yields
| (A-4) |
The rheometer output is the angular position of the sample, φ, which yields the second equation in (A-4). Hence the relevant relation between the shear stress and the shear strain (i.e., ) is
| (A-5) |
This should be applied in the moment of area to calculate the overall torque as
| (A-6) |
A comparison between equation (A-6) and the well-known torque-rotation relation—i.e., equation (8) in (Titze et al., 2004)—yields the effective modulus as
| (A-7) |
Appendix B
According to the beam model presented by van Rensburg and van der Merwe (2006), the governing characteristics equation is
| (B-1) |
for simply supported terminations (SS), and it is
| (B-2) |
for cantilevered supports (CC). In relations (B-1) and (B-2) k = 1, 2, …, α = Al2/I, and γ = 2Gt/3El ρ, with l, A and I denoting the length, cross-section area and second moment of inertia (van Rensburg and van der Merwe, 2006); ωk represents the kth eigenfrequency of the beam. In equation (B-2), the constants, mi, are two nonconjugated roots of
| (B-3) |
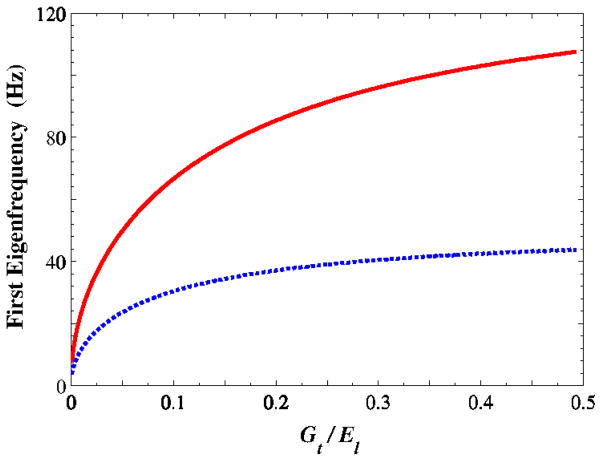
The geometrical data presented in (Berry and Titze, 1996), Table 1, was used to calculate the lowest eigenfrequency of the beam model to illustrate the effects of anisotropy. For the measured longitudinal modulus values (Fig. 4), the first eigenfrequency is shown, versus the anisotropy factor Gt/El in Fig. 5. An increase in the anisotropy factor tends to increase the fundamental frequency, particularly for SS conditions. From Fig. 4, the ratio Gt/El is 0.16, which corresponds to a frequency of nearly 80 Hz in SS conditions. This is in contrast with the value of 100 Hz obtained from the parameters used by Berry and Titze (1996) and Cook et al. (2009).
Figure 5.
The first eigenfrequency calculated by equation (5) as a function of the anisotropy factor/tl G E for two different ending conditions. (SS: simply support; CC: cantilever)
Footnotes
Conflict of interest statement
None.
Publisher's Disclaimer: This is a PDF file of an unedited manuscript that has been accepted for publication. As a service to our customers we are providing this early version of the manuscript. The manuscript will undergo copyediting, typesetting, and review of the resulting proof before it is published in its final citable form. Please note that during the production process errors may be discovered which could affect the content, and all legal disclaimers that apply to the journal pertain.
References
- Alipour F, Jaiswal S, Vigmostad S. Vocal Fold Elasticity in the Pig, Sheep, and Cow Larynges. Journal of Voice. 2011;25:130–136. doi: 10.1016/j.jvoice.2009.09.002. [DOI] [PMC free article] [PubMed] [Google Scholar]
- Alipour F, Titze IR. Elastic models of vocal fold tissues. J Acoust Soc Am. 1991;90(3):1326–1331. doi: 10.1121/1.401924. [DOI] [PubMed] [Google Scholar]
- Berry DA, Titze IR. Normal modes in a continuum model of vocal fold tissues. J Acoust Soc Am. 1996;100:3345–3354. doi: 10.1121/1.416975. [DOI] [PubMed] [Google Scholar]
- Chan RW, Titze IR. Viscoelastic shear properties of human vocal fold mucosa: Theoretical characterization based on constitutive modeling. J Acoust Soc Am. 2000;107(1):565–580. doi: 10.1121/1.428354. [DOI] [PubMed] [Google Scholar]
- Cook DD, Mongeau L. Sensitivity of a continuum vocal fold model to geometric parameters, constraints, and boundary conditions. Journal of the Acoustical Society of America. 2007;121:2247–2253. doi: 10.1121/1.2536709. [DOI] [PubMed] [Google Scholar]
- Cook DD, Nauman E, Mongeau L. Ranking vocal fold model parameters by their influence on modal frequencies. Journal of the Acoustical Society of America. 2009;126:2002–2010. doi: 10.1121/1.3183592. [DOI] [PMC free article] [PubMed] [Google Scholar]
- Goodyer E, Hemmerich S, Müller F, Kobler J, Hess M. The shear modulus of the human vocal fold, preliminary results from 20 larynxes. European Archives of Oto-Rhino-Laryngology. 2007;264:45–50. doi: 10.1007/s00405-006-0133-8. [DOI] [PubMed] [Google Scholar]
- Hahn MS, Kobler JB, Zeitels SM, Langer R. Quantitative and comparative studies of the vocal fold extracellular matrix I: Elastic fibers and hyaluronic acid. Ann Otol Rhinol Laryngol. 2006;115:156–164. doi: 10.1177/000348940611500213. [DOI] [PubMed] [Google Scholar]
- Miri AK, Barthelat F, Mongeau L. Effects of dehydration on the viscoelastic properties of vocal folds in large deformations. Journal of Voice. 2011 doi: 10.1016/j.jvoice.2011.1009.1003. [DOI] [PMC free article] [PubMed] [Google Scholar]
- Miri AK, Tripathy U, Mongeau L, Wiseman PW. Nonlinear laser scanning microscopy of human vocal folds. The Laryngoscope. 2012;122:356–363. doi: 10.1002/lary.22460. [DOI] [PMC free article] [PubMed] [Google Scholar]
- Titze IR, Klemuk SA, Gray S. Methodology for rheological testing of engineered biomaterials at low audio frequencies. 2004;115:392–401. doi: 10.1121/1.1631941. [DOI] [PubMed] [Google Scholar]
- Titze IR, Talkin DT. A theoretical study of the effects of various laryngeal configurations on the acoustics of phonation. The Journal of the Acoustical Society of America. 1979;66:60–74. doi: 10.1121/1.382973. [DOI] [PubMed] [Google Scholar]
- van Rensburg NFJ, van der Merwe AJ. Natural frequencies and modes of a Timoshenko beam. Wave Motion. 2006;44:58–69. [Google Scholar]


