

Abstract
Aims:
To complete an initial estimate of the global cost of eliminating avoidable blindness, including the investment required to build ongoing primary and secondary health care systems, as well as to eliminate the ‘backlog’ of avoidable blindness. This analysis also seeks to understand and articulate where key data limitations lie.
Materials and Methods:
Data were collected in line with a global estimation approach, including separate costing frameworks for the primary and secondary care sectors, and the treatment of backlog.
Results:
The global direct health cost to eliminate avoidable blindness over a 10-year period from 2011 to 2020 is estimated at $632 billion per year (2009 US$). As countries already spend $592 billion per annum on eye health, this represents additional investment of $397.8 billion over 10 years, which is $40 billion per year or $5.80 per person for each year between 2010 and 2020. This is concentrated in high-income nations, which require 68% of the investment but comprise 16% of the world's inhabitants. For all other regions, the additional investment required is $127 billion.
Conclusions:
This costing estimate has identified that low- and middle-income countries require less than half the additional investment compared with high-income nations. Low- and middle-income countries comprise the greater investment proportion in secondary care whereas high-income countries require the majority of investment into the primary sector. However, there is a need to improve sector data. Investment in better data will have positive flow-on effects for the eye health sector.
Keywords: Avoidable blindness, global cost, health investment, primary and secondary health, visual impairment
Globally, there are 39 million people who are blind, and a further 246 million who are visually impaired to the point that their ability to function is negatively impacted.[1] Together this means 285 million visually impaired persons. The majority of the world's visually impaired live in developing countries. The top three causes of visual impairment are uncorrected refractive errors, cataract, and glaucoma, while the top three causes of blindness are cataract, glaucoma, and macular degeneration.[2]
An increasing number of people are at risk of visual impairment, including blindness, because of population growth and aging, increased life expectancy and changes in lifestyle. Additionally, as the prevalence of chronic diseases that affect the eyes (e.g., diabetes mellitus) increases, more people will be susceptible to potentially blinding conditions.
More than 80% of visual impairment is avoidable; usually a straightforward procedure or medication can improve or restore sight.[1] Nongovernment organizations (NGOs) are moving toward approaches that help strengthen health system capacity, where previously NGO investment was directed more toward visual impairment treatment.[3–5] This movement has been led by the global initiative known as ‘VISION 2020: The Right to Sight’.[6]
To achieve the VISION 2020 goals of disease control, human capital development and infrastructure and technology development, it is vital to have well-functioning primary and secondary health systems.[4,5,7] It is important to understand the cost of eliminating avoidable blindness to communicate the extent of the issue worldwide and hence enable VISION 2020 goals to happen. This study estimates the global cost of eliminating avoidable blindness, including the investment required to build well-functioning health care systems, as well as eliminate the ‘backlog’ of avoidable blindness. This analysis also seeks to understand and articulate where key data limitations lie.
Materials and Methods
For the purpose of these estimates, avoidable blindness refers to specified conditions that are potentially preventable through the modification of known risk factors or for which effective treatments exist to restore sight or prevent further vision loss. Estimates are categorized by condition–cataracts, glaucoma, and other types of avoidable blindness. Our cost framework includes the investment required to:
build and provide an ongoing primary eye care system with the capacity to prevent avoidable blindness
build and provide an ongoing secondary eye care system with the capacity to treat patients at risk of avoidable blindness, and
eliminate the ‘backlog’ of avoidable blindness prevalence and incidence.
The full research report outlines the assumptions and data sources used and can be located at the following link: http://www.hollows.org.au/our-work/the-price-of-sight.
Costing framework for the primary/secondary health care sectors
This component of the global cost of avoidable blindness estimate calculates:
the cost of the status quo (recurrent expenditure currently apportioned to primary eye health services, cost of training primary eye health professionals, including time and cost of providing associated infrastructure)
the cost of the expansion required to fill the ‘gap’ between status quo and the VISION 2020 human resource to population ratio targets (including associated infrastructure and training costs), and
other costs, including the investment required for research as well as other types of care associated with avoidable blindness [see costing framework depiction in Fig. 1].
Figure 1.
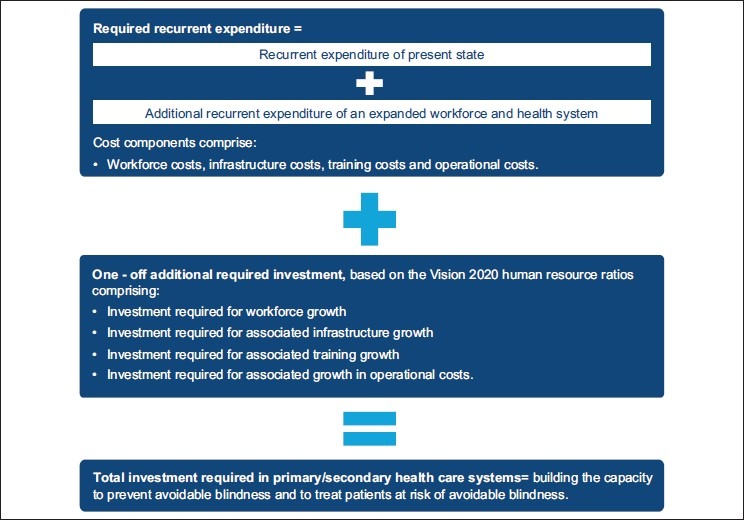
Costing framework for the primary/secondary health care sectors
To determine the investment required to finance an ideal primary and secondary eye health system capable of eliminating avoidable blindness, health expenditure per capita was multiplied by the estimated percentage of health care that is spent on primary/secondary eye health care.[8] Different assumptions were used for high-income and other countries. For high-income economies, data from the United Kingdom, the United States of America, Canada, Japan, and Australia were used to determine the proportion of health care spent on primary/secondary eye health care.[9,10] For other regions, data was sourced from sponsor organizations for Peru, Paraguay, and Nepal.
Current health expenditure per capita on health services was estimated by multiplying estimates of current health workforce by estimated wages and scaling up for non workforce health expenditure.[11–14] These estimates incorporated information and data about three key factors to address differences in the cost of providing services across countries:
cost of living (Purchasing Power Parity)[8]
different wage levels for health workers in different World Bank regions,[14] and
a 10% higher cost of service provision for regional and remote areas of a country.[15]
The ‘required’ health expenditure per capita on health services was estimated by scaling up estimates of current expenditure on health services to reflect the growth required to reach an ‘ideal’ health system. We derived the expansion in workforce capacity from current health workforce estimates and World Health Organization (WHO) workforce estimates required for an ideal system.[12]
The investment required to expand workforce infrastructure used the same workforce capacity growth estimates, multiplied by estimated training costs and capital infrastructure required per workforce capita (see ‘Discussion section’ for further information on assumptions made).
All forecasts were adjusted for inflation and converted to US dollars.[14,16,17]
Costing framework for the backlog
The third major component of the cost estimation is that associated with providing treatment to those people who are already avoidably blind through cataracts, glaucoma, and other conditions. The cost of treating the backlog of macular degeneration cases is not included because it is considered to be prohibitively high and evidence to support the impact of treatment on ceasing blindness is continuing to evolve.
The backlog comprises individuals who are avoidably blind or are currently at risk and will likely go blind by 2020. The cost of eliminating this requires addressing current prevalence as well as the incidence of avoidable blindness [Fig. 2]. The cost was estimated by determining the number of individuals with avoidable blindness and visual impairment by condition and assigning a unit cost for treatment of each condition. Unit costs were estimated for low-, medium-, and high-income countries. Estimates for high-income countries were derived from Australia. Estimates were based on select country averages.[7,18–20]
Figure 2.
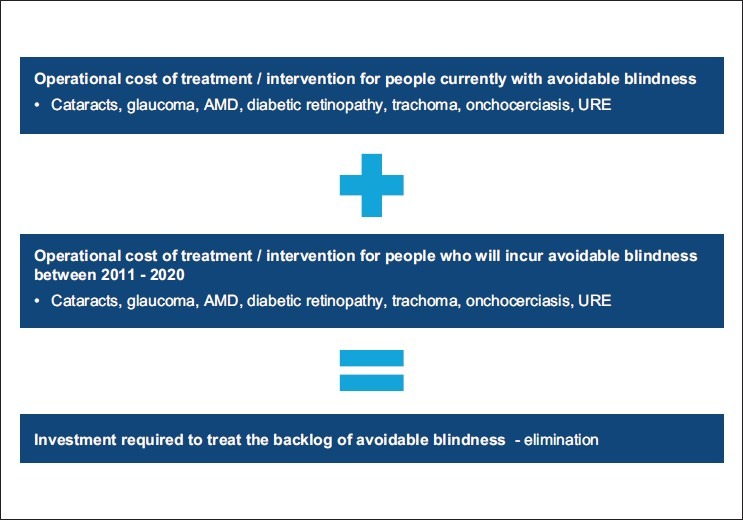
Costing framework to address the backlog of avoidable blindness
Data collection
A comprehensive data and information collection exercise was completed, through:
publicly available information (such as WHO and VISION 2020 data),
information provided by key sector experts including cost-related data not published or released publicly,
information provided by International Association for the Prevention of Blindness (IAPB) chairs and their referred contacts about the costs of services in particular countries, and
information and data for the costs of eye care and blindness treatment programs for select countries.[7,18,21]
Information was collected through a targeted consultation process and resulted in some information about the costs of providing eye health services in Nepal, Peru, and Paraguay and data from Vietnam concerning prevalence and service usage. All data contributed to the construction of assumptions and the costing methodology. To supplement data gaps, multiple assumptions were used to build estimates.
Results
The global direct health cost to eliminate avoidable blindness over a 10-year period from 2011 to 2020 is estimated at $632 billion per year (2009 US$). This estimate comprises the cost to treat the backlog, substantially increased service provision in the primary and secondary sectors and ‘capital’ investment required to increase the health workforce and infrastructure systems in line with the workforce ratios recommended by VISION 2020. Table 1 shows this figure disaggregated by component.
Table 1.
Global direct health cost and investment to eliminate avoidable blindness over 10 years
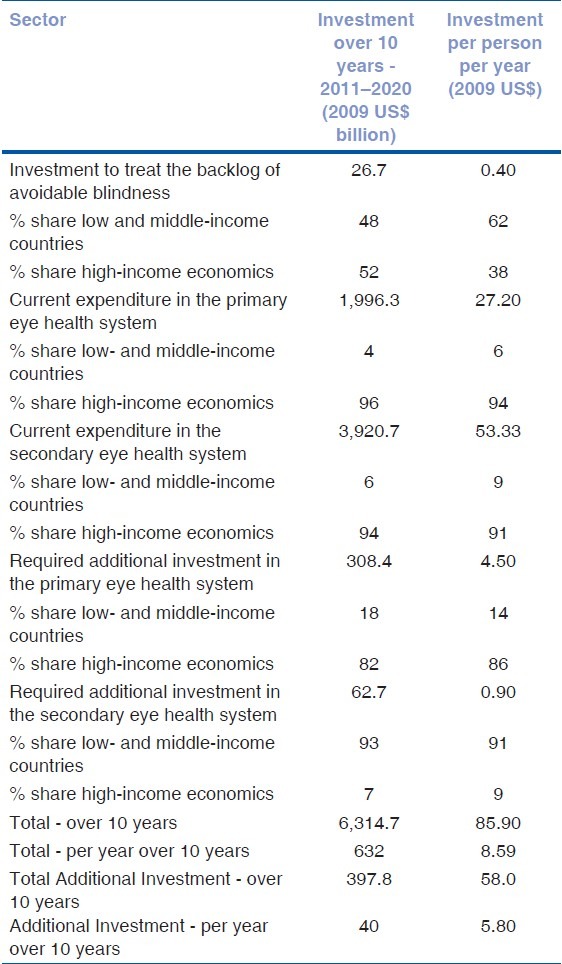
We estimate that countries already spend some $592 billion per annum on eye health, so this represents an additional investment of some $397.8 billion over 10 years, which is $40 billion per annum or $5.80 per person for each year between 2010 and 2020.
The majority of the additional cost in primary care is incurred in high -income countries, but the greatest need for investment in secondary care is in the developing world.
The costs of eliminating avoidable blindness vary significantly across regions. Mutually exclusive World Bank regions are used to summarize cost estimates. As such, all regions other than high-income economies can be described as low-, middle-, and upper-income economies, according to World Bank classification.[22]
Table 2 shows the additional investment disaggregated by high-income nations and other regions. These results show cost estimate share by region against current share of world population and hence emphasize that the investment over 10 years is heavily concentrated in high-income nations, which require 68% of the investment but comprise just 16% of the world's inhabitants. For all other regions, the additional investment required is $127 billion over the 10 year period, or $2.20 per person each year, which is less than half the additional investment required for high-income nations.
Table 2.
Additional investment (primary care and secondary care) required to eliminate avoidable blindness by region 2011–2020
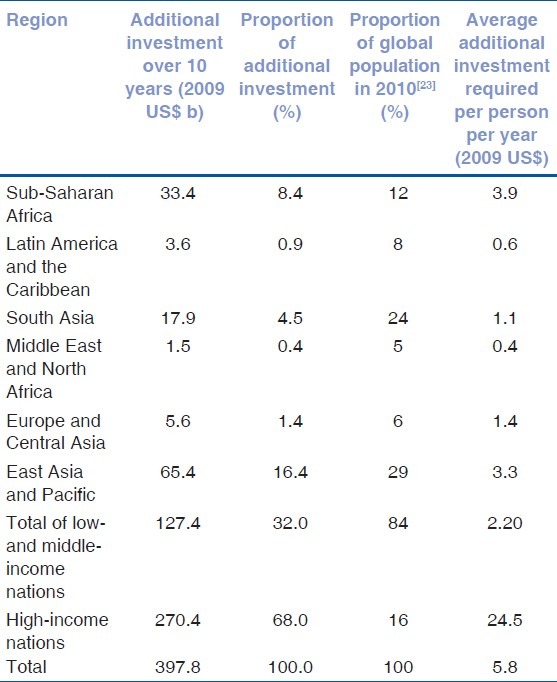
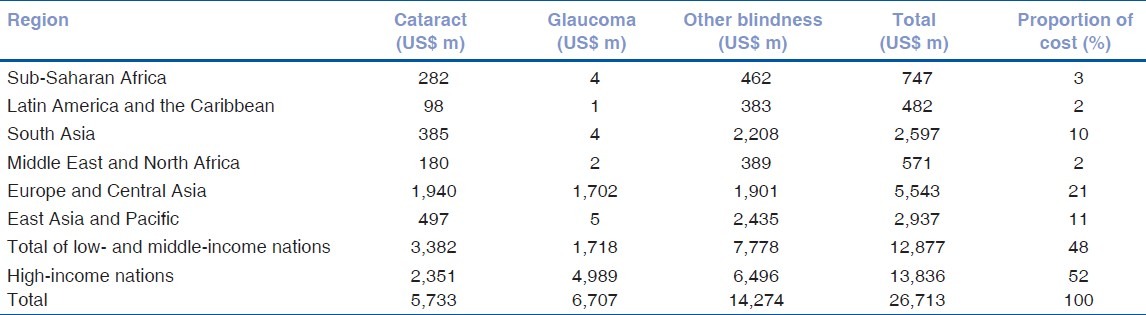
Table 3 shows these treatment costs required to treat the backlog of avoidable blindness by region. Despite the fact that most (90%) of the World's avoidably blind live outside the high-income nations, less than half (48%) of the treatment costs would be spent in these countries.
Table 3.
Treatment costs for people who are avoidably blind by region over 10 years (2011–2020)
Discussion
This costing exercise has provided a more comprehensive view of the costs of eliminating avoidable blindness compared with previous studies.
The purpose of our estimates was to provide an all encompassing estimate of the costs to eliminate avoidable blindness. At the date of publication and to the best of the authors’ knowledge, previous research conducted on the costs of eliminating avoidable blindness uses differing methodologies and hence identified costs appear inconsistent. In recent years, four key similar pieces of research have been conducted:
WHO estimated that $30 billion annually would be required for capacity development to enable the poorest countries to deliver essential health services.[24] This estimate is somewhat lower than our estimate of $127 billion in developing countries. The WHO estimate considered only the poorest countries and only the ‘capacity development’ cost associated with delivery of ‘essential services′; this approach differs conceptually from our approach which focuses on building a sustainable ‘primary’ and ‘secondary’ health care system.
A number of prior studies have attempted to estimate the cost of eliminating avoidable blindness. The IAPB estimated that the cost of delivering VISION 2020 to reduce levels of avoidable blindness and visual impairment in developing countries amounted to $8 billion over 10 years.[25] Their estimates do not consider the primary sector. Our estimate of treating the backlog of avoidable blindness over 10 years for developing countries only was $13.2 billion, which is in a similar range in nominal terms.
Access Economics estimated the direct health care expenditure required for visual impairment to be US$2.3 trillion in 2010 and US$2.8 trillion in 2020.[9] Avoidable blindness prevalence estimates used in this report are the latest WHO estimates, which are significantly lower than those used by Access Economics (285 million in 2011 compared with 733 million in 2010).
The Fred Hollows Foundation estimated that the eradication of avoidable blindness in South East Asia (assuming a total population of some 451 million, including 5.5 million people who are blind) will cost AU$580 million over 10 years.[26] The model frames the ideal eye care system within a four-level pyramid featuring facilities that range from a vision center to a center of excellence. This estimate uses a different population base and methodology: It builds an ideal health system on the basis of the cost of different types of facilities. Our approach builds an ideal health system on the basis of the VISION 2020 human resource to population ratios.
There is a need to improve data across the eye care sector.
The analysis provided in this report was limited by data availability across the eye health sector. As such, the estimates should be used with care. The main data limitations include:
limited data on current expenditure on eye health services in each country,
limited data on country-specific data on visual impairment prevalence–while this data are maintained by the WHO, only region-specific data were publicly available for this report,[25]
limited data about the current workforce and infrastructure in respect to eye health and primary care,
limited data on the cost of training the workforce and providing supporting infrastructure,
out of date and/or surveys that had only been conducted at one point in time,
changes in data collection methods over time, and
the cost of treating the backlog of macular degeneration cases has not been included because it is considered to be prohibitively high and evidence to support the impact of treatment on ceasing blindness is continuing to evolve.
Areas for data and information improvement were considered across the three key facets of the VISION 2020 strategy–cost-effective disease control interventions, human resource development, and infrastructure development:
Cost-effective disease control–there were varying levels of data availability on disease control. For example, regarding cataract disease there were data available on cataract surgical rates, estimates on global prevalence and incidence and treatment cost estimates for developing countries.[6] However, for other conditions, data about surgical or treatment rates and costs are limited. We recommend focusing new research on avoidable blindness conditions that affect large population groups in developing countries,
Human resource development–these costs are a major contributing factor to a sustainable health system. Information about the costs of providing training to the eye health workforce was limited for these estimates, relying on Australian data and a small number of other counties in each World Bank region, including Egypt, Botswana, Romania, India, China, and Russia. Although some information was available across these countries, it was difficult to determine if both the public and student contribution were included in the cost,[27–29] and
Infrastructure development-for these costing estimates, infrastructure costs are tied to eye health workforce needs. For example, the facilities necessary for the secondary sector are determined by the number of additional ophthalmologists needed in a given country (based on VISION 2020 targets), the operating theatre time required by this additional cohort, and the cost to build. This assumed that existing resources are either at or beyond their capacity. We used this method to estimate infrastructure cost across the secondary and primary sectors (the cost of general practitioner [GP] clinics) and to estimate workforce training (the cost of accessing university facilities) because data about specific infrastructure costs have not recently been comprehensively monitored.[27–29]
Investment in better data in the sector will have flow-on effects for the eye health sector, supporting continuous improvement in the delivery of care, and enabling evaluation of the effectiveness of investment in eye health.[24]
Acknowledgments
The Fred Hollows Foundation (FHF) as a lead sponsoring agency engaged PwC, with the assistance of Three Rivers Consulting to estimate the global costs of eliminating avoidable blindness, focusing on the investment required across both primary and secondary health sectors. This research brought together existing literature and limited data sources to develop an initial estimate of these costs, with an aim to improve this estimate in the future as greater data are collected.
We acknowledge The Fred Hollows Foundation, in particular, Andreas Mueller and Beatrice Iezzi, as well as the other sponsoring agencies-the Secretariat of the International Agency for the Prevention of Blindness, Sightsavers International, CBM, Operation Eyesight Universal, Light for the World. We also acknowledge the eye health experts who contributed to the review of this research.
Footnotes
Source of Support: Nil
Conflict of Interest: None declared.
References
- 1.World Health Organization: Visual Impairment and Blindness Fact Sheet 282, 2011. [Last cited 2011 June 23]. Available from: http://www.who.int/mediacentre/factsheets/fs282/e/
- 2.Resnikoff S, Pascolini D, Etya’ale D, Kocur I, Pararajasegaram R, Pokharel GP, et al. Global data on visual impairment in the year 2002. Bull World Health Organ. 2004;82:844–51. [PMC free article] [PubMed] [Google Scholar]
- 3.International Agency for the Prevention of Blindness (IAPB): The Elimination of Avoidable Blindness, Reaching the Goals of VISION 2020, The Right to Sight. 2011. [Updated 2011 Apr 14; Last cited 2012 Aug 19]. Available from: http://www.worldoptometry.org .
- 4.World Health Organization: Action plan for the prevention of avoidable blindness and visual impairment 2009-2013, 2010. [Last cited 2012 Jan 25]. Available from: http://www.who.int/blindness/ACTIO_PLA_WHA62-1-English.pdf .
- 5.World Health Organization: Everybody's Business: Strengthening Health Systems to Improve Health Outcomes: WHO's Framework for Action 2007. [Last cited 2012 Jan 25]. Available from: http://www.who.int/healthsystems/strategy/everybodys_business.pdf .
- 6.IAPB, VISION 2020 and WHO: Global Initiative for the Elimination of Avoidable Blindness: Action Plan 2006-2011. 2007. [Updated 2010 Jan 15; Last cited 2011 Feb 17]. Available from: http://www.vision2020.org/documents/publications/Vision2020_report.pdf .
- 7.Dadzie Y. Final report of the Conference on the Eradicability of Onchocerciasis. 2002. [Last cited 2011 Mar 9]. Available from: http://www.cartercenter.org/documents/1047.pdf . [DOI] [PMC free article] [PubMed]
- 8.World Bank. Data for 2012. [Last cited 2012 Jan 25]. Available from: http://data.worldbank.org .
- 9.Access Economics: The Global Economic Cost of Visual Impairment. 2010. [Last cited 2011 Mar 10]. Available from: http://www.amdalliance.org/user_files/documents/Global%20cost%20of%20VI_FINAL%20report.pdf .
- 10.Access Economics: Future Sight Loss UK (1): The Economic Impact of Partial Sight and Blindness in the UK Adult Population. 2009. [Last cited 2011 Mar 10]. Available from: http://www.vision2020uk.org.uk/ukvisionstrategy/page.asp?sectio=74 .
- 11.Britt H, Miller GC, Charles J, Valenti L, Fahridi S, Pa Y, et al. General practice Series no. 27 AIHW 2010. General Practice Activity in Australia. 2009-10 [Google Scholar]
- 12.Human Resource Development Working Group: Global Human Resource Development Assessment for Comprehensive Eye Care, Vision 2020. 2006. [Updated 2010 Jan 15; Last cited 2011 Mar 10]. Available from: http://www.vision2020.org/documents/WHO%20Publications/Global_Huma_Resource_Development_Assessment_For_Comprehensive_Eye_Care.pdf .
- 13.Organisation for Economic Co-operation and Development (OECD): OECD Health Data, Paris. 2009. [Last cited 2011 Mar 10]. Available from: http://www.oecd.org/document/60/0,3746,e_2649_33929_2085200_1_1_1_1,00.html .
- 14.Pay Scale: Salary Data. 2011. [Last cited 2011 Mar 10]. Available from: http://www.payscale.com .
- 15.Australia Department of Families, Housing Community Services and Indigenous Affairs (FaHCSIA) Rural and Remote Disability Employment Assistance Study. [Last cited 2011 Mar 9]. Available from: http://www.fahcsia.gov.au/our-responsibilities/disability-and-carers/publicationsarticles/policy-research/rural-and-remote-disability-employmentassistance-study .
- 16.Federal Reserve. Foreign exchange rates (Annual) 2012. [Updated 2012 Feb 2; Last cited 2011 Mar 10]. Available from: http://www.federalreserve.gov/releases/g5a/current/
- 17.X-rates.com: Historic exchange rates. [Last cited 2012 Jan 25]. Available from: http://www.xrates.com/cgi-bi/hlookup.cgi .
- 18.Gao Y, Wu L, Li A. Daily cost of glaucoma medications in China. J Glaucoma. 2007;16:594–7. doi: 10.1097/IJG.0b013e318064c818. [DOI] [PubMed] [Google Scholar]
- 19.Jamison DT, Feachem RG, Makgoba MW, Bos ER, Baingana FK, Hofma KJ, et al. Changing Patterns of Disease and Mortality in Sub-Sahara Africa: An Overview. World Bank. (2nd ed) 2006 [PubMed] [Google Scholar]
- 20.Marseille E. Cost-effectiveness of cataract surgery in a public health eye care programme in Nepal. Bull World Health Organ. 1996;74:319–24. [PMC free article] [PubMed] [Google Scholar]
- 21.Australia Institute of Health and Welfare (AIHW): Eye Health in Australia: A Hospital Perspective. 2008. [Updated 2011; Last cited 2011 Mar 10]. Available from: http://www.aihw.gov.au/WorkArea/DownloadAsset.aspx?id=6442459888 .
- 22.World Bank Group: Country and Lending Groups. 2011. [Last cited 2011 June 1]. Available from: http://data.worldbank.org/about/country-classifications/country-and-lending-groups .
- 23.Population Division of the Department of Economic and Social Affairs of the United Nations Secretariat: World Population Prospects: The 2008 Revision. 2008. [Last cited 2011 Mar 2]. Available from: http://esa.u.org/unpp .
- 24.World Health Organization: The Millennium Development Goals will not be attained without new research addressing the health system constraints to delivering effective interventions. Report of the Task Force on Health Systems Research. 2005. [Last cited 2012 Jan 25]. Available from: http://www.who.int/rpc/summit/e/Task_Force_o_Health_Systems_Research.pdf .
- 25.International Coalition of Trachoma Control: Alliance for the Global Elimination of Blinding Trachoma by the Year 2020. 2011. [Updated 2012; Last cited 2011 Mar 10]. Available from: http://www.trachomacoalitio.org/about-us/get-2020 .
- 26.Fred Hollows Foundation: Big Idea - Eliminating Avoidable Blindness in South East Asia and Pacific Region, Submission letter to the Parliamentary Secretary for Foreign Affairs and Trade, Australia. 2010 [Google Scholar]
- 27.Access Economics: The Economic Impact and Cost of Vision Loss in Australia. 2004. [Updated 2012 May 28; Last cited 2011 Mar 10]. Available from: http://www.cera.org.au/uploads/CERA_clearinsight.pdf .
- 28.Chengde Medical College. Information for overseas students. 2009. [Updated 2009; Last cited 2011 Mar 10]. Available from: http://www.at0086.com/CDMU/admissioninformation.aspx .
- 29.Thulasiraj RD, Sundaram RM. Optical services through outreach in South India: A case study from Aravind Eye Hospitals. Community Eye Health. 2006;19:29–30. [PMC free article] [PubMed] [Google Scholar]