

Abstract
Recent research suggests that the genotype of one individual in a friendship pair is predictive of the genotype of his/her friend. These results provide tentative support for the genetic homophily perspective, which has important implications for social and genetic epidemiology because it substantiates a particular form of gene–environment correlation. This process may also have important implications for social scientists who study the social factors related to health and health-related behaviors. We extend this work by considering the ways in which school context shapes genetically similar friendships. Using the network, school, and genetic information from the National Longitudinal Study of Adolescent Health, we show that genetic homophily for the TaqI A polymorphism within the DRD2 gene is stronger in schools with greater levels of inequality. Our results suggest that individuals with similar genotypes may not actively select into friendships; rather, they may be placed into these contexts by institutional mechanisms outside of their control. Our work highlights the fundamental role played by broad social structures in the extent to which genetic factors explain complex behaviors, such as friendships.
There is very little question in the social and medical sciences that “birds of a feather” are far more likely to “flock together” compared with differently feathered birds (1). The likelihood of phenotypically similar individuals having social ties has been observed for race, age, education, religion, personality, political views, and health outcomes and behaviors (1, 2). Social connections among persons with similar characteristics are important because these connections may be linked to the reproduction of current social contexts including concentrated socioeconomic disadvantage or the maintenance of health-related social norms (3, 4).
To date, the bulk of the research on dyadic ties (connections between two people) has stressed the selective and influential roles of social and behavioral factors (5). New evidence suggests that the genotype of one individual is predictive of the genotype of his/her friends (6). The “genetic similarity theory” (7–9) hypothesizes that people maximize their inclusive fitness not only by their mate selection but also by making friends with and helping their most genetically proximate neighbors. As such, the likelihood of genetic homophily in social networks is straightforward to motivate. Further, friends are similar along many traits and behaviors and there is strong evidence that many of these traits and behaviors have large genetic components (10–13). Most friendships are geographically clustered and, to the extent that variation in genotype is also clustered due to historical migration patterns, residential choices, and social policies, social structure may affect the likelihood of genetic homophily.
In a recent publication (6), Fowler et al. used the sibling and twin pair data from the National Longitudinal Study of Adolescent Health to examine the presence of genetic homophily or heterophily among friends. They found evidence for genetic homophily for the TaqI A polymorphism within DRD2. Specifically, when they regressed the respondent’s genotype on the genotype of his/her friends, net of age, race, and sex characteristics of the respondent and his/her friends, they observed a positive and statistically significant regression coefficient (b = 0.11, P < 0.008), which suggests a concordance of genotype among friends within mutually nominated friendships. This is an important finding because, as the authors argue, “homophily and heterophily in friendships, expressed at the genetic level, may have notable implications for our understanding both of the way that our genes can shape our environmental exposures and the way that our social environment can shape our behavior” (ref. 6, p. 3).
Gene–Environment Interplay and the Form of Genetic Homophily
We argue that it is also important to examine the social context in which friendships occur; it is possible that social factors may structure relationships that enable or eliminate the possibility of genetic homophily in friendships. For example, research in the area of gene–environment interplay continues to show that genetic associations are conditional upon environmental exposures (14) and recent work has shown that large social contexts, such as schools, denote important social structures that moderate genetic influences on health and health behaviors (15). To date, however, no existing research has examined the possibility that the relative influence of genetic homophily is contingent upon the social environment in which individuals interact with one another. In this paper, we examine the possibility that the effect of genetic homophily (for DRD2) varies considerably across schools and then we test whether differences in economic inequality and racially stratified peer relations across schools account for observed school-level differences in genetic homophily.
There are reasons to expect that genetic homophily will depend on the social inequality and racial stratification within schools. In highly stratified social settings, characterized by high levels of economic inequality, social factors such as class or race may be the predominant mechanism through which friendships develop. As such, the influence of genetic factors on friendship formation will be reduced or nonexistent because there is very little room for subtle genetic influences to take place. Similarly, schools in which social inequality is relatively low or schools in which racial stratification with respect to friendships is nonexistent provide greater flexibility for individuals to choose their own environment. In these settings, in which there is a greater degree of social latitude (e.g., more opportunities to socialize with dissimilar individuals and greater individual autonomy over friendship selection), genotype may become a relatively more important factor with respect to friendship selection. In this sense, genetic homophily is a selection process called active gene–environment correlation (16) in which environmental selection into a particular neighborhood, school, or friendship takes place in part because of genotype.
Alternatively, it is also possible that genetic homophily will be the highest within social contexts that have the greatest level of social inequality and highest degree of segregation of friends by racial identification. In this case, individuals may be more likely to befriend one another because these contexts may draw upon other social, behavioral, personality, or physical cues that place individuals within social locations (tracks within schools) that are correlated with specific genotypes. In this social structural framework, the correlation of genotypes among friends may be influenced by the forces exerted by certain social structures rather than an active form of friendship selection based on genotype. In other words, if we do not see genetic homophily emerging in the social contexts in which individuals have the greatest degree of social autonomy, then it is likely that the source of homophily is not an active form of gene–environment correlation (16). This perspective does not mean that genetic similarity in friendships is any less important; it simply provides an alternative understanding for the source of this genotypic similarity. That is, genotype may evoke a particular environment for two individuals and this environment sets the stage for genetically similar friendships to emerge. This evocative gene-environment correlation (rGE) perspective is critical to social scientific inquiry into gene–environment interplay because the selective or sorting process is occurring at the level of the social institution (in this case schools) rather than the individual level. The evocative gene–environment correlation model typically focuses on parental–child relationships (e.g., children who are more temperamental may evoke fairly hostile and disciplinary environments from their parents) but the same mechanisms may underlie decisions about course scheduling, academic track, or study groups within classes, all of which will cause genetically similar persons to interact more regularly. This distinction (e.g., active vs. evocative) is important because it allows us to test the assumed, but to date untested mechanism undergirding genetic homophily.
The logic behind this analysis is strong empirical evidence that shared race, sex, and/or socioeconomic status are among the strongest predictors of adolescent friendship patterns found in the literature. As outlined by Zeng and Xie (17), this pattern is likely the result of an interaction between preferences for homophilous friend ties and opportunities to create these ties, and one central aspect of the determination of preferences for homophilous ties is what is socially acceptable to others. From this perspective, greater inequality and heterogeneity may offer more opportunities for heterophilous ties but only if they lead to increased social acceptability of heterophilous relationships. However, most evidence suggests that the opportunity for heterophilous ties is not sufficient to produce these ties because of the strong countervailing social sanctions against these ties (e.g., ref. 18). Students from different populations within the school may be effectively “off limits” for friendships. Hence, in addition to some level of opportunity, there needs to be social latitude for pursuing these friendship links. Therefore, schools with larger shares of “mixed-race” friendships (low racial stratification with respect to friendship links) create an environment that allows greater flexibility for individuals to choose heterophilous ties, as social sanctions are lower for doing so and individuals with a preference for heterophilous ties would allow this preference to be expressed. Similarly, schools with lower social inequality may suggest greater tolerance for heterophilous friend links, which allows these preferences to be expressed.
Data
This study uses data from the National Longitudinal Study of Adolescent Health (Add Health) (19). Add Health was designed to examine health and health-related behaviors among a nationally representative sample of adolescents in 7th through 12th grades. In 1994, 90,118 adolescents from 134 schools completed questionnaires about their daily activities, health-related behaviors, and basic social and demographic characteristics. Following this in-school survey, 20,747 respondents were reinterviewed in their homes between April and December of 1995 (the in-home sample). Two aspects of this dataset are particularly important to us: (i) genetic data, taken from the sibling pairs, and (ii) information on social networks. A genetic subsample of the in-home sample was created, focusing on siblings. Identical and fraternal twins were sampled with certainty. Full siblings were sampled, disproportionately from the saturation sample schools (where all students in the school were sampled for the in-home survey, specifically designed to allow for network-based analysis of entire schools). Individuals in the genetic sample were genotyped for six genes, and here we focus on a gene implicated in the dopaminergic system (the dopamine receptor gene, DRD2) because this gene has demonstrated positive genetic homophily in previous research (6). The Taq 1A polymorphism in the DRD2 gene is also a plausible candidate for friendship selection because it is consistently linked to behavioral phenotypes, such as political ideology (20) and smoking (21), that may increase the likelihood that two individuals will become friends.
The second aspect of the data that makes this study possible is that students were asked to identify their friends in the surveys. Our sample of students consists of all friendship pairs (identified in either the in-school survey or one of the in-home surveys) in which both the ego and the alter had information available on their ethnic backgrounds, sex, and age. Furthermore, the alter needed to have genetic information available whereas the ego needed to both have genetic information and genetic information from siblings, for use in the sibling transmission disequilibrium test. It is worth highlighting the fact that our units of analysis are friendship pairs rather than individuals. We present descriptive statistics for our final analytical sample of 1,503 pairs in Table 1. The sample was largely white and had a slight majority of females. Both egos and alters averaged nearly 15.7 y of age.
Table 1.
Descriptive statistics for all variables used in the analysis
| Mean | SD | ||
| DRD2 genotype | Within | 0.03 | 0.50 |
| Between | 0.46 | 0.60 | |
| Alt | 0.48 | 0.62 | |
| Female | Ego | 0.54 | 0.50 |
| Alt | 0.53 | 0.50 | |
| Age, y | Ego | 15.68 | 1.58 |
| Alt | 15.70 | 1.56 | |
| NH Black | Ego | 0.05 | 0.22 |
| Alt | 0.05 | 0.22 | |
| Native American | Ego | 0.06 | 0.23 |
| Alt | 0.06 | 0.24 | |
| Chinese American | Ego | 0.01 | 0.08 |
| Alt | 0.00 | 0.06 | |
| Filipino | Ego | 0.03 | 0.16 |
| Alt | 0.03 | 0.16 | |
| Korean American | Ego | 0.00 | 0.07 |
| Alt | 0.00 | 0.07 | |
| Puerto Rican | Ego | 0.01 | 0.08 |
| Alt | 0.01 | 0.08 | |
| Mexican–American | Ego | 0.03 | 0.17 |
| Alt | 0.03 | 0.17 | |
| School descriptives | Individuals per school | 36.66 | 93.49 |
| Gini | 0.23 | 0.04 | |
| Alpha | 1.91 | 1.30 |
NH, non-Hispanic.
We restricted analyses to those schools with more than 5 friend pairs. In the 41 schools that met this requirement there was an average of 37 pairs per school. We also considered two measures of school social inequality. Maternal education reports were used to compute Gini coefficients (22) on the basis of the distribution of maternal education within the schools. This estimate describes the proportion of total years of education in a particular school that is cumulatively attained across the distribution of educational attainment (Lorenz curve) to the 45° line in which there is no inequality in education; the value ranges from 0 (perfect equality) to 1 (perfect inequality). The second measure of inequality is the gross friendship segregation measure used in Moody (23). Higher values of this scale indicate increased likelihood that two students will be in a friendship if they are of the same race compared with those who are of different races.
Methods
We extend the model used by Fowler et al. (6) to include information about the clustering of friendships within schools. Consider the basic model presented in Eq. 1 in which the DRD2 genotype of individual j is associated with the DRD2 genotype of his/her friend i, controlling for demographic characteristics (e.g., sex, race, and age) of each individual in the pair (Xi, Xj), and ej describes the error term for individual j. As with Fowler et al. (6) we are sensitive to the possibility of population stratification—a process where the tendency for individuals to reproduce with geographically proximate mates leads to local genetic variation that could become distinct from other localities over time—mechanically inducing some positive correlation in genotypes of geographically proximate individuals. To correct for this, they use the deviation of DRD2 genotype for individual i from the mean genotype of family k in which individual i is nested within family k (shown in Eq. 2, where Wik is 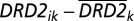 and Bk is simply
  ). The within-pair component (Wik) is robust to population stratification and the slope for this term (β1) captures genetic homophily and denotes the primary focus of this paper:
 |
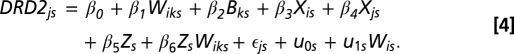 |
Our primary goal is to examine school-level variation in β1 and to provide an alternative explanation of the genetic correlations found in the data between friends. Accordingly, we extend Eq. 2 to a multilevel model in which we allow the genetic homophily coefficient (β1) to be random and to vary from school to school, which is illustrated in Eq. 3. Here, individuals j and i are clustered in schools (s) and the genotypic profiles at the school level are controlled through a random intercepts specification (u0s). Most importantly, the school-level effects of genetic homophily are captured with the random slope u1s. Variation in the effect of genetic homophily is captured with  (SD of the random slope) and it provides support for the hypothesis the genetic homophily is conditioned by local social environments (e.g., if there is no variance in the parameter estimate, then it suggests that the genetic homophily effect is the same across all schools). We then include an interaction between the within-pair genotype coefficient and school-level factor Z (β6ZsWiks). The inclusion of school-level factors and interactions with the genetic homophily coefficient should reduce the level-2 SD (SD of the random slope). That is, changes in the random slope variance indicate the extent to which the measured school factors explain school-level differences in genetic homophily.
Results
As a first step, we estimated general estimating equations similar to those in Fowler et al. (6). Using the same methods, we were able to replicate their main finding of a 0.11 coefficient for the main effect of ego genotype minus siblings’ mean on the alter (see replication model in Table 2). We then estimated a multilevel (random intercept) model including school-level random effects that is otherwise identical to their model. This baseline estimate in Table 2 examines the genetic homophily association after considering the clustering of individuals within schools. There is a large amount of variation in the dependent variable across schools  even after controlling for racial, ethnic, and other demographic covariates. Thus, the genotypic frequencies for DRD2 (the dependent variable) appear to be significantly different across schools. The intraclass correlation coefficient,
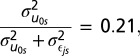 |
Table 2.
Friendship nomination models: pairwise correlations of genotype among friends as a function of school-level characteristics
| Replication |
Baseline |
Model 1 |
||||||||||
| b | pr. < | b | pr. < | b | pr. < | Model 2 | Model 3 | Model 4 | ||||
| DRD2 | ||||||||||||
| Within (β1) | 0.11 | 0.00 | 0.05 | 0.12 | 0.02 | 0.77 | −0.05 | 0.59 | −0.64 | 0.05 | −0.76 | 0.06 |
| Between (β2) | 0.01 | 0.65 | −0.06 | 0.04 | −0.06 | 0.03 | −0.06 | 0.03 | −0.06 | 0.03 | −0.06 | 0.03 |
| School characteristics | ||||||||||||
| Alpha | 0.02 | 0.62 | 0.02 | 0.65 | 0.02 | 0.62 | ||||||
| Gini | −0.44 | 0.77 | −0.57 | 0.71 | −0.60 | 0.69 | ||||||
| Alpha*within | 0.03 | 0.38 | −0.02 | 0.61 | ||||||||
| Gini*within | 2.96 | 0.04 | 3.67 | 0.07 | ||||||||
| N groups | 41 | 41 | 41 | 41 | 41 | |||||||
| N individuals | 1,503 | 1,503 | 1,503 | 1,503 | 1,503 | 1,503 | ||||||
| Random effects | ||||||||||||
SD intercept, 
|
0.29 | 0.30 | 0.31 | 0.30 | 0.30 | |||||||
SD slope, 
|
0.15 | 0.15 | 0.11 | 0.11 | ||||||||
| Cor: u1s, u0s | −0.13 | −0.14 | −0.30 | −0.35 | ||||||||
SD error, 
|
0.59 | 0.57 | 0.56 | 0.56 | 0.56 | 0.56 | ||||||
b, regression coefficient; pr., two-tailed test of significance.
demonstrates that 21% of the genetic variation is occurring across schools and clearly the social context is important. Furthermore, these differences may be the reason why the coefficient (β1 = 0.05, P < 0.12) is reduced to a value that is not significantly different from zero. Once school context is taken into consideration, there does not appear to be any main genetic homophily association, per se.
Model 1 extends the baseline mode by allowing for school-level variation in the influence of ego genotype on the dependent variable. This model adjusts for race, sex, and age but presents only the homophily and school coefficients. The main effect is significantly reduced (β1 = 0.02, not significant) but there is significant variation in this effect across schools [ ; χ2(2) = 9.6, P < 0.01]. In other words, we do not find support for a general sense of genetic homophily. Rather, our results suggest that the genetically homophilous friendships are more common in certain social environments. Our hypothesis is that school-level characteristics related to economic inequality and racial dynamics within schools will explain some of this variability.
Models 2–4 introduce school-level predictors. Model 2 contains the main effect of the racial friendship segregation measure and the maternal education inequality measure (Alpha and Gini, respectively) as well as the interactions of Alpha with the ego genotype. This measure was of limited explanatory power as the SD of the random slopes did not decrease by any noticeable amount. Moreover, neither the main effect of genotype, the segregation measure Alpha and the inequality measure Gini, nor the interaction was statistically significant. However, in model 3 we introduce the interaction of the Gini coefficient and the ego genotype and although we do not demonstrate significance of the main effect of the Gini coefficient, we show a significant (P < 0.05) effect of the interaction of these two variables (β6 = 2.96). More importantly, the SD of the random slope is decreased by roughly one-quarter from 0.15 to 0.11. The substantive interpretation of this interaction is that schools with greater levels of inequality seem to be schools where students are more likely to make friends with those of a similar DRD2 genotype. One causal mechanism that could lead to such a finding would be that highly unequal schools tend to institute academic tracking policies. Grouping by ability, which may induce grouping by race and/or genotype, will constrain the type of “potential friends” because one is more likely to be friends with classmates than with students with whom one does not share time in the same class. These results suggest that genetic homophily exists but the source of homophilous relationships among genetically similar persons may have more to do with external sources of control (e.g., evocative rGE) rather than an active form of gene–environment correlation.
These interactive associations are shown graphically in Fig. 1. Fig. 1, Left characterizes genetic homophily as a function of same race friendships within schools (Alpha) and Fig. 1, Right does the same for socioeconomic inequality (Gini). In both cases, the genetic homophily is plotted for values at the 25th, 50th, and 75th percentiles for the distribution of these measures at the school level. Consistent with the results in Table 2, Fig. 1, Left shows no evidence for genetic homophily except for a weak relationship in schools with highest levels of same-race friendships (this association is not statistically significant). However, as shown in Table 2, genetic homophily appears to be sensitive to the level of socioeconomic inequality within schools such that schools with the highest inequality levels also have the strongest level of genetic homophily but genetic homophily within schools with lowest levels of inequality is not significantly different from zero. It is also important to note that although Gini and Alpha are correlated across schools (r = 0.35), model 4 suggests they provide different information when considering the friendship selection process as a function of genotype. That is, social inequality within schools does not appear to structure genetically homophilous friendships through increased likelihood of same-race friendships.
Fig. 1.

Prototypical plots showing the predicted ego DRD2 genotype as a function of alter’s within-family genotype and levels of Alpha and Gini. The levels of Alpha and Gini are the 0.25, 0.5, and 0.75 quantiles of the distribution of these variables at the school level. Predicted genotypes come from models 2 and 3, respectively, for Alpha and Gini.
Conclusion
Our results both are consistent with and provide important extensions and qualifications to previous research. We find that genetic homophily does play a role in friendship formation. However, it is also clear that social context is a fundamental precursor to these associations. Specifically, when we allow the degree of correlation between friendship genotypes to vary by school, we do not observe any main effect of genetic homophily for DRD2. However, there is substantial variation in genetic homophily across social contexts. Indeed, not only was there a reduction in the overall magnitude of genetic homophily in the sample once we controlled for schools, but also some schools showed genetic heterophily. The substantial variation provides some evidence for the possibility either that nonstratified schools may allow students the greatest flexibility in choosing their friends and hence the most opportunity for genetic homophily to be expressed or that schools differentially structure opportunities for the expression of genetic homophily either implicitly, purely as a function of their stratified student body, or explicitly, through policies such as tracking. Furthermore, when we include school-level controls, we can “explain” part of the variability across schools in levels of genetic homophily in friendships, which gives some suggestive evidence of mechanisms linking specific school characteristics with these friendship choices. Thus, we find strong evidence that social context influences the degree to which genetic correlation in friends may exist, and we show that the evidence for DRD2 homophily depends critically on social context.
This perspective is important. Although it does not necessarily challenge the possibility of genetic homophily, it suggests that social environments such as schools set the stage for more nuanced and typically unobservable selection factors. Our findings suggest that the overrepresentation of genotypically similar individuals into friendships does not appear to be an active process of selection by the students per se. Rather, the results suggest that schools limit the scope of possible friendship formations because of institutional forces placed upon their students. We use the language of “evocative” gene–environment correlation because we believe that genotype may evoke a particular environment to which individuals are exposed rather than individuals actively selecting certain environments. These mechanisms may have antecedents within each student’s educational career that have accumulated over time or they could be linked to specific decisions regarding course selections or sport participation.
Importantly, our study focuses on school environments but we believe that similar associations may be relevant in more broadly defined social environments. There are pronounced differences in social inequality across and within countries and different historical periods. As such, changes in the relative importance of genetic homophily as a source of relationship ties as well as the mechanism for homophilous relationships (e.g., active rGE or evocative rGE) may be predicated on historical and geographic changes in the distribution of social and economic resources. Although this is certainly beyond the scope of this paper, the clear differences across schools provide a rationale for pursuing these questions on a larger social scale.
Our findings have further import because they show the necessity of including factors from the social context in studies examining genetic selection mechanisms as well as in studies examining genetic effects on behaviors. Twin and sibling studies suggest that most behavioral choices have strong genetic components, but if shared understandings of these behaviors (like smoking) take place among discrete groups of friends, who are also genotypically similar, then norm formation and reinforcement are not independent of observable genotype in the way often assumed in traditional empirical research. More generally, our work suggests the need for greater infusion of social context measures and theory in genetic studies and also highlights the need for genetic factors to be incorporated into sociological theories of friendship selection and influence. We encourage other researchers to consider this possibility in future research studies.
We also encourage future researchers to exploit alternate statistical methods to evaluate these processes. For example, our analyses examine genetic similarity among individuals who are already friends with one another. However, another question is as follows: Given all pairs of individuals in a particular context, do similarities in their genotypes predict an increase in the probability of their being friends? This requires information on nonfriends and it cannot be answered with the methods previously discussed. However, exponential random graph models (ERGMs; e.g., refs. 24 and 25) can potentially answer such a question. With currently available data, only a small number of schools (five) contain enough pairs of individuals with complete data. Initial results from estimating ERGM models in these five schools generally support the results in Fowler et al. (6), but we also observed intriguing differences in the school-level genetic homophily suggested by the random-effects estimates of Table 2 and the ERGM estimate. However, due to the small sample sizes that are available these results are very preliminary. We plan on conducting a more comprehensive investigation using these models when the necessary data become available.
Finally, these findings are particularly important to social scientific inquiry because recent research on gene–environment interplay has emphasized gene–environment interaction (G × E) (15) rather than gene–environment correlation (rGE). Some have argued that operationalizing the environment using macrolevel contexts such as state of residence reduces the likelihood that rGE is driving the G × E findings (13). That is, if individuals with particular genotypes actively select (or are selected into) particular environments, then it is statistically and substantively difficult to tease apart rGE from G × E effects. This is important because many of the phenomena studied by social scientists may be partially influenced by subtle rGE mechanisms. Marriage, fertility, and migration have all demonstrated moderately sized heritability estimates (26, 27) but it is also possible that genotype is associated not only with the socially relevant activities (e.g., marital status, employment status, residential location, engagement in unhealthy behaviors, etc.) but also with whom one interacts when engaged in these activities. This distinction complicates the notion of “environmental exposure” and it suggests that nonrandom (and now measurable) factors may lead similarly oriented persons to form social ties. Most importantly, it suggests that social interactions over the long term may occur increasingly among genetically similar persons. Thus, although social mechanisms may set the stage for this source of homophily, is also possible that homophilous relationships can affect the composition of the environment.
Acknowledgments
This research uses data from the National Longitudinal Study of Adolescent Health (Add Health), a program project designed by J. Richard Udry, Peter S. Bearman, and Kathleen Mullan Harris and funded by Grant P01-HD31921 from the Eunice Kennedy Shriver National Institute of Child Health and Human Development, with cooperative funding from 23 other federal agencies and foundations. We thank Ronald R. Rindfuss and Barbara Entwisle for assistance in the original design. Persons interested in obtaining data files from Add Health should contact Add Health, Carolina Population Center, 123 W. Franklin Street, Chapel Hill, NC 27516-2524 (addhealth@unc.edu). This paper is part of a larger study funded by the National Institute of Child Health and Human Development (R01HD060726). Research funds were also provided by the National Institutes of Health/ National Institute of Child Health and Human Development-funded University of Colorado Population Center (R24HD066613). The authors also acknowledge funding from the National Institute of Child Health and Human Development (1R21HD071884). J.M.F. thanks the Robert Wood Johnson Foundation Health and Society Scholars Program for financial support.
Footnotes
The authors declare no conflict of interest.
This article is a PNAS Direct Submission.
References
- 1.Goodreau SM, Kitts JA, Morris M. Birds of a feather, or friend of a friend? Using exponential random graph models to investigate adolescent social networks. Demography. 2009;46:103–125. doi: 10.1353/dem.0.0045. [DOI] [PMC free article] [PubMed] [Google Scholar]
- 2.Berkowitz WR. Perceived height, personality, and friendship choice. Psychol Rep. 1969;24:373–374. doi: 10.2466/pr0.1969.24.2.373. [DOI] [PubMed] [Google Scholar]
- 3.Christakis NA, Fowler JH. The spread of obesity in a large social network over 32 years. N Engl J Med. 2007;357:370–379. doi: 10.1056/NEJMsa066082. [DOI] [PubMed] [Google Scholar]
- 4.Boardman JD, Saint Onge J, Rogers RG, Denney J. Race differentials in obesity: The impact of place. J Health Soc Behav. 2005;46:229–243. doi: 10.1177/002214650504600302. [DOI] [PMC free article] [PubMed] [Google Scholar]
- 5.Lazarsfeld P, Merton R. In: Friendship As Social Process. Berger M, Abel T, Page CH, editors. Princeton: Van Nostrand; 1954. pp. 18–66. [Google Scholar]
- 6.Fowler JH, Settle JE, Christakis NA. Correlated genotypes in friendship networks. Proc Natl Acad Sci USA. 2011;108:1993–1997. doi: 10.1073/pnas.1011687108. [DOI] [PMC free article] [PubMed] [Google Scholar]
- 7.Rushton J. Genetic similarity, human altruism, and group selection. Behav Brain Sci. 1989;12:503–559. [Google Scholar]
- 8.Rushton J. Genetic similarity in male friendships. Ethol Sociobiol. 1989;10:361–373. [Google Scholar]
- 9.Rushton J. Inclusive fitness in human relationships. Biol J Linn Soc Lond. 2009;96:8–12. [Google Scholar]
- 10.Guo G. Genetic similarity shared by best friends among adolescents. Twin Res Hum Genet. 2006;9:113–121. doi: 10.1375/183242706776402920. [DOI] [PubMed] [Google Scholar]
- 11.Plomin R, DeFries J, McClearn G, McGuffin P. Behavior Genetics. 4th Ed. New York: Worth; 2001. [Google Scholar]
- 12.Plomin R, DeFries J, Craig I, McGuffin P. Behavior Genetics in the Postgenomic Era. Worth Publishers, Washington, DC: 2003. [Google Scholar]
- 13.Boardman JD. State-level moderation of genetic tendencies to smoke. Am J Public Health. 2009;99:480–486. doi: 10.2105/AJPH.2008.134932. [DOI] [PMC free article] [PubMed] [Google Scholar]
- 14.Freese J, Shostak S. Genetics and social inequality. Annu Rev Sociol. 2009;35:107–128. [Google Scholar]
- 15.Boardman JD, Saint Onge JM, Haberstick BC, Timberlake DS, Hewitt JK. Do schools moderate the genetic determinants of smoking? Behav Genet. 2008;38:234–246. doi: 10.1007/s10519-008-9197-0. [DOI] [PMC free article] [PubMed] [Google Scholar]
- 16.Shanahan MJ, Hofer SM. Social context in gene-environment interactions: Retrospect and prospect. J Gerontol B Psychol Sci Soc Sci. 2005;60(Spec No 1, Special Issue):65–76. doi: 10.1093/geronb/60.special_issue_1.65. [DOI] [PubMed] [Google Scholar]
- 17.Zeng Z, Xie Y. A preference-opportunity-choice framework with applications to intergroup friendship. AJS. 2008;114:615–648. doi: 10.1086/592863. [DOI] [PMC free article] [PubMed] [Google Scholar]
- 18.Mayer A, Puller SL. The old boy (and girl) network: Social network formation on university campuses. J Public Econ. 2008;92:329–347. [Google Scholar]
- 19.Harris KM, Udry JR. 2012. National Longitudinal Study of Adolescent Health (Add Health), 1994–2008. ICPSR21600-v10. Inter-university Consortium for Political and Social Research, distributor (Ann Arbor, MI), 10.3886/ICPSR21600.v10.
- 20.Dawes CT, Fowler JH. Partisanship, voting, and dopamine D2 receptor Gene. J Polit. 2008;71:1157–1171. [Google Scholar]
- 21.Styn MA, et al. The impact of genetic variation in DRD2 and SLC6A3 on smoking cessation in a cohort of participants 1 year after enrollment in a lung cancer screening study. Am J Med Genet B Neuropsychiatr Genet. 2009;150B:254–261. doi: 10.1002/ajmg.b.30801. [DOI] [PMC free article] [PubMed] [Google Scholar]
- 22.Gini C. Measurement of inequality of incomes. Econ J. 1921;31:124–126. [Google Scholar]
- 23.Moody J. Race, school integration, and friendship segregation in America. Am J Sociol. 2001;107:679–716. [Google Scholar]
- 24.Wasserman S, Pattison P. Logit models and logistic regressions for social networks. An introduction to Markov graphs and p*. Psychometrika. 1996;61:401–425. [Google Scholar]
- 25.Snijders TA, Pattison PE, Robins GL, Handcock MS. New specifications for exponential random graph models. Sociol Methodol. 2006;36:99–153. [Google Scholar]
- 26.Johnson W, McGue M, Krueger RF, Bouchard TJ., Jr Marriage and personality: A genetic analysis. J Pers Soc Psychol. 2004;86:285–294. doi: 10.1037/0022-3514.86.2.285. [DOI] [PubMed] [Google Scholar]
- 27.Kohler H, Rodgers J, Christensen K. Is fertility behavior in our genes? Findings from a Danish twin study. Popul Dev Rev. 1999;25:253–288. [Google Scholar]