Abstract
OBJECTIVES:
CD4+ regulatory T cells (Tregs) seem to have a key role in persistence of hepatitis B virus (HBV) infection. Notch and transforming growth factor (TGF-β) signaling independently help in the differentiation and regulation of CD4+T cells, including T-helper (TH) 1, TH2, and Tregs. Whether, the two pathways have modulatory role on different stages of HBV infection and severity of liver disease is not clear. We investigated Notch and TGF-β families' gene expression in peripheral blood and intrahepatic lymphocytes in patients with different stages of chronic HBV (CHB) infection.
METHODS:
Peripheral blood mononuclear cells (PBMCs), CD4+, and CD8+ T cells were isolated from patients with acute HBV (AVH-B, n=15), CHB (n=16), and controls (HC, n=10). In addition to PBMCs, intrahepatic lymphocytes were obtained from liver biopsies from CHB (n=12), cirrhosis (n=12), hepatocellular carcinoma (HCC, n=5), and healthy livers (n=5). Notch family (Notch1–4, Hes1, Jag1, and NF-kβ) and TGF-β family gene expressions were studied by real-time PCR, flow cytometry, and immunohistochemistry.
RESULTS:
Relative expression of Notch signaling target genes, Hes1 and NF-kβ, was higher in the total PBMCs of AVH-B and CHB patients than that in HC patients (Log relative quantification (RQ); 1.1 AVH-B vs. 0.3 HC, 1.3 CHB vs. 0.3 HC; P=0.02). CD8+ T cells showed upregulated expression of Hes1 and Notch1 (P=0.02 and 0.01, respectively) in AVH-B than in CHB patients. Also, in AVH-B patients, HBV-specific CD8+ T-cell proliferation (5.74% vs. 2.7%) and TGF-β signaling activity were higher. All Notch receptors and ligands were upregulated in the PBMCs in CHB infection (CHB vs. cirrhosis, P=0.001; CHB vs. HCC, P=0.023; and cirrhosis vs. HCC, P=NS). Intrahepatic expression of Notch1 and FoxP3 were significantly higher in cirrhotics and HCCs, and further blockage of Notch signaling reduced the FoxP3 expression. Array data of TGF-β family showed increased TGF-β3, TGF-α, SMAD3, SMAD4, SMAD6, and GDF9 expression on intrahepatic lymphocytes in cirrhotic and HCC patients compared with CHB.
CONCLUSIONS:
Our findings suggest that there is a complementary association between Notch1 and Hes1 in CD8+T cells during AVH-B infection. On development of CHB infection, repression of the Notch receptors mediates the regulation of immune response in patients, who progress to cirrhosis and HCC. Finally, HBV infection drives increased Notch1, TGF-β, and FoxP3 expression on intrahepatic T cells in cirrhosis, resulting in fibrogenesis and disease progression.
INTRODUCTION
Hepatitis B virus (HBV) is a serious public health problem around the world and major cause of chronic hepatitis, cirrhosis, and hepatocellular carcinoma (HCC). Approximately 2 billion people have serological evidence of past or present HBV infection and more than 360 million people are with chronic HBV (CHB) infection.1 It is reported that 15–40% of HBV-infected patients would develop cirrhosis, liver failure, or HCC.2 Around 78% of chronic hepatitis B patients live in Asia and the Western Pacific countries. Out of 6,50,000 people who die from HCC each year, two-thirds are from Asia.3 HCC is one of the most common malignant tumors in Asia and also in India.4
Notch is an evolutionally conserved molecule and controls cell-fate decision in a variety of cells. Notch signaling regulates its activities through the expression of several target genes, including Hes, HEY, transcription nuclear factor kB (NF-kB),T-bet, the pro-inflammatory cytokine interferon-γ (IFN-γ), interleukin-4, and enhancer CNS2.5 Involvement of Notch signaling is being reported in different cancers,5, 6, 7 including aberrant Notch3 and 4 expression in HCC,8 in early stages of T-cell development, peripheral T-cell activation, differentiation of various CD4+ T-helper subsets (including T-helper (TH) cells TH1, TH2, and regulatory T cells (Tregs)), and the generation of T-cell tumors.5, 9, 10 Overexpressed Notch1 and Hes1 were reported in skewed expression of CD4/CD8 T cells.9 Transforming growth factor beta 1 (TGF-β1) is a pleiotropic anti-inflammatory cytokine that also has been implicated in regulatory T-cell differentiation. Human and mouse CD4+CD25+ Tregs express the transcription factor FoxP3, and naive T cells can be converted into Tregs with stimulation and in the presence of TGF-β1.11 Although the in vivo relevance of peripheral regulatory T-cell generation is not completely clear, it is thought that TGF-β1 is required for the maintenance of the peripheral Treg pool,12 and the cross-talk between the Notch and TGF-β signaling pathways through intracellular mediators, Smad3, is evident.13, 14
The spectrum of HBV infection varies from acute hepatitis to chronic hepatitis B, cirrhosis, and HCC. Because Notch signaling relates to the organ of inflammation and injury, we undertook to study the Notch signaling pathways at different stages of HBV-related hepatic injury and also assessed the involvement of Notch in regulating the FoxP3-expressing Tregs in the peripheral blood mononuclear cells (PBMCs) and liver. Here we have demonstrated that the target gene Hes1 of Notch signaling is upregulated in CD8T cells in acute HBV (AVH-B) infection, making them to proliferate and transform into IFN-γ-producing effector T cells. Although there was downregulation of Notch signaling molecules during CHB infection, the expression was again increased with the development of cirrhosis and HCC. This study shows that Notch1 induces FoxP3 expression in the intrahepatic lymphocytes in HBV-infected cirrhosis. A close correlation of TGF-β1 expression with Notch signaling from the stage of CHB to cirrhosis and HCC could explain the association between the two pathways in disease progression with CHB infection.
METHODS
Human subjects ethics statement
An institutional ethics committee (G. B. Pant Hospital and Institute of Liver and Billiary Sciences, New Delhi, India) approved the study protocol and all study subjects provided informed consent. Project was started in May 2009.
Subjects
Inclusion criteria
Patients with AVH-B (n=15) were diagnosed by clinical symptoms of acute hepatitis, serum levels of alanine aminotransferase >10 times the upper limit of the normal with no previous history, and clinical, biochemical, or radiological evidence of chronic liver disease. Patients were HBsAg positive, HBeAg positive, anti-HBe negative, IgM anti-HBc positive and anti-HBs negative. Only peripheral blood was collected from these patients. Patients with CHB (n=16) were diagnosed if they were positive for HBsAg for more than 6 months, had raised alanine aminotransferase (>1.5 times upper limit of the normal), and presented with histological evidence of chronic hepatitis. Cirrhosis (n=12) was diagnosed based on radiological, histological, and endoscopic evidence of portal hypertension, and HCC (n=9) was diagnosed based on classical radiological features of arterial enhancement and venous washout with raised alfa-feto protein and if needed histological confirmation on biopsy or surgical specimens. PBMCs and CD4+ T cells were isolated from healthy controls (HC; n=10) with normal alanine aminotransferase levels, normal abdominal ultrasound, negative for HBsAg, anti-HBe, IgG anti-HBc, anti-HCV, IgM anti-HEV, IgM anti-HAV, and anti-HIV, and no previous history or current evidence of liver disease. Liver biopsies were also collected surgically from healthy areas adjoining the pathological lesions from patients who went for surgery for gall bladder carcinoma, hepatic resections, hydrated disease, or cholangiocarcinoma after obtaining informed consent.
The tissues were collected and stored in liquid nitrogen. Paraffin-embedded biopsy samples were used for immunohistochemistry. Biopsy and tissue samples were also used to make protein extract for western blotting.
Exclusion criteria
The patients with regular alcohol consumption (>40 g per day for the past 5 years), diabetes, severe systemic illness, pregnancy, coinfection with HIV or other hepatic viruses, or receiving immunosuppressive therapy for other associated illness were excluded.
From the selected patients and healthy controls, peripheral blood was collected in an EDTA-coated tube. Plasma samples were stored at −20 °C. The biochemical assessment was done according to the study protocol.
Isolation of PBMCs and liver infiltrated lymphocytes (LILs)
PBMCs were isolated by Ficoll–Hypaque density gradient centrifugation from 10–15 ml of blood collected in EDTA vial. LILs were isolated from liver tissues obtained, and liver tissues were carefully washed with Hank's solution containing 2% fetal calf serum and 1% EDTA to remove peripheral blood, whittled into small pieces, and homogenized. The resulting cell suspension was passed through a 70-μm cell strainer (BD Labware, Franklin Lakes, NJ, USA) and centrifuged. The upper part of suspension was carefully recovered and layered on the Ficoll–Hypaque separation solution. LILs were then isolated by density gradient centrifugation. The viability of isolated cells was determined by trypan blue exclusive staining. In general, >1 × 10⁶ LIL could be obtained from 1 g of liver tissue and viable LILs were >85–90%.
Isolation of CD4+ and CD8+ T cells from PBMCs and detection of HBV-specific responses
CD4+ and CD8+ T cells were isolated by indirect magnetic labeling method (Miltenyi Biotec, Friedrich-Elbert, Germany) using the manufacturer's protocol. CD4+ and CD8+T cells were checked for purity. To determine the frequency of IFN-γ, cytokine producing CD8+ T cells, 2 × 10⁵ CD8+ cells were plated in triplicate, in the presence of 1 μg/ml anti-CD28 monoclonal antibody and stimulated with phorbol myristic acetate (3 ng/ml) and ionomycin (100 ng/ml) (positive control), pool of 15-mer peptides overlapping by 10 residues (OLP) spanning HBV surface and core of HBV genotype D (10 μℳ), and medium alone as a negative control. After the first 1 h of incubation, Brefeldin-A (Sigma, St Louis, MO, USA) at a final concentration of 10 μg/ml was added. After overnight incubation at 37 °C with 5% CO2, the cells were first stained with PECy7-anti-CD3, FITC-anti-CD8 and then washed, centrifuged, permeabilized, fixed, and stained with PE-anti-IFN-γ. After staining, the cells were acquired for flow-cytometric analyses using FACS Calibur and the results were analyzed using the Flow-Jo software (Tree Star, Inc., Ashland, OR, USA).
Total RNA isolation and mRNA analysis
Extraction of total RNA was done from PBMCs, CD4+T cells, and LILs. The quality and quantification of the RNA was checked and estimated by agarose gel electrophoresis and spectrophotometric analysis. A total of 1–2 μg of the RNA was used for cDNA preparation.
Quantitative real-time PCR for Notch signaling molecules and FoxP3 was performed in triplicate in a 7900 ABI Prism Sequence Detection system using the Syber Green kit and specific primers (Table 1) for Notch1, Notch2, Notch3, Notch4, Hes1, Jag1, NF-kβ, and FoxP3, with Primer Express 1.5 software (Applied Biosciences, Carlsbad, CA, USA). Amplification of β-actin and 18S was used as the control for normalization. For TGF-β signaling, we have used a 48-format custom-designed array of TGF-β signaling from ABI, where we have included all the genes (Table 2). To normalize results within each individual group, total RNA was extracted from pooled PBMCs or LILs (n=6) per group using the Qiagen RNA extraction easy kit (Valencia, CA, USA) and cDNA was prepared. Relative quantification of each gene was analyzed by calculating the Log RQ of each sample Ct value.
Table 1. List of primer sequences used in real-time real-time PCR.
| Gene | Primers |
|---|---|
| Notch1 | 5′-CGGGTCCACCAGTTTGAATG-3′ 5′-GTTGTATTGGTTCGGCACCAT-3′ |
| Notch2 | 5′-GTGCAGGAATTGGAAAGTTGGA-3' 5′-GGCCGCTTCAGAGGAAAAG-3′ |
| Notch3 | 5′-GCCATCTCCCTTTGGGAACT-3′ 5′-CCACATTTACAGGGACATAAAGGA-3′ |
| Notch4 | 5′-CCAAGAAATGCCCATAAACCAA-3′ 5′-GCCTTTTAATGGGTAATCATTTTTG-3′ |
| Hes1 | 5′-GGACATTCTGGAAATGACAGTGAA-3′ 5′-AGCGCAGCCGTCATCTG-3′ |
| Jag1 | 5′-CCAGGTCTTACTACGGAGCACATT-3′ 5′-CGCAAGCGATGTAGATTGAATATT-3′ |
| NF-KB | 5′-TGATCACCAACCAGCCAGAA-3′ 5′-TCTCGGAGCTCAGGATCACA-3′ |
| β-Actin | 5′-CCAGCTCACCATGGATGATG-3′ 5′-ATGCCGGAGCCGTTGTC-3′ |
Table 2. List of genes in ABI custom-designed TGF-β signaling pathway array.
| Gene symbol | 1 | 2 | 3 | 4 | 5 | 6 |
|---|---|---|---|---|---|---|
| A | 18S | GAPDH | HPRT1 | GUSB | RHOA | RAC |
| B | BMP2 | BMP4 | BMP5 | BMP6 | BMP7 | SMURF1 |
| C | SMURF2 | SMAD1 | SMAD2 | SMAD3 | SMAD4 | SMAD5 |
| D | SMAD6 | SMAD7 | SMAD9 | TGFA | TGFB1 | TGFB2 |
| E | TGFB3 | TGFBR1 | TGFBR2 | TGFBR3 | MAP3K7 | MAPK3 |
| F | MEKK1 | MAPK1 | MLC | MLK3 | P38 | RAS |
| G | BMPR1B | BMPR2 | GDF2 | GDF9 | GDF10 | IL6 |
| H | TNF | IFNG | FOXP3 | IL-2R | ROCK2 | PAK |
Flow-cytometric analysis
PBMCs and LILs were stained with anti-CD4-Pecy7 anti-CD25 APC (BD Pharmingen) for surface markers, then permeabilized and fixed using cytofix/cytoperm (BD Pharmingen, San Jose, CA, USA), using the manufacturer's instructions, followed by FITC-anti-FoxP3 and PE- anti-Notch1 staining.
Anti-Notch1 FACs antibody was procured from eBiosciences (clone mN1A), and mN1A antibody reacts with the intracellular domain of human Notch1. The mN1A antibody has a low affinity for the full-length (unprocessed or heterodimeric cell surface) forms of Notch1. Therefore, Notch1 expression was considered intracellular not surface expression.
After staining, the cells were acquired for flow-cytometric analyses using FACS Calibur and the results were analyzed using the Flow-Jo software.
Notch signaling inhibition with N-[N-(3, 5-difluorophenacetyl)-l-alanyl]-S-phenylglycine t-butyl ester (DAPT) treatment
A solution of 10 mℳ stock of γ-secretase inhibitor DAPT (Sigma) was prepared in 100% dimethyl sulfoxide. Approximately 50,000 cells were plated in Roswell Park Memorial Institute medium with 10% fetal calf serum and 1% Penstrap in 96-well plates. Untreated cells were incubated in the culture medium without inhibitor, in other wells, and cells were stimulated with CD3 and CD28 (1 ug/ml each) and then treated with 5, 10, and 20 μℳ DAPT (Sigma) for 48 h. Subsequently, cells were stained with Notch1-PE and FoxP3-FITC (eBiosciences) antibodies and acquired with CyAn flow cytometer and analyzed.
Western blotting
Tissue homogenates of cirrhotic and HCC from liver explants were prepared in ice-cold RIPA buffer. Protein samples (50 μg) from tissues were separated on sodium dodecyl sulfate polyacrylamide gel, transferred on polyvinylidene fluoride membrane (Immobilon-P; Millipore, Billerica, MA, USA), and blotted using different primary antibodies directed against Smad2/3 (Santa Cruz Biotechnology, Santa Cruz, CA, USA) 1:800, phospho-Smad3C (Ser423/425 ) (Cell Signaling) 1:500, TGF β1 (Santa Cruz Biotechnology) 1:800, and β-actin (Santa Cruz Biotechnology) 1:2,000, and visualized following the addition of horseradish peroxidase-conjugated secondary antibodies (Santa Cruz Biotechnology). Membranes were revealed using a chemioluminescence detection kit (EZ-ECL; Biological Industries, Israel-Haemek Ltd., Kibbutz Beit-Haemek, Israel).
Immunohistochemistry
All the samples used for immunohistochemistry were serologically proven to be HBV-related. Immunohistochemistry staining was performed on 3 μm sections of paraffin-embedded biopsy and resected liver tissue specimen. Immunohistochemistry was performed on HCC (n=10), cirrhosis (n=8), chronic hepatitis (n=8), and HC (n=5). Sections were stained with chromogen DAB (DAKO, Suyog Diagnostics Pvt. Ltd., Mumbai, India) and counterstained with hematoxylin. The condition for use of primary rabbit polyclonal antibody were optimized and the FoxP3 antibody (Abcam, St Louis, MO, USA) was used at 1:60, Notch1 at 1:50, and Notch3 (Santa Cruz Biotechnology) at 1:25 dilution.
Grading on Notch1 and Notch3 expression was given as: strong, moderate, weak, and no staining. Cellular localization of the respective protein expression was also carefully observed.
Statistical analysis
All the data comparisons are expressed as mean with s.d. Non-parametric Mann–Whitney U-test was used to calculate P values. The significance is indicated with a P value <0.05.
RESULTS
Clinical and virological characteristics of subjects affected by HBV
The clinical and virological characteristics of the patients are shown in Table 3. There were no significant differences in the age and sex in all groups, but aspartate aminotransferase, alanine aminotransferase, and bilirubin levels were significantly higher (P≥0.05) in AVH-B patients than in other groups.
Table 3. Clinical and virological characteristics of the subjects enrolled in the study.
| Parameters | HC (n=10) | AVH-B (n=15) | CHB (n=16) | Cirrhosis (n=12) | HCC (n=9) | P values |
|---|---|---|---|---|---|---|
| |
|
|
|
|
|
(AVH-B vs. HC)*, (AVH-B vs. CHB )**, and (CHB vs. cirrhosis and HCC)*** |
| Age (years), mean±s.d. | 28±5 | 33±19 | 37±7.78 | 46±16 | 51±14 | NS |
| Sex (M:F) | 7:3 | 11:4 | 12:4 | 10:2 | 7:2 | NS |
| AST (IU/l), median (range) | 29 (27–35) | 605 (52–2498) | 103 (25–253) | 55 (22–106) | 69 (22–146) | (P=0.02)*, (P=0.015)** |
| ALT (IU/l), median (range) | 32 (30–34) | 1170 (470–4329) | 92 (26–236) | 64 (33–106) | 65 (31–98) | (P=0.02)*, (P=0.000)** |
| Serum bilirubin (mg/dl), median (range) | 0.8 (0.6–1.2) | 10.0 (0.5–33.6) | 1 (0.6–25) | 1.5 (0.5–3.5) | 1.2 (1–3) | (P=0.02)* |
| Albumin (g/dl), median (range) | 4.2 (3.8–4.2) | 3.90 (2.3–4.8) | 4.0 (3.8–4.5) | 3.2 (2.5–3.8) | 3.0 (2.5–4) | NS |
| HBV DNA (mean±s.d.; log 10 copies per ml) | — | 2±0.7 | 6.4±2 | 5.3±1.8 | 5.0±1.8 | (P=0.03)* |
ALT, alanine aminotransferase; AVH-B, acute HBV; AST, aspartate aminotransferase; CHB, chronic HBV; F, female; HCC; hepatocellular carcinoma; HBV, hepatitis B virus; M, male.
P value was calculated between AVH-B patients vs. HC, as well as CHB vs. cirrhosis and HCC.
Expression of Notch1 and its ligands in AVH-B infection in order to promote CD8+ T-cell response
In order to understand the role of Notch1, its ligand Jag1, its targets Hes1 and NF-kβ in the pathogenesis of hepatitis B, we quantified the mRNA expression levels in peripheral PBMCs, CD4+, and CD8+T cells in healthy controls and those with AVH-B and CHB infection.
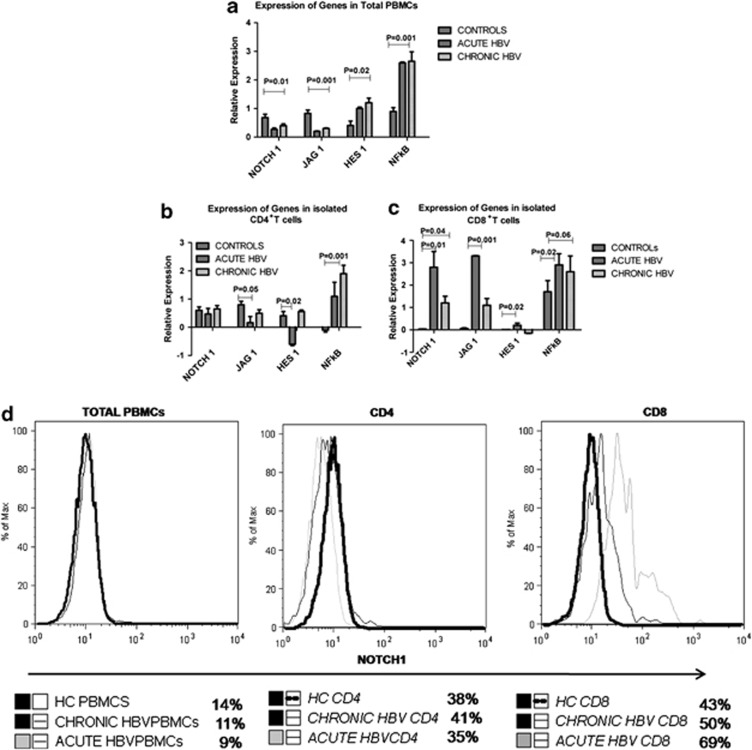
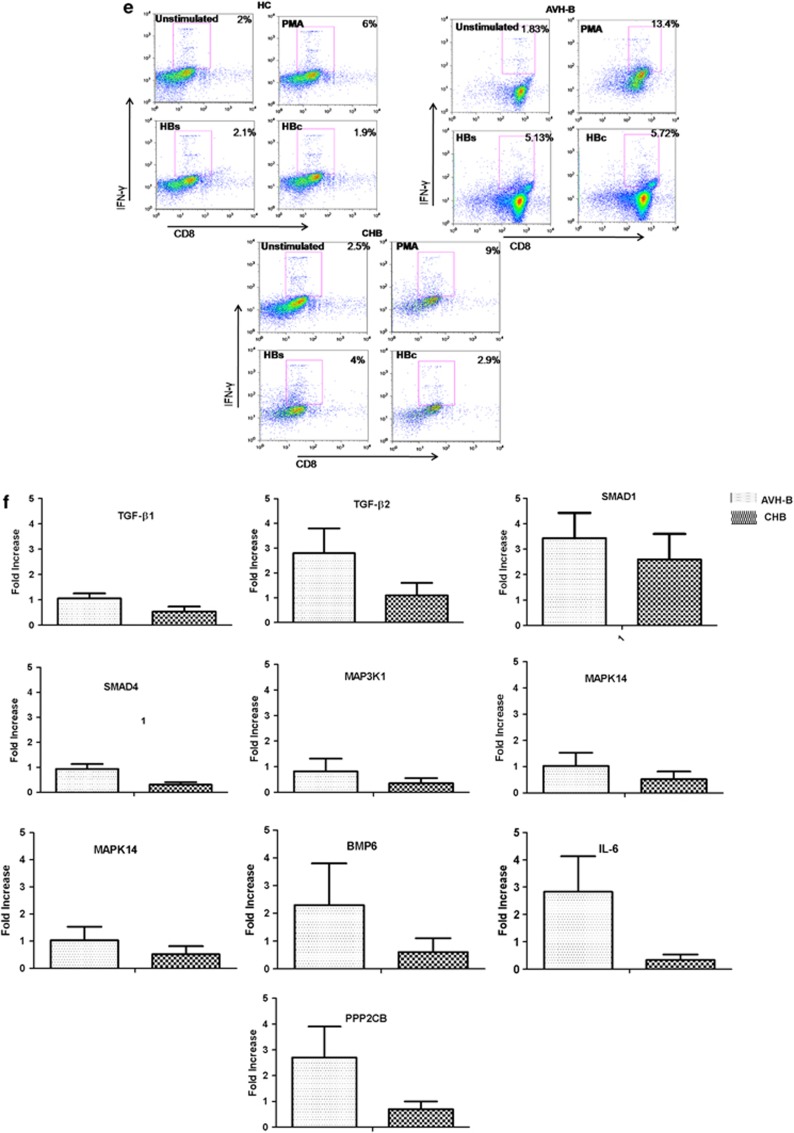
In total PBMCs, Notch1 and Jag1 expression were lower in AVH-B compared with HC and CHB subjects (Figure 1a), whereas Hes1 and NF-kβ expression were increased in both HBV-infected groups (Figure 1a, P=0.02, P=0.001). In CD4+ T cells, Hes1 expression was lower among those with AVH-B, whereas their expression in CHB-infected subjects was similar to HC (Figure 1b, P=0.02). In contrast, Notch1, Jag1, and Hes1 expression were upregulated in CD8+ T cells of AVH-B subjects compared with the other groups (Figure 1c, P=0.01). The expression of Notch1 in CD8 T cells during AVH-B infection was higher (Figure 1d). Significantly, higher percentage of proliferative CD8+ T cells from AVH-B subjects responded to HBV pooled peptides by secreting IFN-γ (Figure 1e) than those from CHB and healthy controls (P=0.02). Quantitative PCR results of ABI custom-designed TGF-β signaling array (Table 2) also showed increased expression of TGF-β1, TGF-β2, SMAD1, SMAD4, MAP kinases, BMP6, and PPP2CB mRNA expression in AVH-B than that in CHB patients (Figure 1f).
Figure 1.
Increased Notch1 expression in acute HBV (AVH-B). Quantitative real-time PCR analysis of selected Notch family genes. Notch1, JAG1, HES1, and NFkβ were used for expression data in (a) total peripheral blood mononuclear cells (PBMCs) (b) CD4+ T cells, and (c) CD8+ T cells of controls (HC), AVH-B, and chronic HBV (CHB) patients. Results indicate relative expression levels as ratios of normalized mean gene expression of infected patients were compared with healthy controls. (d) Representative figure for flow-cytometric analysis showing increased Notch1 expression in CD8T cells in AVH-B patients (e) Flow-cytometric analysis showing frequency of IFN-γ producing CD8+ T cells when stimulated by HBs and HBc pooled peptides in HC, CHB and AVH-B. (f) ABI custom array data of TGF-β signaling molecules in AVH-B and CHB showing increased expression of TGF-β2, SMAD4, PPP2CB, and interleukin-6.
Peripheral expression of Notch1 and its ligands is enhanced in patients with liver cirrhosis and HCC
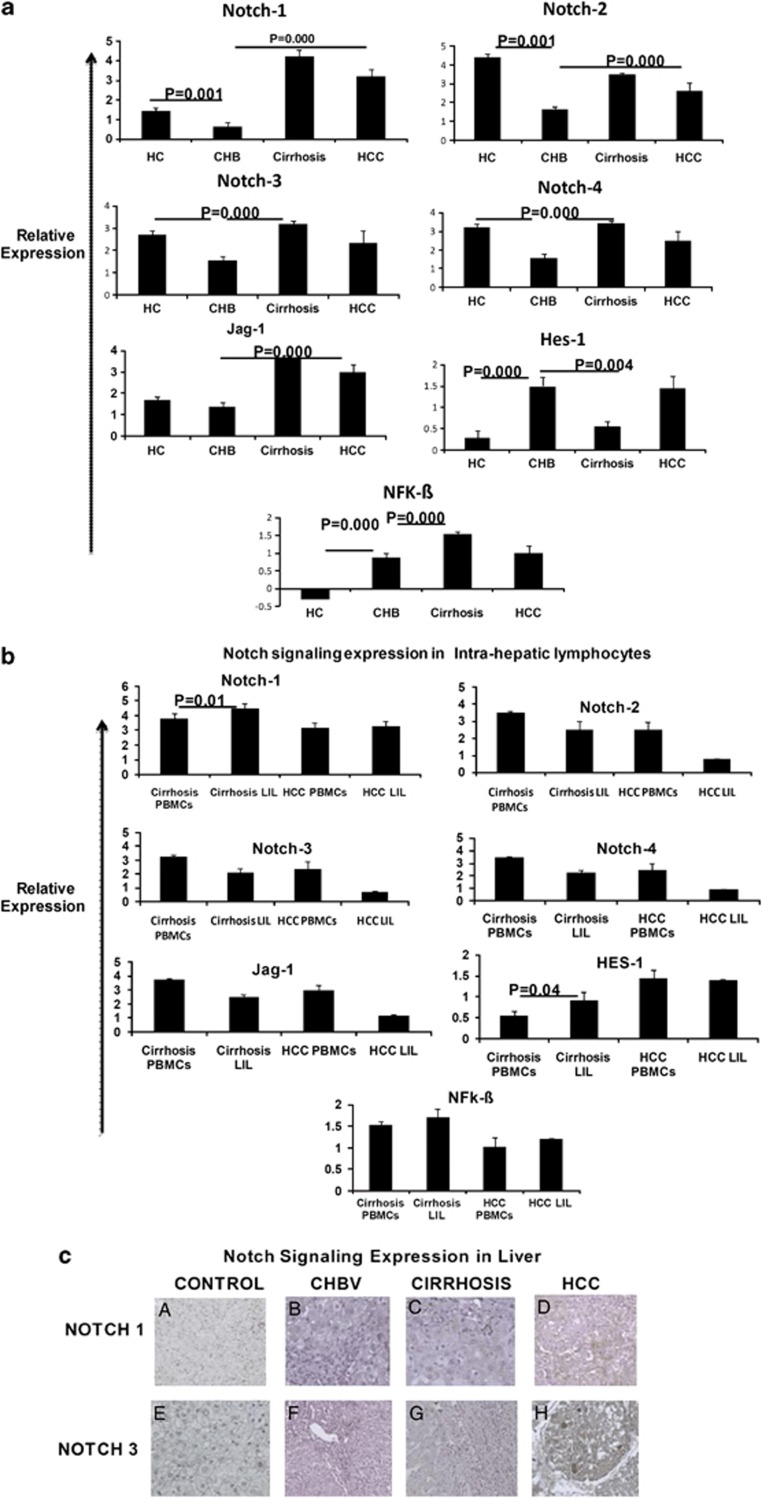
As shown in Figure 1, the mRNA expression of Notch1 in total PBMCs from CHB patients was lower than that in HC patients. We then examined whether the abnormal expression pattern of Notch1 and its ligands change with progression of liver disease. We estimated the levels of expression of Notch1 and its ligands among CHB, cirrhosis, and HCC patients. All Notch receptors and ligands and NF-kB expression were upregulated in the PBMCs of subjects with advanced cirrhosis and HCC (Figure 2a) in comparison with CHB. Expression of Hes1 was lower in cirrhosis in comparison with CHB and HCC. Therefore, there is repression of Notch receptor-mediated regulation of immune response in patients who progress to cirrhosis and HCC.
Figure 2.
Quantitative real-time PCR analysis and immunohistochemical analysis of all Notch receptors. Notch1, Notch2, Notch3, Notch4, JAG1, HES1, and NFkβ in (a) total peripheral blood mononuclear cells (PBMCs) of control (HC), chronic HBV (CHB), cirrhosis, and HCC patients and (b) liver infiltrated lymphocytes of cirrhosis and HCC (c) Immunohistochemistry staining was performed on 3 μm sections of paraffin-embedded biopsy and resected liver tissue of HC, CHB, cirrhosis and HCC specimen. Sections were stained with chromogen DAB (DAKO) and counterstained with hematoxylin. Immunohistochemistry (original magnification × 200) showing Notch1 and Notch3 lack of expression in (a) normal liver (b) chronic hepatitis B (CHB) (c and d), and positive expression of Notch3 in cirrhosis and HCC tumor tissue.
Expression of Notch1 and its ligands is enhanced in the LILs of patients with advanced liver cirrhosis and HCC
Further, we examined whether the expression profiles of Notch1 and its ligands differ between the PBMCs and LILs. Notch1 and HES1 expression was significantly increased in the LIL of cirrhosis (Figure 2b). When we examined the protein expression of Notch receptors in the total liver by immunohistochemistry, there was also a similar high expression of Notch1 and 3 in cirrhosis and HCC patients (Figure 2c). From this, we can conclude that there is repression of Notch receptor-mediated regulation of immune response in CHB patients who progress to cirrhosis and HCC with increased Notch1 expression.
Increased TGF-β signaling pathway expression in liver of cirrhosis
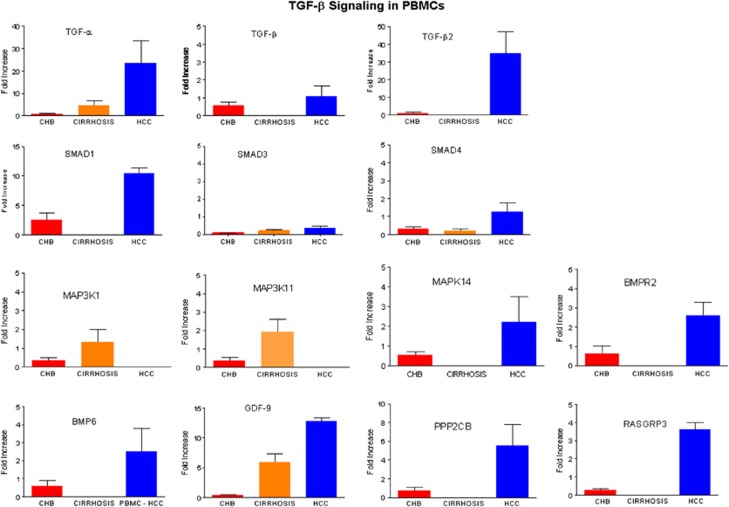
The TGF-β pathway proteins are implicated as profibrogenic in patients with progressive liver disease, as well are involved in FoxP3-expressing T cells, and we performed multiplex quantitative PCR (ABI custom-designed signaling array) for TGF-β pathway genes (Table 2). The expression of several genes in the TGF-β signaling pathway like TGF-α, TGF-β2, SMAD1, MAK14, GDF9, PPP2CB, and RASGRP3 was higher in PBMCS of HCC patients (Figure 3).
Figure 3.
ABI custom array of 48 genes of TGF-β signaling pathway was designed and quantitative real-time PCR analysis was performed with Syber Green.
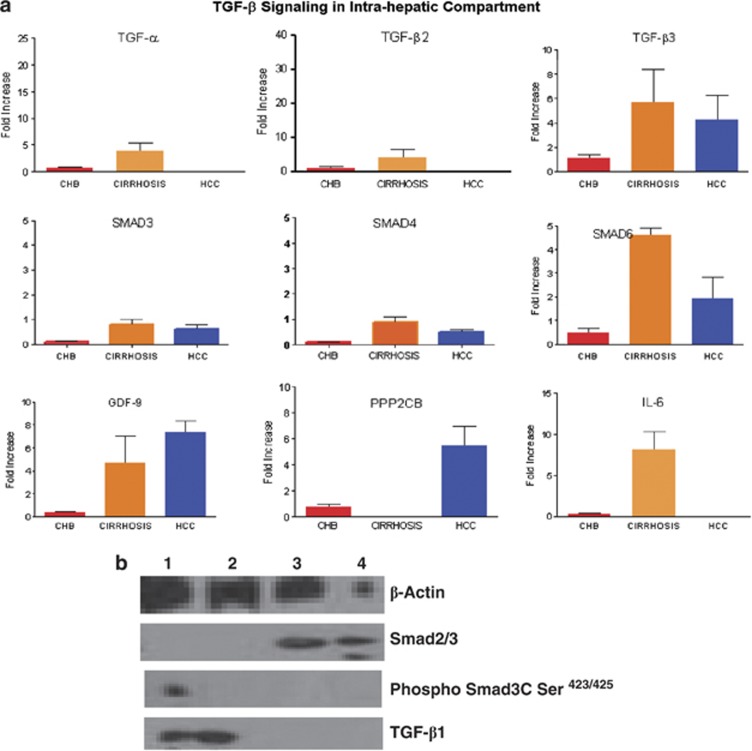
In liver, TGF-α, TGF-β2, TGF-β3, SMAD3, SMAD4, SMAD6, and interleukin-6 were more expressed in cirrhosis patients than those in HCC patients (Figure 4a). GDF9, PPP2CB, and RASGRP3 were upregulated both in the PBMCs and liver of HCC patients. Western analysis showed the TGF-β1 expression in cirrhotic tissues, but faint expression of phospho-Smad3C (Ser423/425) in one of cirrhotic tissue. However, in HCC tissue, we did not observe expression of phospho-Smad3C (Ser423/425) and TGF-β1 (Figure 4b).
Figure 4.
ABI custom array of 48 genes of TGF-β signaling pathway was designed and quantitative real-time PCR analysis was performed with Syber Green. In peripheral blood mononuclear cells (PBMCs) of chronic HBV (CHB), cirrhosis and hepatocellular carcinoma (HCC) patients in (a) liver infiltrated lymphocytes (LiLs) of CHB, cirrhosis, and HCC patients. Signaling module depicting activated gene sets of TGF-α, TGF-β2, GDF9, SMAD1, SMAD4, MAPK14, BMP6, BMPR2, and PPP2CB in PBMCs from HCC patients, which were attenuated during the cirrhosis stage of infection. (a) In LiLs, increased expression of TGF-α, TGF-β2, TGF-β3 GDF9, SMAD3, SMAD4, SMAD6, and interleukin-6 was observed. (b) Western blot showing β-Actin, TGF-β, Smad2/3, and pSmad3C Ser.423/425
The Notch/FoxP3 ratio was increased in cirrhosis patients; increased Notch expression is involved in inducing FoxP3 expression in LILs
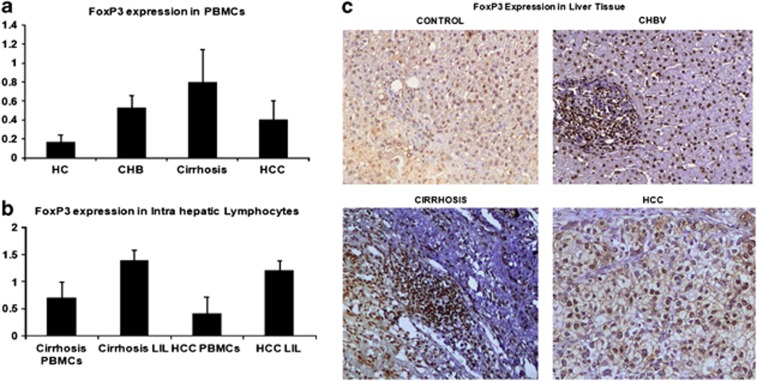
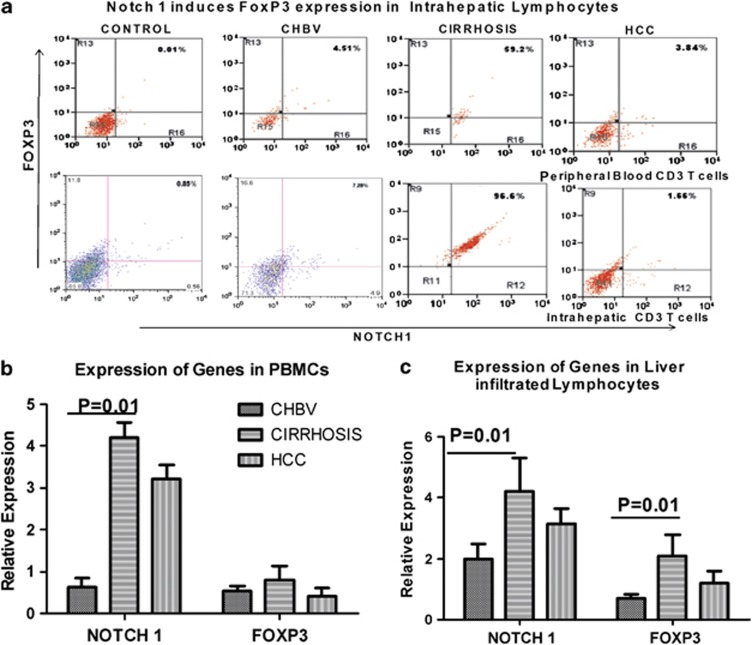
As our earlier findings showed higher expression of FoxP3-expressing Tregs in CHB patients,15 we analyzed Notch1 and FoxP3 dual expression in peripheral lymphocytes in intrahepatic liver lymphocytes and total liver. In peripheral lymphocytes, LIL, and in total liver, FoxP3 expression was more in cirrhosis patients than in CHB patients (Figure 5a). Although, there was a modest increase in FoxP3+ T cells in the PBMCs among those with cirrhosis and HCC, strikingly, most of the LILs were FoxP3 positive (Figure 5b). Immunohistochemistry analysis also showed increased nuclear expression of FoxP3 in cirrhosis and HCC (5C). Further, flow-cytometric analysis showed stronger Notch1 and FoxP3 dual expression in LILs in cirrhosis and HCC patients than in CHB patients (Figure 6a,b).
Figure 5.
(a) Frequency of CD3+CD4+-expressing Foxp3+ T cells in the peripheral blood mononuclear cell (PBMCs) of control (HC), chronic HBV (CHB), cirrhosis, and hepatocellular carcinoma (HCC) and (b) Representative presentation of frequency of CD3+CD4+-expressing Foxp3+ T cells in the PBMCs and liver infiltrated lymphocytes of same cirrhosis and HCC patients. (c) Tissue sections were stained with chromogen DAB (DAKO) and counterstained with hematoxylin in immunohistochemistry of HC, CHB, cirrhosis, and HCC liver tissue, showing protein expression of FoxP3 (original magnification × 200). In normal liver and chronic hepatitis B, low expression of FoxP3, and in cirrhosis and HCC tumor tissue, increased expression of FoxP3 was observed.
Figure 6.
Increased Notch/FoxP3 dual expression in cirrhosis patients. (a) Representative dot plots of Notch and FoxP3 expression in peripheral and intrahepatic CD3+CD4+ T cells of control subjects (HC), chronic hepatitis B (CHB), cirrhosis, and hepatocellular carcinoma (HCC) patients. The values in the quadrants indicate the percentage of dual expression of FoxP3 on cell subsets. (b) Pooled data indicate the percentages of Notch1- and FoxP3-expressed T cells in peripheral and intrahepatic compartments of CHB, cirrhosis, and HCC patients. Dual expression of intrahepatic T cells expressing Notch1 and FoxP3 is significantly increased in cirrhosis patients.
Inhibition of Notch attenuates the FoxP3 expression
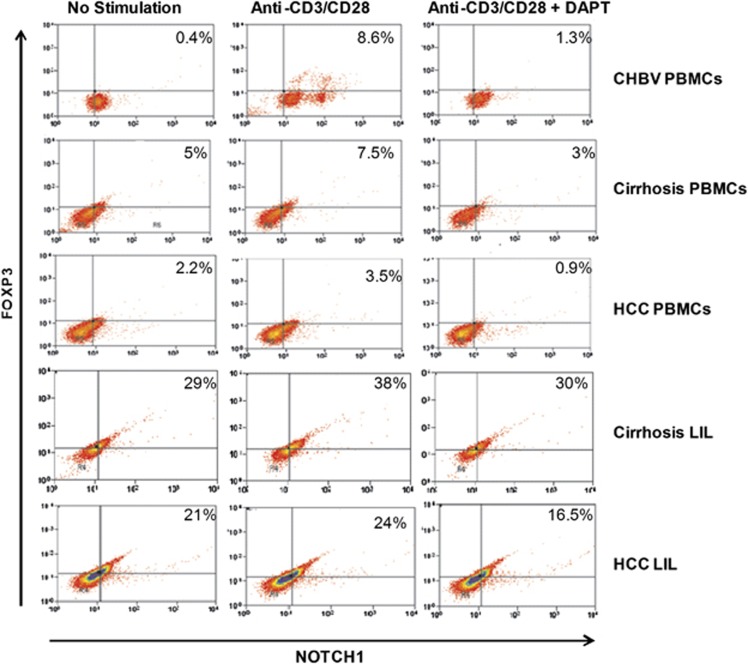
Our data showed Notch and FoxP3 dual expression in the PBMCs and LILs of cirrhosis and HCC patients. We investigated, whether suppression of Notch signaling influences FoxP3 expression. To inhibit the Notch pathway in vitro, we employed 5, 10, and 20 μℳ DAPT treatment to PBMCs and LIL for 48 h with and without stimulation. Significant reduction of Notch was observed at the concentration of 20 μℳ DAPT. Therefore, 20 μℳ DAPT treatment was used in blocking the intracellular Notch expression. We observed, Notch1 inhibition as well as reduced expression of FoxP3 in LIL of cirrhosis and HCC (Figure 7).
Figure 7.
Notch inhibition assay. Representative flow-cytometric dot plot of peripheral blood mononuclear cells (PBMCs) and liver infiltrated lymphocyte (LIL) after 20 μℳ N-[N-(3, 5-difluorophenacetyl)-l-alanyl]-S-phenylglycine t-butyl ester (DAPT) treatment. In PBMCs and LIL, DAPT treatment showed decreased expression of FoxP3 in cirrhosis and HCC.
DISCUSSION
Our data demonstrate that, in AVH-B infection, there is an increased expression of Notch1 in CD8 T cells (Figure 1), which may favor proliferation of CD8+ T cells and its activity, which in turn is vital for development of protective immunity and resolution of acute infection. However, during early chronic infection, Notch signaling is not activated but in subsequent stages of cirrhosis and HCC, there is an enhanced expression of Notch family genes in the liver and associated increased hepatic TGF-β signaling and emergence of CD4+ FoxP3-expressing T cells probably contributing to fibrogenesis (Figure 2, 3, 4).
Several mammalian Notch receptors are oncogenic when constitutively active, including Notch1, though Notch does not obviously cause unregulated cell proliferation or genetic alterations associated with tumor progression.16 It can alter the developmental state of a cell and consequently maintain cells in a proliferative or undifferentiated state.9
We found, that Hes1 expression was significantly higher in the PBMCs and CD8+T cells but was attenuated in CD4+T cells of AVH-B patients (Figure 1). Further, a significantly higher percentage of proliferative CD8+ T cells from AVH-B respond to HBV pooled peptides by secreting IFN-γ than those from CHB patients. Therefore, a complementary association between Notch1 and Hes1 expression in CD8 T cells is likely in AVH-B than in CHB patients. These data suggest that skewed expression of Hes1 in CD4+ T cells may facilitate cell fate towards CD8+ T cells in acute stage of HBV infection (AVH-B) and strengthen the role of Notch signaling to maintain TH1 (CD8+ T cells) than TH2 cell pool in AVH-B. Multiple Notch family members act in a redundant fashion during thymic development of CD4 or CD8 T cell.9, 17 Notch1 gene activation results in decreased CD4 single positive thymocytes and a corresponding increase in CD8 single positive thymocytes.9 Altered or truncated Notch functionality is also documented to prevent differentiation of cells and predispose the undifferentiated cells to malignant transformation.6, 7, 18, 19, 20, 21, 22, 23 Onset of chronicity is thought to involve an imbalance of T-helper (Th) 1/Th2 cells.
Although, there is no sequential progression from chronic hepatitis B to cirrhosis and HCC, CHB infection offers a unique opportunity to study development of carcinogenesis as it often involves nearly all stages from necroinflammation of chronic hepatitis to fibrosis and cirrhosis.
In this study, in CHB, repression of Notch receptors was observed leading to immune dysfunction. Of course, it cannot be ascertained whether this alteration could contribute to ongoing fibrosis, cirrhosis, and HCC, but repression of notch receptors in CHB stage is suggestive of repression in immune regulation, i.e., no differentiation, no proliferation of effector cells, leading to further pathogenesis of disease.
Peripheral and hepatic lymphocytes showed significant increased expression of all Notch receptors (Notch1, Notch2, Notch3, Notch 4 (P=0.001), Jag1, and NF-kβ in cirrhosis patients as compared with CHB patients (Figure 2b). Increased TGF-β signaling molecules and FoxP3 was also observed in cirrhosis and HCC. Therefore, enhanced Notch, TGF-β, and FoxP3 expression was found to be associated with and possibly resulting in fibrogenesis.
Studies show that Tregs with FoxP3 expression have an important role in modulating the required T-cell functions15 and in the presence of TGF-β1, naive T cells can be differentiated into Tregs and maintain peripheral Tregs pool.24, 25, 26, 27, 28 TGF-β1 also mounts tumor-suppressive functions at early stages of liver damage. Whereas during cancer progression TGF-β signaling in hepatocytes shifts from tumor-suppressive pSmad3C to oncogenic pSmad3L,29, 30, 31, 32 in our study, we did not observe pSmad3C in liver tissue of HCC patients (Figure 4b).
Present study showed increased TGF-β expression and enhanced SMAD1 and SMAD4; SMAD6 in intrahepatic lymphocytes in cirrhosis. In HCC patients, TGF- β and these molecules showed increased expression in PBMCs not in intrahepatic lymphocytes. This data may be suggestive of increased fibrosis in cirrhosis liver due to TGF- β, but in HCC disease is at end stage and oncogenic.
In the present study, we were able to link the expression of Notch signaling with dual expression of FoxP3 and enhanced TGF-β signaling on the intrahepatic T cells (Figures 3). Flow-cytometric analysis also showed that Notch1 and FoxP3 dual expression was much higher in liver lymphocytes than peripheral lymphocytes of cirrhosis and HCC patients. Blocking the Notch signaling in LIL and PBMCs with DAPT has significantly lowered the FoxP3 expression, which strongly suggests that Notch signaling influences FoxP3 expression. In the same pool of PBMCS and LIL's, expression of TGF-β signaling molecules was also high. This indicates that these changes may be associated with changes in TGF-β signaling expression, leading to progressive fibrosis/cirrhosis and HCC. Larger sample pool of patients with AVH-B infection would have enabled us to study the dual expression in this group of patients also.
Conclusion
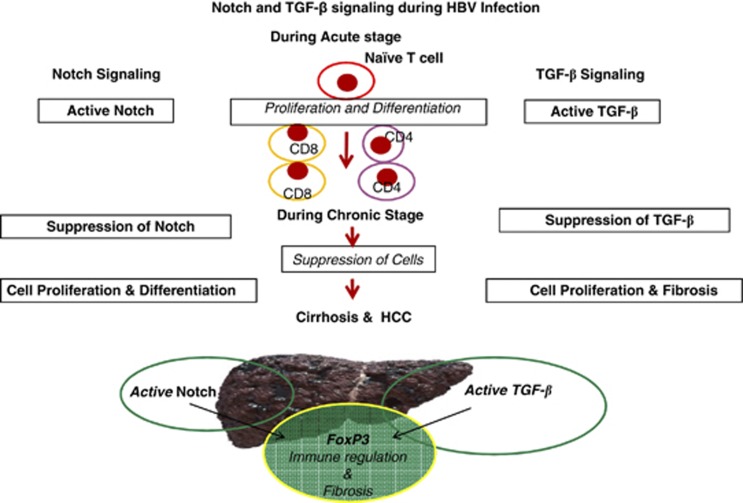
A strong association between overexpression of Notch1 receptor and TGF-β signaling was seen during cell proliferation and differentiation in acute HBV infection. Dual expression of Notch1/Foxp3 and increased TGF-β signaling molecules in LILs of cirrhosis patients emphasize that activated Notch1 and TGF-β signaling may maintain or facilitate regulatory T-lymphocyte infiltration in liver, which may be associated with and contribute to hepatic fibrosis (Figure 8).
Figure 8.
Diagrammatic presentation shows how Notch and TGF-β signaling pathway involved at each pathogenic stage of HBV infection. Signaling gene sets were activated in periphery of acute HBV (AVH-B)-infected patients, which were attenuated during the chronic stage of infection and again activated during cirrhosis and end stage of liver disease.
Study Highlights
Guarantor of the article: Nirupama Trehanpati, PhD.
Specific author contributions: Planning and conducting the study, interpretation and manuscript writing, and editing and corresponding: Nirupama Trehanpati; conducting RT-PCR: Shikha Shrivastav, Sukriti, Binayak Kumar, and Bhavana Shivakumar; Notch inhibitor assay: Ritu Khosla; Western blots: Suvercha Bhardwaj and Jaya Chaturvedi; collection of samples: Sujoy Bose, Dinesh Mani Tripathi, Binayak Kumar, and Subhash Gupta; immunohistochemistry: Puja Sakhuja, Archna Rastogi, and Chagan Bihari; editing the manuscript: Shiv Kumar Sarin and Shyam Kottilil.
Financial support: This study was in part supported by grant no. BT/PR12759/MED/29/135/2009 received from the Department of Biotechnology, Government of India, New Delhi, India.
Potential competing interests: None.
References
- Kane MA. World-wide epidemiology of hepatitis B. Soz Praventivmed. 1998;43 (Suppl 1:S24-26, S98-100. doi: 10.1007/BF02042169. [DOI] [PubMed] [Google Scholar]
- Liang TJ. Hepatitis B: the virus and disease. Hepatology. 2009;49 (5 Suppl:S13–S21. doi: 10.1002/hep.22881. [DOI] [PMC free article] [PubMed] [Google Scholar]
- Asia-Pacific Working Party on Prevention of Hepatocellular Carcinoma Prevention of hepatocellular carcinoma in the Asia-Pacific region: consensus statements. J Gastroenterol Hepatol. 2010;25:657–663. doi: 10.1111/j.1440-1746.2009.06167.x. [DOI] [PubMed] [Google Scholar]
- Kumar R, Saraswat MK, Sharma BC, et al. Characteristics of hepatocellular carcinoma in India: a retrospective analysis of 191 cases. QJM. 2008;101:479–485. doi: 10.1093/qjmed/hcn033. [DOI] [PubMed] [Google Scholar]
- Osborne BA, Minter LM. Notch signalling during peripheral T-cell activation and differentiation. Nat Rev Immunol. 2007;7:64–75. doi: 10.1038/nri1998. [DOI] [PubMed] [Google Scholar]
- Brennan K, Brown AMC. Is there a role for Notch signalling in human breast cancer. Breast Cancer Res. 2003;5:69–75. doi: 10.1186/bcr559. [DOI] [PMC free article] [PubMed] [Google Scholar]
- Maliekal TT, Bajaj J, Giri V, et al. The role of Notch signaling in human cervical cancer: implications for solid tumors. Oncogene. 2008;27:5110–5114. doi: 10.1038/onc.2008.224. [DOI] [PubMed] [Google Scholar]
- Gramantieri L, Giovannini C, Lanzi A, et al. Aberrant Notch3 and Notch4 expression in human hepatocellular carcinoma. Liver Int. 2007;27:997–1007. doi: 10.1111/j.1478-3231.2007.01544.x. [DOI] [PubMed] [Google Scholar]
- Fowlkes BJ, Robey EA. A reassessment of the effect of activated Notch1 on CD4 and CD8 T cell development. J Immunol. 2002;169:1817–1821. doi: 10.4049/jimmunol.169.4.1817. [DOI] [PubMed] [Google Scholar]
- Shen SL, Liang LJ, Peng BG, et al. FoxP3FoxP3+ regulatory T cells and the formation of portal vein tumour thrombus in patients with hepatocellular carcinoma. Can J Surg. 2011;54:28009. doi: 10.1503/cjs.028009. [DOI] [PMC free article] [PubMed] [Google Scholar]
- Rao PE, Petrone AL, Ponath PD. Differentiation and expansion of T cells with regulatory function from human peripheral lymphocytes by stimulation in the presence of TGF-{beta} J Immunol. 2005;174:1446–1455. doi: 10.4049/jimmunol.174.3.1446. [DOI] [PubMed] [Google Scholar]
- Li MO, Sanjabi S, Flavell RA. Transforming growth factor-beta controls development, homeostasis, and tolerance of T cells by regulatory T cell-dependent and -independent mechanisms. Immunity. 2006;25:455–471. doi: 10.1016/j.immuni.2006.07.011. [DOI] [PubMed] [Google Scholar]
- Blokzijl A, Dahlqvist C, Reissmann E, et al. Cross-talk between the Notch and TGF-beta signaling pathways mediated by interaction of the Notch intracellular domain with Smad3. J Cell Biol. 2003;163:723–728. doi: 10.1083/jcb.200305112. [DOI] [PMC free article] [PubMed] [Google Scholar]
- Sun Y, Lowther W, Kato K, et al. Notch4 intracellular domain binding to Smad3 and inhibition of the TGF-beta signaling. Oncogene. 2005;24:5365–5374. doi: 10.1038/sj.onc.1208528. [DOI] [PubMed] [Google Scholar]
- TrehanPati N, Geffers R, Sukriti, et al. Gene expression signatures of peripheral CD4+ T cells clearly discriminate between patients with acute and chronic hepatitis B infection. Hepatology. 2009;49:781–790. doi: 10.1002/hep.22696. [DOI] [PubMed] [Google Scholar]
- Wang F, Zhou H, Xia X, et al. Activated Notch signaling is required for hepatitis B virus X protein to promote proliferation and survival of human hepatic cells. Cancer Lett. 2010;298:64–73. doi: 10.1016/j.canlet.2010.06.003. [DOI] [PubMed] [Google Scholar]
- Ohishi K, Katayama N, Shiku H, et al. Notch signalling in hematopoiesis. Semin Cell Dev Biol. 2003;14:143–150. doi: 10.1016/s1084-9521(02)00183-0. [DOI] [PubMed] [Google Scholar]
- Harper JA, Yuan JS, Tan JB, et al. Notch signaling in development and disease. Clin Genet. 2003;64:461–472. doi: 10.1046/j.1399-0004.2003.00194.x. [DOI] [PubMed] [Google Scholar]
- Nair P, Somasundaram K, Krishna S. Activated Notch1 inhibits p53-induced apoptosis and sustains transformation by human papillomavirus type 16 E6 and E7 oncogenes through a PI3K-PKB/Akt-dependent pathway. J Virol. 2003;77:7106–7112. doi: 10.1128/JVI.77.12.7106-7112.2003. [DOI] [PMC free article] [PubMed] [Google Scholar]
- Weijzen S, Rizzo P, Braid M, et al. Activation of Notch-1 signaling maintains the neoplastic phenotype in human Ras-transformed cells. Nat Med. 2002;8:979–986. doi: 10.1038/nm754. [DOI] [PubMed] [Google Scholar]
- Pear WS, Aster JC, Scott ML, et al. Exclusive development of T cell neoplasms in mice transplanted with bone marrow expressing activated Notch alleles. J Exp Med. 1996;183:2283–2291. doi: 10.1084/jem.183.5.2283. [DOI] [PMC free article] [PubMed] [Google Scholar]
- Sriuranpong V, Borges MW, Ravi RK, et al. Notch signaling induces cell cycle arrest in small cell lung cancer cells. Cancer Res. 2001;61:3200–3205. [PubMed] [Google Scholar]
- Shou J, Ross S, Koeppen H, et al. Dynamics of Notch expression during murine prostate development and tumorigenesis. Cancer Res. 2001;61:7291–7297. [PubMed] [Google Scholar]
- Chen W, Jin W, Hardegen N, et al. Conversion of peripheral CD4+CD25- naive T cells to CD4+CD25+ regulatory T cells by TGF- beta induction of transcription factor FoxP3FoxP3. J Exp Med. 2003;198:1875–1886. doi: 10.1084/jem.20030152. [DOI] [PMC free article] [PubMed] [Google Scholar]
- Fu S, Zhang N, Yopp AC, et al. TGF-beta induces FoxP3FoxP3+T-regulatory cells from CD4+CD25 - precursors. Am. J. Transplant. 2004;4:1614–1627. doi: 10.1111/j.1600-6143.2004.00566.x. [DOI] [PubMed] [Google Scholar]
- Marie JC, Letterio JJ, Gavin M, et al. TGF-beta1 maintains suppressor function and FoxP3FoxP3 expression in CD4+CD25+ regulatory T cells. J Exp Med. 2005;201:1061–1067. doi: 10.1084/jem.20042276. [DOI] [PMC free article] [PubMed] [Google Scholar]
- Samon JB, Champhekar A, Minter LM, et al. Notch1 and TGFbeta1 cooperatively regulate FoxP3FoxP3 expression and the maintenance of peripheral regulatory T cells. Blood. 2008;112:1813–1821. doi: 10.1182/blood-2008-03-144980. [DOI] [PMC free article] [PubMed] [Google Scholar]
- Ogata H, Chinen T, Yoshida T, et al. Loss of SOCS3 in the liver promotes fibrosis by enhancing STAT3-mediated TGF-beta1 production. Oncogene. 2006;25:2520–2530. doi: 10.1038/sj.onc.1209281. [DOI] [PubMed] [Google Scholar]
- Dooley S, Weng H, Mertens PR. Hypotheses on the role of transforming growth factor-beta in the onset and progression of hepatocellular carcinoma. Dig Dis. 2009;27:93–101. doi: 10.1159/000218340. [DOI] [PubMed] [Google Scholar]
- Sekimoto G, Matsuzaki K, Yoshida K, et al. Reversible Smad-dependent signaling between tumor suppression and oncogenesis. Cancer Res. 2007;67:5090–5096. doi: 10.1158/0008-5472.CAN-06-4629. [DOI] [PubMed] [Google Scholar]
- Kim SH, Ahn S, Park CK. Smad3 and its phosphoisoforms are prognostic predictors of hepatocellular carcinoma after curative hepatectomy. Hepatobiliary Pancreat Dis Int. 2012;11:51–59. doi: 10.1016/s1499-3872(11)60125-2. [DOI] [PubMed] [Google Scholar]
- Morris SM, Baek JY, Koszarek A, et al. TGF-β signaling promotes hepatocarcinogenesis induced by p53 loss. Hepatology. 2011;55:121–131. doi: 10.1002/hep.24653. [DOI] [PMC free article] [PubMed] [Google Scholar]


