

Abstract
In the rapidly evolving disease of HIV drug resistance readily emerges, nullifying the effectiveness of therapy. Drug resistance has been extensively studied in HIV-1 protease where resistance occurs when the balance between enzyme inhibition and substrate recognition and turn-over is perturbed to favor catalytic activity. Mutations which confer drug resistance can impact the dynamics and structure of both the bound and unbound forms of the enzyme. Flap+ is a multi-drug-resistant variant of HIV-1 protease with a combination of mutations at the edge of the active site, within the active site, and in the flaps (L10I, G48V, I54V, V82A). The impact of these mutations on the dynamics in the unliganded form in comparison with the wild-type protease was elucidated with Molecular Dynamic simulations and NMR relaxation experiments. The comparative analyses from both methods concur in showing that the enzyme’s dynamics are impacted by the drug resistance mutations in Flap+ protease. These alterations in the enzyme dynamics, particularly within the flaps, likely modulate the balance between substrate turn-over and drug binding, thereby conferring drug resistance.
Introduction
Acquired immunodeficiency syndrome (AIDS) has become a worldwide, public health threat since 1980s. The AIDS patient’s immune system is weakened by infection with the human immunodeficiency virus (HIV-1). Maturation of HIV-1 virus requires the viral protease to cleave the Gag and Gag-Pol polyproteins to release the structural proteins MA, CA, NC and p6, and the enzymes reverse transcriptase (RT), integrase (IN) and protease (PR)1. HIV protease is a crucial target for drug design in AIDS therapy, due to this critical role in the life cycle of HIV-1.
Since HIV-1 protease is an important drug target for HIV-1 therapy, there has been substantial effort in developing protease inhibitors as drugs. Nine protease inhibitors have been approved by the FDA for clinical use in fighting AIDS, leading to a significant decrease in the death rate due to AIDS. However, due to the high replication rate of the virus and lack of proofreading mechanism of its reverse transcriptase, selective pressure of drugs leads to rapid emergence of many drug-resistant protease variants.
HIV-1 protease is a homodimeric aspartyl protease with 99 amino acids on each subunit (Figure 1). The dimer interface is a network of hydrogen bonds of an intertwined beta-sheet between the N- and C-terminal regions of each monomers and the active site. Each monomer also has a glycine rich flap: K45-M-I-G-G-I-G-G-F-I-K55. This flap folds as an anti-parallel β sheet that covers the active site. Since the flaps modulate access to the active site, the flexibility of this region is crucial for enzyme activity and inhibitor binding. Unlike the fully closed conformation in complexes of the protease with inhibitor/substrate, the flaps in crystal structures of the apo protease adopt a “semi-open” conformation2–6, which may be due in part to crystal packing constraints. The entrance of substrates or inhibitors to the active site requires further conformational changes of the flaps.
Figure 1.
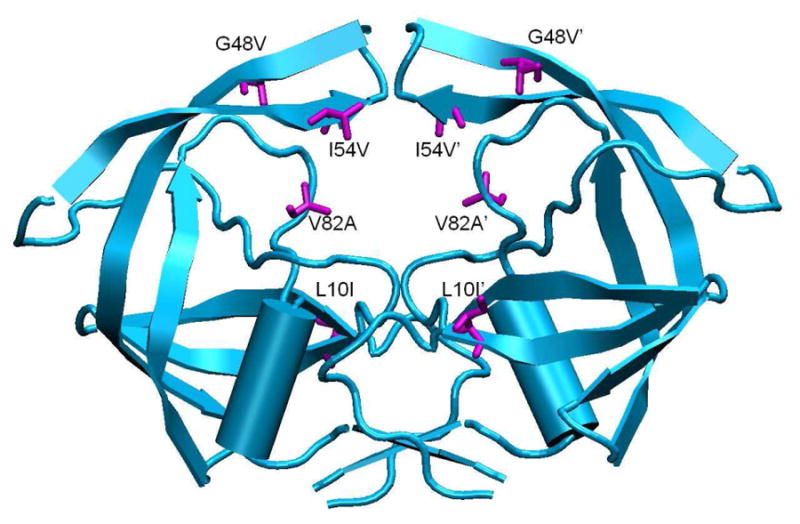
Drug-resistant HIV-1 protease variant Flap+. Mutations are highlighted in magenta.
The flexibility of the flaps in unliganded protease has been studied by a combination of experimental (fluorescence, EPR and NMR)7–15 and computational methods16–22. NMR relaxation experiments on the apo form of wild type (WT) protease have previously indicated that the flap region is mobile on a microsecond time scale with the flap tip (48G-G-I-G-G52) having an even higher degree of mobility on a sub-nanosecond time scale11. MD simulations coupled with experimental techniques have attempted to described how this motion might occur, i.e. whether the flaps curl in or extend out8, 18, 23.
The structural basis for drug-resistance has been extensively studied in HIV-1 protease. Comparison between the structures of WT and drug-resistant proteases in complex with inhibitors partially elucidated how specific protease mutations decrease protease-inhibitor binding affinity on the atomic level24–29. However, static crystal structures do not provide insights into the mechanisms by which mutations can change the dynamic properties of the protease. MD simulations have suggested the role of mutations outside the active site of the protease in altering the internal dynamics of the flaps and the hydrophobic core and thereby modulating drug resistance18, 30.
Flap+ is a multi-drug-resistant HIV-1 protease variant with a combination of flap and active site mutations (L10I, G48V, I54V, and V82A) that occur simultaneously in sequences of patients undergoing drug therapy (Figure 1)31. Thermodynamic analysis of inhibitor binding to Flap+ protease revealed a surprising entropy-enthalpy compensation phenomenon32. Flap+ exhibits extremely large and opposite changes in the entropy and enthalpy of binding compared to WT protease, indicating that the drug resistance mutations in Flap+ directly modulate the relative thermodynamics of inhibitor interactions. In a previous study we examined the energetics of inhibitor binding16, 33 however, the molecular mechanisms that cause these thermodynamic changes, and how protease dynamics might be altered in Flap+ protease had not been addressed.
In this study we investigate and compare the dynamics of apo WT and Flap+ protease through a combination of molecular dynamics (MD) simulations and NMR relaxation experiments. Combining MD with experimental NMR data, spearheaded by many seminal developments of the van Gunsteren laboratory34–37, has been a powerful method in understanding the atomic basis for the experimental motions observed. The results of this comparative analysis show that the flap dynamics are altered due to the drug resistance mutations in the Flap+ variant. Such changes in the flap dynamics may be modulating the access of substrates and inhibitors to the protease active site.
Methods
MD Simulations
MD simulations were performed using the program Sander in the AMBER 8 (Assisted Model Building with Energy Refinement) package38. The initial coordinates of the WT protease were from 1HHP and 2HB42, two apo wild-type HIV-1 protease structures. The initial coordinates of the Flap+ variant were also from 1HHP and 2HB4, with the mutations (L10I, G48V, I54V, and V82A) modeled in using geometry in the AMBER package. The use of two different apo crystal structures for initial coordinates was included to increase sampling, and each construct was simulated for 100 ns in ten independent trajectories with different initial random seeds.
For the standard protease residues, atomic partial charges, van der Waals (vdW) parameters, equilibrium bond lengths, bond angles, dihedral angles, and their relative force constants were taken from the AMBER database (ff03)39. The first conformation of multiple occupancy side-chains was used in the simulations. Any missing side-chain atoms were built back into the structures using the Leap program and default geometry in AMBER. All ionizable residues were left in their standard states at pH 7. The explicit solvent model was applied to all systems. Each structure was solvated with the TIP3P water cubic box to allow for at least 8 Å of solvent on each face of the protease. The vdW dimensions for the protease are 44 × 35 × 59 Å. The dimensions of the final periodic box are 63 × 55 × 78 Å. The simulation system had approximately 7000 water molecules, and six Cl− counterions were added to balance the charge of the system. A three-step energy minimization process with the steepest descent method was used to allow the system to reach an energetically favorable conformation.
In the first energy minimization step, all the heavy atoms of the protease were restrained with a harmonic force constant of 10 kcal mol−1Å−2. In the second step, only the backbone nitrogen, oxygen, and carbon atoms were restrained. In the third step, all atoms were allowed to move. Each of the three steps had 2000 cycles. The temperature of the energy-minimized system was then gradually raised from 50°K to 300°K in the NVT ensemble. Initial velocities were assigned according to the Maxwellian distribution, and random seeds were assigned with ten different values to generate 40 simulations, 10 parallel simulations for each of the WT(1HHP), WT(2HB4), Flap+(1HHP), and Flap+(2HB4). In the thermalization process, heavy atoms were restrained with a harmonic force constant of 10 kcal mol−1 Å−2. The whole process was 50 picoseconds (50,000 steps, each 1 femtosecond [fs]). A 50 picosecond equilibration was then performed in the NPT ensemble without restraining heavy atoms. In the subsequent sampling MD simulations, each step was 2 fs, and the trajectory was recorded every 100 fs. For the thermalization, equilibration, and sampling simulations, the SHAKE algorithm40 was applied to constrain all hydrogen atoms.
The total simulation time was 100 ns for each of the 40 trajectories. All graphics and visualization analysis were processed using the VMD program41. At every 10ps, a snapshot was taken to be analyzed for the production phase. Snapshots were aligned to the crystal structure backbone region 24–26 on both monomers. The root-mean-squared fluctuations (RMSFs) value of each Cα atoms for each 20 trajectories for both WT and Flap+ are calculated using the PTRAJ program38. Due to the symmetry of the dimer, 20 trajectories yielded 40 values over which the RMSF values were averaged for each Cα atom in the WT and Flap+ variants. The calculated RMSF values are plotted as boxplot, where the lower quartile, median and upper quartile of the data set are shown, with the whiskers showing 1.5 interquartile range. Amide backbone order parameters are estimated for each N-H vector using an in-house script based on the following equation:
| (Eq. 1) |
μα(α=1, 2, 3) are the x, y, z components of the normalized N-H vector 42–43. Order parameters calculated from the 40 MD trajectories are displayed as boxplots, similarly to the RMSF results.
15N labeled protease expression, purification and refolding
HIV-1 protease was expressed in Escherichia coli strain BL21-Gold(DE3)pLysS competent cells using a T7 expression system. For this experiment, protease that contains mutations at the primary auto-proteolysis site and at cysteine sites (Q7K, L33I, L63I, C67A and C95A) wasused44, with the amino acid sequence: PQITL WKRPL VTIRI GGQLK EALLD TGADD TVIEE MNLPG KWKPK MIGGI GGFIK VRQYD QIIIE IAGHK AIGTV LVGPT PVNII GRNLL TQIGA TLNF. Protease was over expressed and purified using the protocol published previously23, 29, 45. In brief, the bacteria were grown in LB or TB media at 37°C. When OD600 value of the culture reached 0.4, the bacteria were separated from the LB culture by centrifugation. The pellet was resuspended in 1 L cold (4°C–10°C) wash buffer. The bacteria were separated from the wash buffer by centrifugation and resuspended in 250 mL M9 15N minimal medium45. After growing the M9 bacterial culture at 37°C for 10 to 20 min, protease expression was induced with 2 mM IPTG for 4 hours. After induction, the culture was centrifuged and the bacteria pellet was separated and stored at −80°C. The protease was contained in the inclusion body in the bacterial pellet. After the bacterial cells were lysed, the inclusion bodies were isolated by centrifugation and the pellet was dissolved in 50% acetic acid to extract protease. Protease was purified by separating proteins with different molecular weight by size exclusion chromatography on a 2.1 L Sephadex G-75 superfine column with 50% acetic acid. As described above, Flap+ contains additional mutations of L10I, G48V, I54V, and V82A, and was expressed and purified similar to that of the WT.
NMR sample preparation
For NMR sample preparation, the purified protein was dialyzed against 20 mM formic acid at pH 2.7. The protein was folded in the presence of 10 mM acetate solution at pH 6.0, and the buffer was exchanged to 20 mM sodium phosphate at pH 5.8, as described previously 46. Prior to this step, protein that underwent partial auto-proteolysis was re-purified by reversed-phase HPLC with a Resource RPC 3 mL column (GE Healthcare) equilibrated with 0.05% trifluoroacetic acid (v/v), and eluted with 80% acetonitrile and 0.05% trifluoroacetic acid (v/v). The protein was concentrated to 150 ± 25 μM as a dimer. The NMR samples were in 20 mM sodium phosphate buffer in 95% H2O/5% D2O at pH 5.8, and placed in a Shigemi tube (Shigemi Inc., Allison Park, PA).
NMR data acquisition and model free analysis
NMR experiments to determine 15N transverse relaxation rate (R2), 15N longitudinal relaxation rate (R1), and 15N-1H heteronuclear Nuclear Overhauser Enhancement (hNOE) were performed using Bruker Avance 600 MHz NMR spectrometers equipped with a cryogenic probeat 20°C for the WT and flap mutant13, 47. In the R1 and R2 experiments, spectra were recorded with 7 relaxation delay points: 0, 8, 16, 24, 32, 48, and 64 ms for R2, and 0, 50, 100, 200, 300, 500, and 800 ms for R1. The relaxation rates were determined by fitting the signal intensities to a single-exponential decay function that has two unknown parameters, initial intensity (I0) and relaxation rate (R1 or R2). Uncertainties of the R1 and R2 values were estimated by Monte-Carlo error simulation using residual of the fits as data uncertainties. The hNOE values were determined using the ratio of the two peak heights that were recorded with and without NOE enhancement, and NOE ratio error was estimated from the 2-dimensional peak noise error.
Rotational correlation times of the WT and the flap mutants were determined by assuming a single rotational correlation time, τR, for each protein. First, τR was optimized by a grid search by fitting the parameter sets of a standard model-free model (that contains two unknown parameters, the generalized order parameter, S2, and a correlation time for internal motion, τi) for a group of residues48. For this determination, a group of residues that exhibit R1 and R2 values within 1.5 standard deviation of the mean, and hNOE> 0.69 were selected. Next, once τR was determined, the model-free analysis was performed primarily using the standard model (S2, τi) for all the residues for which a set of R1, R2, and hNOE was available49–51. For the data that did not fit to the standard model (with criterionχ2>6.6413), models with three parameters, extended model free (S2f, Ss2, τi) and exchange model (S2, τi, Rex), were tested52. Here, S2 = Sf 2·Ss2 with order parameters for fast (f) and slow (s) internal motions, and Rex indicates contribution of chemical exchange to R2. Finally, when the dataset for a particular residue either in WT or Flap+ were not fit by the standard model and instead fit using a three-parameter model, the dataset for that residue in the other construct was also analyzed using the same model. This minimized possible model-dependent artifacts in the comparison of WT and Flap+. In the entire model-free analysis, minimum uncertainties of all R1, R2, and hNOE were set at 4% to avoid underestimation of the systematic errors in the relaxation rates.
Results
Protein dynamics, structure, and function are highly correlated. In the case of HIV protease, the dynamics of conformational changes are extremely critical for enzyme function. The first step in the HIV-1 protease substrate-cleavage reaction is opening of the protease flaps to expose the active site cleft to the substrate. This conformational change is highly related to the flexibility of the flaps of the protease. The impact of drug-resistance mutations on the apo form of the Flap+ multi-drug resistant variant on the dynamics and flexibility was compared with the wildtype enzyme by MD simulations and NMR.
Molecular dynamics simulations
The conformational dynamics, and specifically the motions of the flaps, in the unligandedapoHIV-1 protease were investigated using MD simulations. MD simulations provide detailed information on the fluctuations and conformational changes at the atomic level. A total of 20 fully hydrated 100 ns-MD trajectories each for WT and Flap+ proteases were performed. In each simulation, energies converged enabling extensive sampling of the conformational space. This sampling is observable in the endpoint conformations of these simulations (Figure 2); in fact as the unliganded enzyme is a symmetric homodimer each simulation provided data for two monomers. The 40 simulations of the protease dimer (80 monomers) were analyzed to compare the dynamic properties of the WT and Flap+ proteases.
Figure 2.

The 20 snapshots of WT (cyan) and Flap+ (magenta) HIV-1 protease conformation at the end of each 100 ns MD simulations.
To investigate the backbone mobility of the two enzymes, the root-mean-square fluctuation (RMSF) values of Cα atoms for each residue, was calculated. For both WT and Flap+ protease, the regions with the highest RMSF values are the flap area and the terminal loops (residues 37–59) (Figure 3). The most stable areas with the lowest RMSF values in both WT protease and the Flap+ variant are nearby the catalytic Asp 25 (residues 23–28), and the dimer interface (residues 3–9, 90–97). Overall the WT protease has slightly lower RMSF values compared to the Flap+ variant, which indicates that the backbone of wild-type protease is less flexible than the Flap+ variant.
Figure 3.

RMSF values of the Cα atoms for each residue in the 40 100nsec MD simulations displayed as boxplots for WT (blue) and Flap+ (red) HIV-1 protease.
The flaps in apo HIV-1 protease are highly flexible, and adopt a variety of conformations in the MD simulations (Figure 2). The conformational flexibility of WT protease flaps were previously probed by electron paramagnetic resonance (EPR) spectroscopy8, 15. The inter-flap distance was measured using pulsed double electron-electron resonance (DEER) EPR by site-directed spin labeling of residue 55 in each monomer. The results showed that the distance between the two labels (on residues 55–55′) ranges from 26 to 48 Å8, 14–15. In the current MD simulations of WT protease, the distance between the side chain nitrogen atoms of K55 side chains (with locations comparable to spin labels placed in EPR) ranges from 26 to 49 Å, which is consistent with the EPR data. The distance between K55-K55′ side chains has a mean distance of 35.8 Å(σ2.7Å) for WT protease, and a mean of 36.9 Å(σ4.0Å) for the Flap+ variant(Figure 4). The overall distribution, larger mean, range and standard deviation for the Flap+ protease indicate that the conformational ensemble is more opened compared to the WT protease.
Figure 4.

Distribution in percent of distances in Å between the nitrogen atoms in the amino group of the K55 and K55′ side chain calculated over all 80 monomers during the 100 ns trajectories. Distribution data from the wild-type protease simulation are in blue, and from the Flap+ variant are in red.
To better assess the conformational changes in the Flap+ protease with respect to the WT, additional distance distributions involving the flap tips were calculated from the 20 100 ns MD trajectories (Figure 5). The distance between the tip of the flaps (50–50′) is significantly longer and has a broader distribution in Flap+ compared to WT protease. Additionally, the tip of the flap is farther away from the 80s loop (50–80′) in the other monomer in Flap+. These changes further support that the flaps are more open in the conformational ensemble sampled by Flap+ protease.
Figure 5.


Distribution in percent of distances in Å between alpha carbons of the flaps, 80s loop and the active site in WT (blue) and Flap+ (red) HIV-1 protease calculated over all 80 monomers during the 100 ns trajectories. a) 50 – 50′, b) 80 – 50′, c) 25 – 50′, d) 25 – 50, e) 80 – 80′ f) 50–80
In addition, the intra-monomeric distance between the flap tip and residue 80 (50–80) is significantly shorter with a narrower distribution in Flap+ than in WT, indicating the flap tips tend to curl towards the 80s loop while opening up in Flap+. Both the inter- (50–25′) and intra- (50–25) monomeric distance between the flap tip and the active site remains unchanged in the two variants despite substantial alteration of flap conformation, indicating the relatively rigid (Figure 3) active site region may be acting as a pivot in the large amplitude motions of the flaps. In contrast the 80s loops in the two monomers, which form the inner walls of the active site, are closer to each other in Flap+ compared to those in WT protease. This loop has a relatively high flexibility (reflected in RMSF values in Figure 3), and may have a role in substrate/inhibitor access to the active site18. Together these changes in distance distributions describe the dynamic ensemble of Flap+ opening wider than the WT, with the tips of the flaps curling in toward the active site wall (80’s loop), while these walls are coming closer together.
Comparison of Dynamics with NMR
Flap dynamics is critical to protease function, and has previously been investigated by NMR relaxation11–13 and site-directed spin labeling experiments8, 14–15. To understand the dynamic differences between the WT and Flap+ protease, especially in the flap region, the enzyme was also evaluated by high resolution NMR. Although the protease sequence used for the NMR experiments contain total 9 minor mutations compared to that used for the above mentioned MD simulation, the relative change in dynamics between WT and Flap+ dynamics will be compared in two methods. For this purpose, the transverse relaxation rate (R2), the longitudinal relaxation rate (R1), and the 15N-1H heteronuclear Nuclear Overhauser Enhancement (hNOE) were measured. These relaxation parameters reflect internal motion of the 15N-1H bond vectors and provide information on the backbone dynamics at the residue-specific level.
Overlay of R2, R1, and hNOE data for the WT and the mutant protease demonstrates that the relaxation data for most of the residues in the mutant are very similar to those of the WT, indicating that overall dynamics of the protein core is not affected by the mutations (Figure 6). This result is consistent with crystal structures of Flap+ mutant32 being globally similar to the WT protease.
Figure 6.

NMR relaxation data for WT (filled circles) and Flap+ HIV-1 Protease (open triangles). The red dashed square (residues 47 to 54) indicates the flap region.
A close look at the relaxation data shows that residues 47–54, which form the tip of the flap, show significant differences in R2 and hNOE parameters between the WT and the flap mutant (Figure 6). The R2 and hNOE values for residues 48, 51, and 52 of the mutant are lower, indicating that the flap region of Flap+ undergoes more significant sub-nanosecond motion than that of the WT. In addition, the invariant Thr 8030, which is flanked by proline residues (Pro 79 – Thr 80 – Pro 81), has higher mobility in the mutant.
The experimentally measured relaxation parameters were subjected to model-free analysis to determine the internal dynamics of the protein backbone independent of the overall motion of the protein50–51. Model-free analysis takes as input the experimentally measured relaxation parameters (R1, R2, and 15N-1H hNOE) and outputs the generalized order parameter, S2, which represents the spatial restriction of motion of the 15N-1H bond vector50–51. As S2 approaches 1, the bond vector undergoes no significant internal motion. As S2 approaches 0, the bond vector undergoes unconstrained internal motion. The standard model-free analysis assumes two types of motion on sufficiently different time scales that they are independent: local internal motion on the fast time scale (sub-nanosecond) and the slower global motion of the protein. The time scales for these two independent motions are also output as τi for each bond vector, and the global rotational correlation time of the protein, τR.
Data for most of the residues in WT and Flap+ protease were fit using the standard model (Table 2). The rotational correlation time τR was determined to be 12.52 ± 0.26 ns and 12.48 ± 0.32 ns for the WT and the FLAP+ HIV-1 protease variants, respectively. An axially symmetric model was not used to estimate molecular rotational correlation times, because no particular NH vector orientation can be assumed for the amides at the very flexible flap region. Data sets that do not fit adequately to the standard model were analyzed using either (1) the extended model with an additional generalized order parameter for slower internal motions on the nanosecond time scale, S2s53, or (2) the chemical exchange model that includes an additional parameter to account for chemical/conformational exchange mostly on the microsecond-millisecond time scale49. To avoid possible artifacts due to selection of the models, the same model was used for each residue in both the WT and the Flap+ protease, if the dataset was available for both constructs (Table 2).
Table 2.
The number of residues for which the relaxation data was analyzed by the given model in model-free analysis.
| Model | WT and Mut# | WT only## | Mutant only## |
|---|---|---|---|
| Standard model (S2 and τi) | 53 | 3 | 5 |
| Extended model (S2f, Ss2, τi) | 12 | 2 | 0 |
| Exchange model (S2, τi, Rex) | 14 | 0 | 1 |
When an R2, R1, and hNOE dataset of a residue from one of the two proteins required an extended or exchange model, the dataset from the other protein was analyzed using the same model.
“Only” indicates that an R2, R1, and hNOE dataset was obtained only for one of the proteins for a residue.
The order parameters obtained through model free analysis are overall very similar for WT and Flap+ protease (Figure 7), as expected due to the similarity in the measured relaxation data (Figure 6). The major difference in the order parameters is the lower values for residues in the flap (48, 51, 52 and 43) as well as residue 80 in the mutant enzyme, indicating higher mobility of flaps in the Flap+ protease in the sub-nanosecond time scale. Additionally, flap regions in both WT and the mutant exhibit significant internal motions(τi) on the nano-second time scale. While the results unequivocally demonstrate that the flap dynamics are altered in the Flap+ protease compared to the WT, it should be noted that the parameters from model free analysis presented here may not be sufficient to reflect the complex flap dynamics. The relatively high order parameters for the WT flaps may be due to the insufficient separation of Rex, the chemical/conformational exchange contribution to the measured R2. The flaps in WT protease undergo milli-microsecond motions(revealed by CPMG-based NMR relaxation experiments11, 13), which would give rise to conformational exchange on the NMR timescales and hence Rex. However, the Rex term could not be extracted by the model-free analysis. This is because the flap region of the WT protease undergoes severe sub-nanosecond motions as well as the milli-micro second motion, and no appropriate model (such as both extended and with chemical exchange) is available to describe the range of motions the flaps undergo in various time scales.
Figure 7.

Dynamic parameters obtained from model free analysis of NMR relaxation data for WT (filled circles) and Flap+ HIV-1 Protease(open triangles).
Overall, decrease in calculated order parameters, and measured R2 and hNOE values (Figure 8) converge in indicating that the mutations in the Flap+ protease increases the fast (sub-nanosecond) dynamics of the flap region, by possibly decreasing the slower motions on the micro- to millisecond time scales. Such alteration of flap dynamics may be important for modulating the on/off rates for substrate and inhibitor binding.
Figure 8.

Change in dynamic parameters in Flap+ with respect to the WT HIV-1 protease calculated from the data in Figures 6 and 7.
Comparison of MD and NMR results
To compare the characteristics of HIV-1 protease local backbone dynamics inferred from MD simulations and NMR experiments, we calculated the generalized order parameters S2 of the backbone amides from MD trajectories and compared them with those obtained by NMR model free analysis (Figure 9). The calculated S2 values agree well with the NMR results, capturing the regions with restricted and increased internal motions. The flap regions in both WT and Flap+ protease display the lowest S2 values, indicating they are very mobile on the sub-nanosecond time scale. Calculating the order parameters using only the first 20 ns of the 100 ns trajectories resulted in much higher values for the flap regions (results not shown), indicating slower flap motions with nanosecond time scale correlation times. These slower local motions likely complicate the model free analysis of NMR relaxation data for the flaps, as they happen on a time scale that cannot be assumed independent from the global motion of the protease (rotational correlation time ~12 ns). Nevertheless, comparison of MD and NMR results suggest that MD simulations have captured the overall dynamics of local motions probed in NMR experiments, on the real time scale.
Figure 9.

Order parameters of backbone N-H bonds calculated from the 20 independent 100 ns MD simulation are shown in boxplot. Order parameters from NMR experiments are displayed as (A) black circles for WT protease, (B) squares for drug-resistant variant FLAP+.
Indeed, results from MD simulations help explain NMR relaxation data obtained. The increase in the inter-monomer distance in Flap+ compared to WT protease in MD simulations(Figure 5) is consistent with the observed changes in NMR relaxation parameters(Figure 8). As previously reported, the flaps undergo slow conformational exchange in solution where the WT protease populates a minor conformation with the two flaps interacting with each other12. In the Flap+ variant, MD simulations reveal that the inter-subunit distance increases (Figure 5), which will diminish the population of this minor conformation. The loss of this minor conformation will attenuate Rex, the chemical/conformational exchange (in the milli-micro second time scale) contribution to R2 of the Flap+. In addition, the loss of flap-flap interactions is expected to increase sub-nanosecond motions of the flap region, which should be reflected as a decrease in hNOE of Flap+ compared to WT protease. Consistent with this scenario, R2 and hNOE of residues 51 and 52 in the Flap+ are significantly lower than those of the WT in the acquired NMR data (Figure 8), demonstrating that the MD simulation results nicely dissect the NMR experimental data.
Discussion
Mutations that are known to confer drug resistance occur throughout HIV-1 protease in a complex and interdependent manner. These mutations not only involve residues that directly contact the protease inhibitors, but occur elsewhere in the enzyme making their role in conferring resistance more difficult to assess. One possible mechanism by which resistance may occur is through the alteration of the dynamics of the enzyme. The flexibility of the protease flaps are critical to the enzyme’s activity as the flaps control access of the substrates and inhibitors to the protease active site. Thus resistance could potentially occur by modulating access to the active site.
The dynamics of a multi-drug resistant variant, Flap+ of HIV-1 protease was compared with the WT enzyme by a combination of MD simulations and NMR relaxation experiments. The Flap+ variant binds the protease inhibitors with large entropy-enthalpy compensations compared to WT variant32. The molecular mechanisms that cause these thermodynamic changes, and how protease dynamics might contribute to these energetic changes can only begin to be understood by understanding the relative dynamics of the apo forms of Flap+ relative to WT protease. The two methods for understanding dynamics are complementary in that NMR experiments provide an assessment of the overall dynamics and the MD simulations elucidate the details of protease dynamics in atomic details. Analysis of MD and NMR data concur in revealing that the overall dynamic properties of the enzyme are conserved, while the flap dynamics are altered in the Flap+ variant. In Flap+ protease, the flaps sample a more open conformational ensemble compared to the WT enzyme, with the flap tips curling towards the active site walls (80s loops), while these walls are coming closer together. The NMR results indicate that in the Flap+ variant, sub-nanosecond dynamics of the flaps are enhanced with respect to the WT protease, and the trends in the order parameters are reflected in the order parameters calculated in the MD trajectories. These complex alterations in the enzyme dynamics in Flap+ relative to the WT enzyme, particularly within the flaps, may contribute to the thermodynamic differences in the two enzymes and likely modulate the balance between substrate turn-over and drug binding, thereby conferring drug resistance.
Table 1.
The mean and standard deviation for the distance distributions in Å between atom pairs (displayed in Figures 4 and 5) averaged over 80 monomers during 100 ns MD trajectories.
| Atom pairs | Crystal (Å) | WT mean(Å) | WT sigma* | FLAP+ mean(Å) | FLAP+ sigma*00 | ΔMean** |
|---|---|---|---|---|---|---|
| nz55-n | ||||||
| z55′ | 33.1 | 35.8 | 5.9 | 36.9 | 6.8 | −1.1 |
| 50–50′ | 4.3 | 9.7 | 7.0 | 13.1 | 8.3 | −3.4 |
| 50–80′ | 13.5 | 18.0 | 5.2 | 19.2 | 6.0 | −1.1 |
| 50–25′ | 17.7 | 18.9 | 5.3 | 19.5 | 6.4 | −0.6 |
| 50–25 | 17.2 | 16.8 | 3.2 | 16.2 | 3.3 | 0.6 |
| 80–80′ | 21.7 | 26.6 | 3.2 | 24.7 | 3.7 | 2.0 |
| 50–80 | 10.6 | 11.6 | 3.6 | 8.8 | 2.9 | 2.8 |
Sigma refers to standard deviation
Δ Mean = (WT mean) – (Flap+ mean)
Acknowledgments
This work was supported by a grant from the National Institutes of Health, National Institute of General Medical Sciences: P01 GM66524. We dedicate this manuscript to Dr. Wilfred F. Van Gunsteren in acknowledgment of his contributions in computational chemistry and structural biology. In this work we attempt to follow many of his pioneering efforts to combine molecular dynamic simulations with experimental analyses. CAS also acknowledges him as an outstanding postdoctoral mentor from 1992–1994.
References
- 1.Flexner C. HIV drug development: the next 25 years. Nat Rev Drug Discov. 2007;6(12):959–966. doi: 10.1038/nrd2336. [DOI] [PubMed] [Google Scholar]
- 2.Heaslet H, Rosenfeld R, Giffin M, Lin YC, Tam K, Torbett BE, Elder JH, McRee DE, Stout CD. Conformational flexibility in the flap domains of ligand-free HIV protease. Acta Crystallogr D Biol Crystallogr. 2007;63(Pt 8):866–875. doi: 10.1107/S0907444907029125. [DOI] [PubMed] [Google Scholar]
- 3.Wlodawer A, Miller M, Jaskolski M, Sathyanarayana BK, Baldwin E, Weber IT, Selk LM, Clawson L, Schneider J, Kent SB. Conserved folding in retroviral proteases: crystal structure of a synthetic HIV-1 protease. Science. 1989;245(4918):616–621. doi: 10.1126/science.2548279. [DOI] [PubMed] [Google Scholar]
- 4.Spinelli S, Liu QZ, Alzari PM, Hirel PH, Poljak RJ. The three-dimensional structure of the aspartyl protease from the HIV-1 isolate BRU. Biochimie. 1991;73(11):1391–1396. doi: 10.1016/0300-9084(91)90169-2. [DOI] [PubMed] [Google Scholar]
- 5.Wlodawer A, Erickson JW. Structure-based inhibitors of HIV-1 protease. Annual Review of Biochemistry. 1993;62:543–585. doi: 10.1146/annurev.bi.62.070193.002551. [DOI] [PubMed] [Google Scholar]
- 6.Lapatto R, Blundell T, Hemmings A, Overington J, Wilderspin A, Wood S, Merson JR, Whittle PJ, Danley DE, Geoghegan KF, et al. X-ray analysis of HIV-1 proteinase at 2.7 A resolution confirms structural homology among retroviral enzymes. Nature. 1989;342(6247):299–302. doi: 10.1038/342299a0. [DOI] [PubMed] [Google Scholar]
- 7.Louis JM, Ishima R, Nesheiwat I, Pannell LK, Lynch SM, Torchia DA, Gronenborn AM. Revisiting monomeric HIV-1 protease. Characterization and redesign for improved properties. J Biol Chem. 2003;278(8):6085–6092. doi: 10.1074/jbc.M209726200. [DOI] [PubMed] [Google Scholar]
- 8.Galiano L, Ding F, Veloro AM, Blackburn ME, Simmerling C, Fanucci GE. Drug pressure selected mutations in HIV-1 protease alter flap conformations. J Am Chem Soc. 2009;131(2):430–431. doi: 10.1021/ja807531v. [DOI] [PMC free article] [PubMed] [Google Scholar]
- 9.Furfine ES, Dsouza E, Ingold KJ, Leban JJ, Spector T, Porter DJT. 2-Step Binding Mechanism for Hiv Protease Inhibitors. Biochemistry. 1992;31(34):7886–7891. doi: 10.1021/bi00149a020. [DOI] [PubMed] [Google Scholar]
- 10.Rodriguez EJ, Debouck C, Deckman IC, Abusoud H, Raushel FM, Meek TD. Inhibitor Binding to the Phe53trp Mutant of Hiv-1 Protease Promotes Conformational-Changes Detectable by Spectrofluorometry. Biochemistry. 1993;32(14):3557–3563. doi: 10.1021/bi00065a006. [DOI] [PubMed] [Google Scholar]
- 11.Ishima R, Freedberg DI, Wang YX, Louis JM, Torchia DA. Flap opening and dimer-interface flexibility in the free and inhibitor-bound HIV protease, and their implications for function. Structure. 1999;7(9):1047–1055. doi: 10.1016/s0969-2126(99)80172-5. [DOI] [PubMed] [Google Scholar]
- 12.Ishima R, Louis JM. A diverse view of protein dynamics from NMR studies of HIV-1 protease flaps. Proteins. 2008;70(4):1408–1415. doi: 10.1002/prot.21632. [DOI] [PubMed] [Google Scholar]
- 13.Freedberg DI, Ishima R, Jacob J, Wang YX, Kustanovich I, Louis JM, Torchia DA. Rapid structural fluctuations of the free HIV protease flaps in solution: relationship to crystal structures and comparison with predictions of dynamics calculations. Protein Sci. 2002;11(2):221–232. doi: 10.1110/ps.33202. [DOI] [PMC free article] [PubMed] [Google Scholar]
- 14.Galiano L, Bonora M, Fanucci GE. Interflap distances in HIV-1 protease determined by pulsed EPR measurements. J Am Chem Soc. 2007;129(36):11004–11005. doi: 10.1021/ja073684k. [DOI] [PubMed] [Google Scholar]
- 15.Galiano L, Blackburn ME, Veloro AM, Bonora M, Fanucci GE. Solute effects on spin labels at an aqueous-exposed site in the flap region of HIV-1 protease. J Phys Chem B. 2009;113(6):1673–1680. doi: 10.1021/jp8057788. [DOI] [PubMed] [Google Scholar]
- 16.Cai Y, Schiffer CA. Decomposing the energetic impact of drug resistant mutations in HIV-1 protease on binding DRV. J Chem Theory Comput. 2010;6(4):1358–1368. doi: 10.1021/ct9004678. [DOI] [PMC free article] [PubMed] [Google Scholar]
- 17.Hornak V, Okur A, Rizzo RC, Simmerling C. HIV-1 protease flaps spontaneously close to the correct structure in simulations following manual placement of an inhibitor into the open state. J Am Chem Soc. 2006;128(9):2812–2813. doi: 10.1021/ja058211x. [DOI] [PMC free article] [PubMed] [Google Scholar]
- 18.Scott WR, Schiffer CA. Curling of flap tips in HIV-1 protease as a mechanism for substrate entry and tolerance of drug resistance. Structure. 2000;8(12):1259–1265. doi: 10.1016/s0969-2126(00)00537-2. [DOI] [PubMed] [Google Scholar]
- 19.Perryman AL, Lin JH, McCammon JA. HIV-1 protease molecular dynamics of a wild-type and of the V82F/I84V mutant: possible contributions to drug resistance and a potential new target site for drugs. Protein Sci. 2004;13(4):1108–1123. doi: 10.1110/ps.03468904. [DOI] [PMC free article] [PubMed] [Google Scholar]
- 20.Hornak V, Okur A, Rizzo RC, Simmerling C. HIV-1 protease flaps spontaneously open and reclose in molecular dynamics simulations. Proc Natl Acad Sci USA. 2006;103(4):915–920. doi: 10.1073/pnas.0508452103. [DOI] [PMC free article] [PubMed] [Google Scholar]
- 21.Hornak V, Simmerling C. Targeting structural flexibility in HIV-1 protease inhibitor binding. Drug Discovery Today. 2007;12(3–4):132–138. doi: 10.1016/j.drudis.2006.12.011. [DOI] [PMC free article] [PubMed] [Google Scholar]
- 22.Ozen A, Haliloglu T, Schiffer CA. Dynamics of Preferential Substrate Recognition in HIV-1 Protease: Redefining the Substrate Envelope. J Mol Biol. 2011;410(4):726–744. doi: 10.1016/j.jmb.2011.03.053. [DOI] [PMC free article] [PubMed] [Google Scholar]
- 23.Mittal S, Cai Y, Nalam MN, Bolon DN, Schiffer CA. Hydrophobic Core Flexibility Modulates Enzyme Activity in HIV-1 Protease. J Am Chem Soc. 2012;134(9):4163–4168. doi: 10.1021/ja2095766. [DOI] [PMC free article] [PubMed] [Google Scholar]
- 24.Ali A, Bandaranayake RM, Cai Y, King NM, Kolli M, Mittal S, Murzycki JF, Nalam MN, Nalivaika EA, Ozen A, Prabu-Jeyabalan MM, Thayer K, Schiffer CA. Molecular Basis for Drug Resistance in HIV-1 Protease. Viruses. 2010;2(11):2509–2535. doi: 10.3390/v2112509. [DOI] [PMC free article] [PubMed] [Google Scholar]
- 25.Kurt N, Scott WR, Schiffer CA, Haliloglu T. Cooperative fluctuations of unliganded and substrate-bound HIV-1 protease: a structure-based analysis on a variety of conformations from crystallography and molecular dynamics simulations. Proteins. 2003;51(3):409–422. doi: 10.1002/prot.10350. [DOI] [PubMed] [Google Scholar]
- 26.King NM, Prabu-Jeyabalan M, Nalivaika EA, Wigerinck P, de Bethune MP, Schiffer CA. Structural and thermodynamic basis for the binding of TMC114, a next-generation human immunodeficiency virus type 1 protease inhibitor. J Virol. 2004;78(21):12012–12021. doi: 10.1128/JVI.78.21.12012-12021.2004. [DOI] [PMC free article] [PubMed] [Google Scholar]
- 27.Prabu-Jeyabalan M, Nalivaika EA, King NM, Schiffer CA. Viability of a drug-resistant HIV-1 protease variant: structural insights for better anti-viral therapy. J Virol. 2003;77(2):1306–1315. doi: 10.1128/JVI.77.2.1306-1315.2003. [DOI] [PMC free article] [PubMed] [Google Scholar]
- 28.King NM, Prabu-Jeyabalan M, Nalivaika EA, Schiffer CA. Combating susceptibility to drug resistance: Lessons from HIV-1 protease. Chem Biol. 2004;11(10):1333–1338. doi: 10.1016/j.chembiol.2004.08.010. [DOI] [PubMed] [Google Scholar]
- 29.Prabu-Jeyabalan M, Nalivaika E, Schiffer CA. How does a symmetric dimer recognize an asymmetric substrate? A substrate complex of HIV-1 protease. J Mol Biol. 2000;301(5):1207–1220. doi: 10.1006/jmbi.2000.4018. [DOI] [PubMed] [Google Scholar]
- 30.Foulkes JE, Prabu-Jeyabalan M, Cooper D, Henderson GJ, Harris J, Swanstrom R, Schiffer CA. Role of invariant Thr80 in human immunodeficiency virus type 1 protease structure, function, and viral infectivity. J Virol. 2006;80(14):6906–6916. doi: 10.1128/JVI.01900-05. [DOI] [PMC free article] [PubMed] [Google Scholar]
- 31.Shafer RW, Stevenson D, Chan B. Human immunodeficiency virus reverse transcriptase and protease sequence database. Nucleic Acids Res. 1999;27(1):348–352. doi: 10.1093/nar/27.1.348. [DOI] [PMC free article] [PubMed] [Google Scholar]
- 32.King NM, Prabu-Jeyabalan M, Bandaranayake RM, Nalam MN, Ozen A, Haliloglu T, Schiffer C. Extreme Entropy-Enthalpy Compensation in a Drug Resistant Variant of HIV-1 Protease. 2012 doi: 10.1021/cb300191k. in preparation. [DOI] [PMC free article] [PubMed] [Google Scholar]
- 33.Cai Y, Schiffer C. Decomposing the energetic impact of drug-resistant mutations: the example of HIV-1 protease-DRV binding. Methods Mol Biol. 2012;819:551–560. doi: 10.1007/978-1-61779-465-0_32. [DOI] [PMC free article] [PubMed] [Google Scholar]
- 34.Stocker U, van Gunsteren WF. Molecular dynamics simulation of hen egg white lysozyme: A test of the GROMOS96 force field against nuclear magnetic resonance data. Proteins. 2000;40(1):145–153. [PubMed] [Google Scholar]
- 35.Trzesniak D, Glattli A, Jaun B, van Gunsteren WF. Interpreting NMR data for beta-peptides using molecular dynamics simulations. J Am Chem Soc. 2005;127(41):14320–14329. doi: 10.1021/ja044285h. [DOI] [PubMed] [Google Scholar]
- 36.van Gunsteren WF, Dolenc J, Mark AE. Molecular simulation as an aid to experimentalists. Curr Opin Struc Biol. 2008;18(2):149–153. doi: 10.1016/j.sbi.2007.12.007. [DOI] [PubMed] [Google Scholar]
- 37.Daura X, Gademann K, Schafer H, Jaun B, Seebach D, van Gunsteren WF. The beta-peptide hairpin in solution: Conformational study of a beta-hexapeptide in methanol by NMR spectroscopy and MD simulation. J Am Chem Soc. 2001;123(10):2393–2404. doi: 10.1021/ja003689g. [DOI] [PubMed] [Google Scholar]
- 38.Case DA, Cheatham TE, 3rd, Darden T, Gohlke H, Luo R, Merz KM, Jr, Onufriev A, Simmerling C, Wang B, Woods RJ. The Amber biomolecular simulation programs. Journal of Computational Chemistry. 2005;26(16):1668–1688. doi: 10.1002/jcc.20290. [DOI] [PMC free article] [PubMed] [Google Scholar]
- 39.Duan Y, Wu C, Chowdhury S, Lee MC, Xiong G, Zhang W, Yang R, Cieplak P, Luo R, Lee T, Caldwell J, Wang J, Kollman P. A point-charge force field for molecular mechanics simulations of proteins based on condensed-phase quantum mechanical calculations. J Comput Chem. 2003;24(16):1999–2012. doi: 10.1002/jcc.10349. [DOI] [PubMed] [Google Scholar]
- 40.Ryckaert J-P, Ciccotti G, Berendsen HJC. Numerical integration of the Cartesian equations of motion of a system with constraints: molecular dynamics of n-alkanes. J Comput Phys. 1977;23:327–341. [Google Scholar]
- 41.Humphrey W, Dalke A, Schulten K. VMD - Visual Molecular Dynamics. J Molec Graphics. 1996;14(1):33–38. doi: 10.1016/0263-7855(96)00018-5. [DOI] [PubMed] [Google Scholar]
- 42.Smith LJ, Mark AE, Dobson CM, Vangunsteren WF. Comparison of Md Simulations and Nmr Experiments for Hen Lysozyme - Analysis of Local Fluctuations, Cooperative Motions, and Global Changes. Biochemistry. 1995;34(34):10918–10931. doi: 10.1021/bi00034a026. [DOI] [PubMed] [Google Scholar]
- 43.Chandrasekhar I, Clore GM, Szabo A, Gronenborn AM, Brooks BR. A 500-Ps Molecular-Dynamics Simulation Study of Interleukin-1-Beta in Water - Correlation with Nuclear-Magnetic-Resonance Spectroscopy and Crystallography. J Mol Biol. 1992;226(1):239–250. doi: 10.1016/0022-2836(92)90136-8. [DOI] [PubMed] [Google Scholar]
- 44.Louis JM, Clore GM, Gronenborn AM. Autoprocessing of HIV-1 protease is tightly coupled to protein folding. Nat Struct Biol. 1999;6(9):868–875. doi: 10.1038/12327. [DOI] [PubMed] [Google Scholar]
- 45.Marley J, Lu M, Bracken C. A method for efficient isotopic labeling of recombinant proteins. J Biomol NMR. 2001;20(1):71–75. doi: 10.1023/a:1011254402785. [DOI] [PubMed] [Google Scholar]
- 46.Ishima R, Torciha DA, Louis JM. Mutational and structural studies aimed at characterizing the monomer of HIV-1 protease and its precursor. J Biol Chem. 2007;282(23):17190–17199. doi: 10.1074/jbc.M701304200. [DOI] [PubMed] [Google Scholar]
- 47.Ishima R. Recent Developments in (15)N NMR Relaxation Studies that Probe Protein Backbone Dynamics. Top Curr Chem. 2012;326:99–122. doi: 10.1007/128_2011_212. [DOI] [PubMed] [Google Scholar]
- 48.Farrow NA, Zhang O, Forman-Kay JD, Kay LE. Characterization of the backbone dynamics of folded and denatured states of an SH3 domain. Biochemistry. 1997;36(9):2390–2402. doi: 10.1021/bi962548h. [DOI] [PubMed] [Google Scholar]
- 49.Mandel AM, Akke M, Palmer AG. Backbone Dynamics of Escherichia-Coli Ribonuclease Hi - Correlations with Structure and Function in an Active Enzyme. J Mol Biol. 1995;246(1):144–163. doi: 10.1006/jmbi.1994.0073. [DOI] [PubMed] [Google Scholar]
- 50.Lipari G, Szabo A. Model-free approach to the interpretation of nuclear magnetic resonance relaxation in macromolecules. 1. Theory and range of validity. J Am Chem Soc. 1982;104(17):4546–4559. [Google Scholar]
- 51.Lipari G, Szabo A. Model-free approach to the interpretation of nuclear magnetic resonance relaxation in macromolecules. 2. Analysis of experimental results. J Am Chem Soc. 1982;104(17):4559–4570. [Google Scholar]
- 52.Clore GM, Driscoll PC, Wingfield PT, Gronenborn AM. Analysis of the backbone dynamics of interleukin-1 beta using two-dimensional inverse detected heteronuclear 15N-1H NMR spectroscopy. Biochemistry-Us. 1990;29(32):7387–7401. doi: 10.1021/bi00484a006. [DOI] [PubMed] [Google Scholar]
- 53.Barchi JJ, Jr, Grasberger B, Gronenborn AM, Clore GM. Investigation of the backbone dynamics of the IgG-binding domain of streptococcal protein G by heteronuclear two-dimensional 1H-15N nuclear magnetic resonance spectroscopy. Protein Sci. 1994;3(1):15–21. doi: 10.1002/pro.5560030103. [DOI] [PMC free article] [PubMed] [Google Scholar]