Abstract
A method is presented for the measurement of ceramide species in biological fluids using flow injection tandem mass spectrometry. Ceramides are important signaling compounds in a number of cell:cell interactions including apoptosis and neurodegeneration. Because of the large number of potential fatty acid constituent moieties on ceramide molecules, a method which accurately distinguishes different chain-length species was required. The present method does not require HPLC separation and is designed to be applicable to high throughput analysis required for clinical studies. We provide a reference range for all measurable ceramide species in normal human plasma and an example of the utility of the assay in providing biomarkers in an in vitro apoptotic cell death study using murine hematopoietic cells treated with daunorubicin.
Keywords: Ceramides, electrospray tandem spectrometry, cell death studies, biomarkers
1. Introduction
Ceramides are fatty acid amide derivatives of the complex lipid sphingosine and are composed of a wide variety of different chain-length fatty acid species. As important membrane components, they are increasingly being implicated in critical cell signaling pathways including the pathway of programmed cell death (apoptosis) and neurodegeneration [1,2]. Ceramides have been shown to be critical components of lipid membrane microdomains (lipid rafts) and are thought to be derived by the action of acid sphingomyelinase (ASM) on sphingomyelin. Ceramides aggregate and form microdomains that bind various signaling molecules [3]. ASM and ceramide might mediate their biological effects by the activation of several intracellular signaling molecules including cathepsin D, phospholipase A2 or the kinase suppressor of Ras [1]. Ceramide has been shown to be critically involved in many forms of apoptosis including death triggered by receptors, e.g. CD95 or the tumor necrosis factor receptor, during development, or stress. Stress stimuli that employ ceramide to induce apoptosis include irradiation, heat shock or UV-light. The release of ceramide by these stimuli is mediated by the ASM, an enzyme that is rapidly activated by many apoptotic stimuli [4]. Ceramides have also been strongly implicated in playing a role in the development of neurodegenerative processes for which chain length specificity of the involved ceramide may be important [2]. For instance in the inherited neurodegenerative disease CLN9, decreased levels of C24 and C16 ceramide appear to be associated with neuronal apoptosis [5]. In the mouse model of the lysosomal storage disorder metachromatic leukodystrophy there is clear evidence that ceramide accumulation (SGalCer) appears to be associated with the neurodegenerative process [6]. Ceramide measurements have also found a clinical role in the diagnosis of Fabry disease [7] and GM1 gangliosidosis[8]. Research by our group and others on Juvenile Neuronal Ceroid-Lipofuscinosis, also known as Batten disease, indicates that there are also related abnormalities in ceramide metabolism in this probable lysosomal disease and that this process is a component of the neuronal apoptosis and neurodegenerative disease progression [9–10]. Boustany and colleagues have shown that there is a marked increase in total ceramide concentrations in brain samples obtained from patients with Batten disease but were not able to identify specific chain length abnormalities [9]. In order to further study abnormal ceramide metabolism in Batten disease as a catalyst in the neurodegenerative process, we needed to develop a sensitive method for the measurement of ceramides of all chain lengths in biological samples. Recently, tandem mass spectrometric methods have been reported for the analysis of ceramides. One approach requires HPLC separation prior to electrospray ionization tandem mass spectrometry with full scan analysis (ESI/MS/MS) [11–16]. The other approach is based on unique fragmentation patterns, requiring either a precursor ion scan or a neutral loss scan and flow injection [17–19]. The large number of fatty acid species that are potentially available for ceramide synthesis required us to initiate an MS/MS technique to generate species–specific quantitation of all ceramide species. We present our method of ceramide determination by flow injection electrospray MS/MS technique. We also present normal range values for all quantifiable species in human plasma and a practical example of the use of this assay in a hematopoietic cell death experiment.
2. Experimental
2.2. Chemicals and reagents
C6:0, C14:0, C16:0, C17:0, C18:0, C18:1, C20:0, C24:0 ceramides were purchased from Avanti Polar Lipids, Inc. Methanol and chloroform for lipid extraction and MS/MS were HPLC grade from Sigma-Aldrich (St. Louis, MO) and Fisher Scientific (Pittsburgh, PA). Daunorubicin was purchased from Sigma.
2.2. Sample preparation
2.2.1. Tissue culture and blood samples
The IL-3 dependent murine hematopoietic cell line FL5.12 was maintained at 250,000–700,000 cells/ml in RPMI 1640 medium (Mediatech, Herndon, VA) supplemented with 10% fetal calf serum (FCS) (Sigma-Aldrich). Daunorubicin (10 µM) was added to cells and cells were harvested after 6 hours incubation. Deionized water (100 µL) was added to the frozen cell pellet, which was then thawed in a 37°C water bath for 1 minute. The sample was then refrozen in a mixture of dry ice and ethanol bath for 1 minute. The freeze/thaw cycle was repeated two more times and the lysed cell solution (100 µL) was used to extract ceramides and to measure protein levels. These experiments were repeated three times.
Venous blood from normal healthy individuals were collected under an IRB exempt procedure in either lavender top tubes which containing EDTA or green top tubes which containing sodium heparin and centrifuged at 900g for 5 minutes at 4°C. The plasma was stored at −20°C prior to analysis. Total cellular protein was measured in the tissue culture samples using the method of Lowry.
2.2.2. Ceramide extraction
Ceramides were extracted essentially using a modification of the method of Masukawa et al [12]. Ceramides were extracted from either plasma or culture cell lysates by adding 2.0 mL of chloroform/methanol 2:1 (v/v) with 1.0 µmol/L C17:0 ceramide as internal standard and shaken for 20 min at room temperature. Potassium dihydrogen phosphate (400 µl, 0.5M) was then added and the tube was shaken for 20 min. After centrifugation at 900g for 5 minutes, the lower phase containing ceramides were collected with a Pasteur pipette through the protein disk and dried under a steady stream of nitrogen at room temperature. Ceramides were reconstituted with running buffer (5 mM ammonium formate in methanol/chloroform 2:1 v/v).
Plasma was thawed and transferred (100 µL) to 16×100 mm screw cap tubes for ceramide extraction. Ceramides were extracted essentially following the protocol described for tissue culture cell lysates without the freeze-thaw cycle.
2.3. Flow injection/MS/MS
Flow injection MS/MS analysis was performed using a Waters Quattro Ultima electrospray tandem mass spectrometer fitted with a Waters 2795 HPLC (Waters Corporation, Milford, MA). The running buffer used was 5 mM ammonium formate in methanol/chloroform 2:1 (v/v). The Quattro Ultima was operated in positive ionization mode. The ion source parameters were set to minimize the ceramide on source ionization. The capillary voltage was set at 1.03 kV, cone voltage at 0 V, source temperature was 50°C, desolvation temperature was 80°C, and desolvation nitrogen flow was 600 L/hr. Collision energy was 28V, the dwell time 0.07seconds and the flow injection rate was 0.2ml/minute.
2.4. Calibration curves and quantification of ceramide levels
Calibrators were prepared in chloroform/methanol 2:1 (v/v) at concentrations of 0.1–10 µM each of C6:0, C14:0, C16:0, C18:0, and C18:1 ceramides and 0.5–200 µM each of C20:0 and C24:0 ceramides. Internal standard (1.0 µM C17:0 ceramide) was added to each calibrator. The MRM transitions for C6:0, C14:0, C16:0, C18:0, C18:1, C20:0 and C24:0 ceramides respectively were 399>264, 511>264, 539>264, 567>264, 565>264 and 651>264. The ratio of the absolute intensity of signal for each ceramide to the absolute intensity of C17:0 was plotted against the ceramide concentration.
2.5 Calculations
Ceramide profile quantification was based on the precursor ion scan at m/z 264. Due to the lack of availability of commercial standards at all chain lengths an approach based upon the standard curve generated for nearest chain length standard was applied. An exact amount of C17:0 internal standard was added to each sample prior to extraction. The masses of all ceramides were recorded during a full precursor scan acquisition. The results were normalized to volume of plasma and protein content for the cellular studies.
Results
3.1. Fragmentation of ceramide species
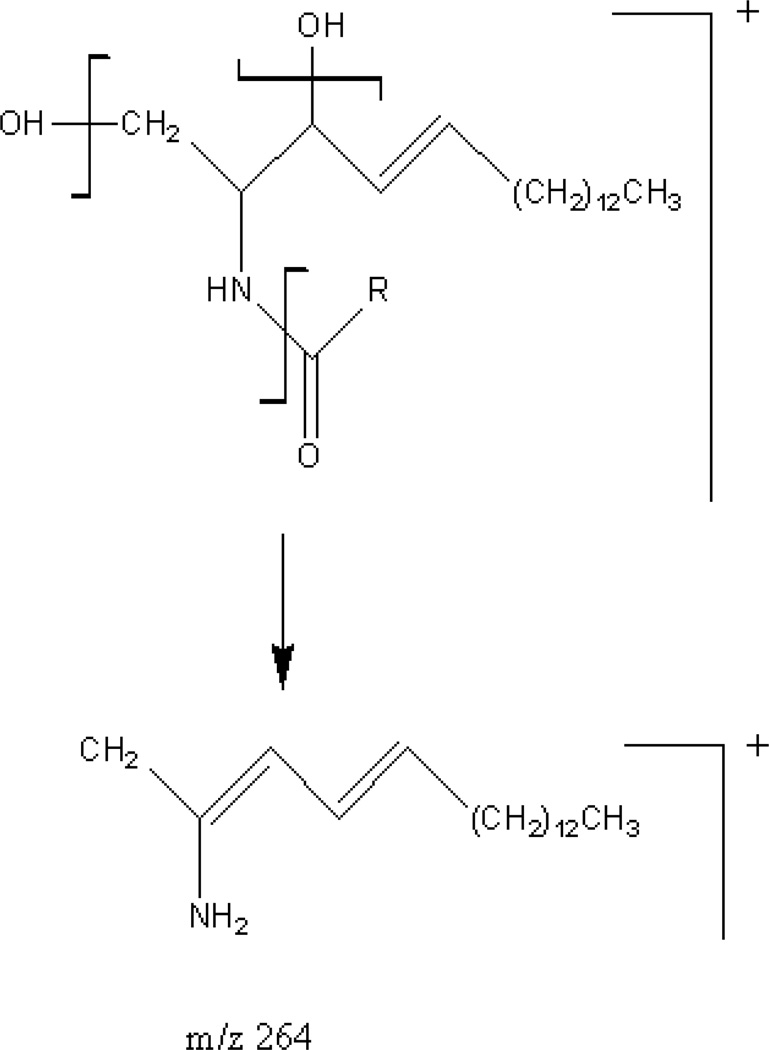
Gu et al. [13] and Liebisch et al. [14] previously described potential ceramide fragments which include the molecular ion, the loss of an N-linked fatty acid, and the loss of one or two molecules of water. (Fig. 1) In our system with soft ionization, we did not experience a significant contribution from the loss of 2 water molecules.
Fig. 1.
Theoretical fragmentation of ceramides. R can be unsaturated (Cn−1H2n−3), saturated (Cn−1H2n−1), or a combination of the two.
2.5. MS1 ion scan of ceramides
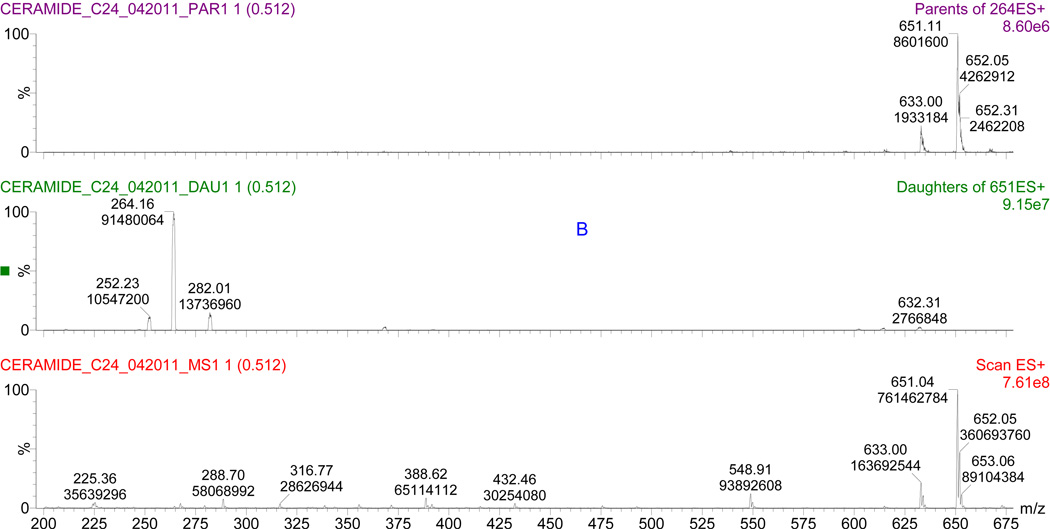
The MS1 scan is the scan without turning on the collision gas. The MS1 scans of all the ceramide standards demonstrated the same pattern with molecular ion, its losing one water fragment: [M + H]+, [M + H − H2O]+ and their stable isotopes. Figure 2A demonstrates an example of C24:0 ceramide MS1 scan. molecular ion (m/z 651) has the most dominant intensity after soft electrospray ionization.
Fig. 2.
Comparison of MS1 ion (A), product ion (B), and precursor ion (C) spectrums of C24:0 ceramide. Parameters used in the scans are shown in Table 1.
2.6. Product ion scan of ceramides
After applying the collision gas argon on the molecular ions of the ceramides, the product ions confirmed the fragmentation patterns that are described above. (Fig. 2B). The m/z 264 product ion appears to be an optimal fragment for ceramide quantification.
2.7. Precursor ion (parent) scan of ceramides
After selecting the m/z 264 ion as precursor for ceramide quantification, the validation of m/z 264 was tested using the precursor ion scan. The results were matched with the MS1 ion scan. (Fig. 2C). When [M + H]+, [M + H − H2O]+ and their stable isotopes are introduced to the collision gas, they will lose 2 hydroxyl and fatty acid groups and form the dominant product of m/z 264.
2.8. Linearity of the calibration curves
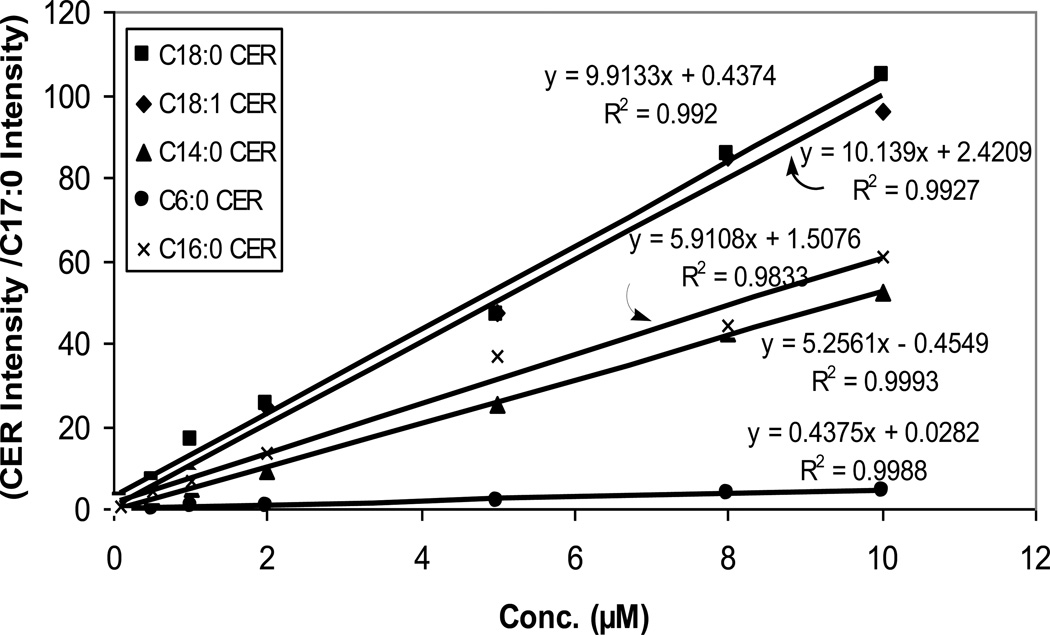
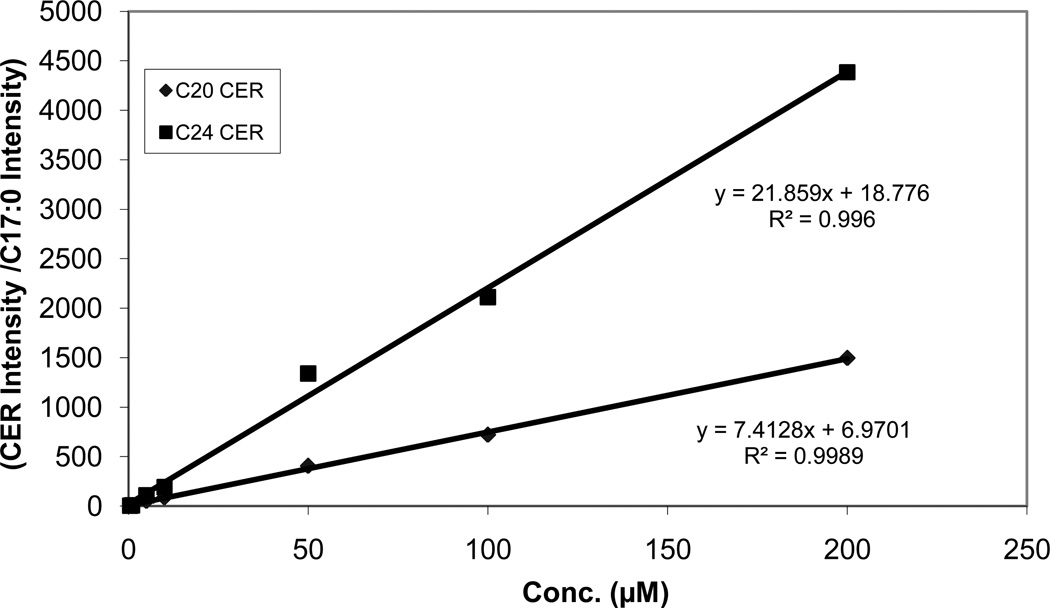
Figures 3 and 4 show calibration curves for the ceramides containing a range of fatty acids from a short carbon chain C6 to a long carbon chain C24. All species displayed good linearity using C17:0 as an internal standard.
Fig. 3.
Calibration curves for ceramides from C6:0 to C18:0.
Fig. 4.
Calibration curves for ceramides from C20:0 and C24:0. The standard curve concentrations were higher for C20:0 and C24:0 due to the fact that these longer carbon chain ceramides have higher physiological plasma levels.
2.9. Precision and Limits of detection
The intraassay CVs for the low and high concentration were less than 15% for the most ceramides. CVs for C14:0, C16:0, and C18:1 in the low concentration range and C24:0 in high concentration were above 15%; interassay CVs for the low and high concentration were all below 15%. (Table 1). The limits of detection for ceramides were determined by measuring serial dilution of the known concentration of ceramide standards in quintuplets injections. The lower limits of detection were defined as the last value that could be accurately quantified with a CV of less than 10%. This we defined as 0.01µmol/L for all species.
Table 1.
The Analytical precision of the method
| Ceramides, µmol/L | ||||||||||||
|---|---|---|---|---|---|---|---|---|---|---|---|---|
| C14:0 | C16:0 | C18:1 | C18:0 | C20:0 | C24:0 | |||||||
| Mean ± SD | CV, % | Mean ± SD | CV, % | Mean ± SD | CV, % | Mean ± SD | CV, % | Mean ± SD | CV, % | Mean ± SD | CV, % | |
| Intraassay precision | ||||||||||||
| Low Conc.(n = 10) | 0.26 ± 0.01 | 2.7 | 0.97 ± 0.02 | 1.5 | 0.31 ± 0.01 | 2.6 | 0.39 ± 0.01 | 2.5 | 0.40 ± 0.01 | 2 | 0.38 ± 0.01 | 2.6 |
| High Conc. (n = 10) | 2.61 ± 0.03 | 1.1 | 9.65 ± 0.10 | 1.1 | 3.37 ± 0.08 | 2.2 | 3.89 ± 0.05 | 1.4 | 4.04 ± 0.05 | 1.3 | 3.89 ± 0.05 | 1.3 |
| Interassay precision | ||||||||||||
| Low Conc.(n = 10) | 0.26 ± 0.01 | 3.6 | 0.99 ± 0.03 | 3.3 | 0.33 ± 0.02 | 5.7 | 0.41 ± 0.02 | 4.1 | 0.42 ± 0.02 | 5.2 | 0.39 ± 0.02 | 5.1 |
| High Conc. (n = 10) | 2.69 ± 0.08 | 3 | 9.88 ± 0.20 | 2.1 | 3.63 ± 0.16 | 4.5 | 4.07 ± 0.15 | 3.6 | 4.31 ± 0.25 | 5.8 | 4.15 ± 0.23 | 5.5 |
2.10. Reference Values
Mean plasma ceramide values for the 19 apparently healthy individuals are shown in Table 2. The most prominent species in plasma are C24:0, C24:1, C22:0, C22:2, C20:0, and 2-OH-C16:0. The individual concentrations of each ceramide species varies, especially for C24:0. There was one individual who had values of C24:0 ceramide that were double the mean value for the remaining individuals. The further investigation of high levels in individuals will be undertaken to determine if this may be a medical, nutritional or pharmacological difference.
Table 2.
Plasma ceramide concentrations (µmol/L of plasma) in normal control individuals (n = 19)
| CER | Mean | SD | MIN | MAX |
|---|---|---|---|---|
| C10:0 | 0.02 | 0.01 | 0.00 | 0.04 |
| C12:0 | 0.03 | 0.02 | 0.00 | 0.09 |
| C14:1 | 0.03 | 0.07 | 0.00 | 0.30 |
| C14:0 | 0.04 | 0.03 | 0.00 | 0.11 |
| C16:1 | 0.49 | 0.27 | 0.00 | 0.92 |
| C16:0 | 0.41 | 0.18 | 0.00 | 0.68 |
| 2-OH-C16:0 | 1.30 | 0.63 | 0.00 | 2.18 |
| C18:2 | 0.02 | 0.02 | 0.00 | 0.08 |
| C18:1 | 0.04 | 0.03 | 0.01 | 0.11 |
| C18:0 | 0.16 | 0.09 | 0.00 | 0.31 |
| 2-OH-C18:1 | 0.07 | 0.07 | 0.00 | 0.30 |
| 2-OH-C18:0 | 0.02 | 0.02 | 0.00 | 0.05 |
| C20:2 | 0.03 | 0.03 | 0.01 | 0.12 |
| C20:1 | 0.11 | 0.10 | 0.00 | 0.32 |
| C20:0 | 0.16 | 0.09 | 0.02 | 0.41 |
| 2-OH-C20:1 | 0.05 | 0.04 | 0.00 | 0.11 |
| 2-OH-C20:0 | 0.12 | 0.19 | 0.01 | 0.89 |
| C22:4 | 0.15 | 0.15 | 0.01 | 0.62 |
| C22:3 | 0.03 | 0.03 | 0.00 | 0.13 |
| C22:2 | 0.28 | 0.19 | 0.05 | 0.80 |
| C22:1 | 0.08 | 0.05 | 0.00 | 0.18 |
| C22:0 | 0.72 | 0.30 | 0.17 | 1.22 |
| 2-OH-C22:1 | 0.71 | 0.39 | 0.09 | 1.63 |
| 2-OH-C22:0 | 0.11 | 0.08 | 0.00 | 0.25 |
| C24:4 | 0.05 | 0.03 | 0.00 | 0.14 |
| C24:3 | 0.04 | 0.04 | 0.00 | 0.16 |
| C24:2 | 0.20 | 0.24 | 0.00 | 1.11 |
| C24:1 | 0.93 | 0.39 | 0.35 | 1.60 |
| C24:0 | 2.77 | 0.89 | 0.68 | 4.44 |
| 2-OH-C24:1 | 0.22 | 0.10 | 0.08 | 0.44 |
| 2-OH-C24:0 | 0.08 | 0.06 | 0.00 | 0.21 |
| C26:4 | 0.07 | 0.05 | 0.00 | 0.20 |
| C26:3 | 0.05 | 0.07 | 0.00 | 0.25 |
| C26:2 | 0.03 | 0.03 | 0.00 | 0.08 |
| C26:1 | 0.06 | 0.04 | 0.00 | 0.13 |
| C26:0 | 0.08 | 0.07 | 0.01 | 0.34 |
| 2-OH-C26:1 | 0.03 | 0.03 | 0.00 | 0.14 |
| 2-OH-C26:0 | 0.04 | 0.03 | 0.00 | 0.11 |
| C28:3 | 0.44 | 0.28 | 0.19 | 1.47 |
2.11. Ceramide levels in hematopoietic cells following daunorubicin treatment
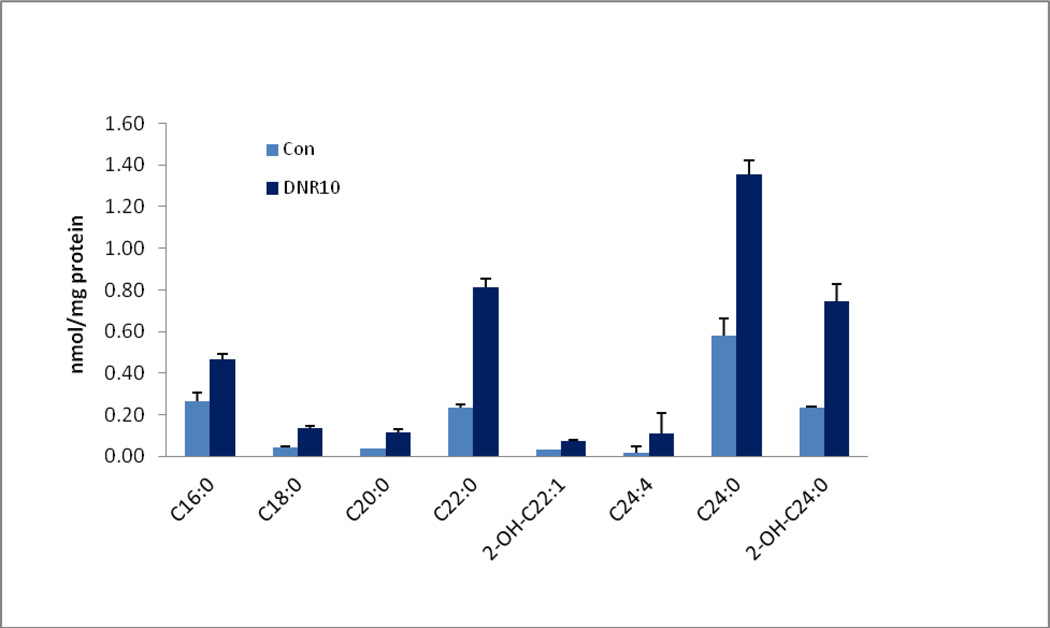
FL5.12 hematopoietic cells exposed to the cytotoxic drug daunorubicin demonstrated increased levels of longer chain ceramide compared to untreated cells. The levels of C16:0, C18:0, C20:0, C22:0, C24:4, and C24:0 ceramides were more than double those of the control cells.(Fig. 5).
Fig. 5.
FL5.12 murine hematopoietic cells were treated with 10 µM daunorubicin for 6 hours. Ceramide levels were measured in three separate experiments.
4. Discussion
The aim of this study was to establish a method to accurately quantify ceramides of all chain lengths including unsaturated and hydroxylated species in biological samples. Our results show that all ceramide species generate a common fragment of m/z 264. This unique fragmentation pattern makes it possible to quantify all of the metabolically potential ceramide species in a single two minute analysis using electrospray flow injection-MS/MS and multiple reaction monitoring (MRM) without the need for an HPLC separation step. The odd chain-length C17:0 ceramide was not detectable in any of the biological samples that we have evaluated. This makes it a useful internal standard as isotope labeled derivatives are not readily available. The use of the MRM mode of mass spectrometry allows scanning specific ion-pairs, one for quantitation and one for confirmation, which increases the analytical sensitivity compared to a full scan analysis. The assay was shown to be linear over the physiological range of expected values and sufficiently precise to measure changes with disease as demonstrated in the cell death experiment.
Following the development of the assay, we have defined a reference range for a large number of ceramide species of different chain lengths in human plasma. This is a pre-requisite for eventual use of the assay as biomarkers in disease states, including our own studies in CLN3. The use of MRM analysis and flow injection means that the assay has a sufficient rapid turnaround to be able to generate latrge quantities of data in a short time. We have also shown that the assay can measure ceramide species in tissue culture experiments where we performed a proof of principle experiment in the cell death experiment with hematopoietic cells and the cytotoxic daunorubicin. Here we demonstrate a distinct and predictable increase in all ceramide species as a result of cell death. Although the measurement of ceramide species has not yet found a routine clinical application, the evidence that these compounds may be valuable biomarkers for oncological and neurodegenerative conditions is sufficiently compelling that the development of this biomarker assay may result in additional evaluation of ceramides of different chain lengths in a wide variety of disease states.
Footnotes
Publisher's Disclaimer: This is a PDF file of an unedited manuscript that has been accepted for publication. As a service to our customers we are providing this early version of the manuscript. The manuscript will undergo copyediting, typesetting, and review of the resulting proof before it is published in its final citable form. Please note that during the production process errors may be discovered which could affect the content, and all legal disclaimers that apply to the journal pertain.
References
- 1.Lahiri S, Futerman AH. Cell Mol. Life Sci. 2007;64:2270. doi: 10.1007/s00018-007-7076-0. [DOI] [PMC free article] [PubMed] [Google Scholar]
- 2.Ben-David O, Futerman AH. Neuromol. Med. 2010;12:341. doi: 10.1007/s12017-010-8114-x. [DOI] [PubMed] [Google Scholar]
- 3.Pinto SN, Silva LC, de Almeida RF, Prieto M. Biophys. J. 2008;95:2867. doi: 10.1529/biophysj.108.129858. [DOI] [PMC free article] [PubMed] [Google Scholar]
- 4.Arboleda G, Morales LC, Benitez B, Arboleda H. Brain Res. Rev. 2009;59:333. doi: 10.1016/j.brainresrev.2008.10.001. [DOI] [PubMed] [Google Scholar]
- 5.Schulz A, Mousallem T, Venkataramani M, Persaud-Sawan DA, Zucker A, Luberto C, Bielawska A, Bielawski J, holthuis JCM, Jazwinski SM, Kozhaya L, Dbaito GS, Boustany R-MN. J. Biol. Chem. 2006;281:2784. doi: 10.1074/jbc.M509483200. [DOI] [PubMed] [Google Scholar]
- 6.Eckhardt M, Hedayati KK, Pitsch J, Lullmann-Rauch R, Beck H, Fewou SN, Guiselmann V. J. Neurosci. 2007;27:9009. doi: 10.1523/JNEUROSCI.2329-07.2007. [DOI] [PMC free article] [PubMed] [Google Scholar]
- 7.Mills K, Johnson A, Winchester B. FEBS Lett. 2002;515:171. doi: 10.1016/s0014-5793(02)02491-2. [DOI] [PubMed] [Google Scholar]
- 8.Whitfield P, Johnson AW, Dunn KA, Delauche AJN, Winchester BG, Franklin RJM. Acta Neuropathol. 2000;100:409. doi: 10.1007/s004010000187. [DOI] [PubMed] [Google Scholar]
- 9.Persaud-Sawan DA, Boustany R-MN. Apoptosis. 2005;10:973. doi: 10.1007/s10495-005-0733-6. [DOI] [PubMed] [Google Scholar]
- 10.Narayan SB, Rakheja D, Pastor JV, Rosenblatt K, Greene SR, Yang J, Wolf BA, Bennett MJ. Mol. Genet. Metab. 2006;88:178. doi: 10.1016/j.ymgme.2006.01.011. [DOI] [PubMed] [Google Scholar]
- 11.Mano N, Oda Y, Yamada K, Asakawa N, Katayama K. Anal. Biochem. 1997;244:291. doi: 10.1006/abio.1996.9891. [DOI] [PubMed] [Google Scholar]
- 12.Han X. Anal. Biochem. 2002;302:199. doi: 10.1006/abio.2001.5536. [DOI] [PubMed] [Google Scholar]
- 13.Camera E, Picardo M, Presutti C, Catarcini P, Fanali S. J. Sep. Sci. 2004;27:971. doi: 10.1002/jssc.200301712. [DOI] [PubMed] [Google Scholar]
- 14.Bielawski J, szule ZM, Hannun Y, Bielawska A. Methods. 2006;39:82. doi: 10.1016/j.ymeth.2006.05.004. [DOI] [PubMed] [Google Scholar]
- 15.Kasumov T, Huang H, Chung Y-M, Zhang R, McCullough AJ, Kirwan JP. Anal. Biochem. 2010;401:154. doi: 10.1016/j.ab.2010.02.023. [DOI] [PMC free article] [PubMed] [Google Scholar]
- 16.Liebisch G, Drobnik W, Reil M, Trumbach B, Arnecke R, Olgemoller B, Roscher A, Schmitz G. J. Lipid. Res. 1999;40:1539. [PubMed] [Google Scholar]
- 17.Colsch B, Afonso C, Popa I, Portoukalian J, Fournier F, Tabet JC, Baumann N. J. Lipid. Res. 2004;45:281. doi: 10.1194/jlr.M300331-JLR200. [DOI] [PubMed] [Google Scholar]
- 18.Masukawa Y, Tsujimura H, Narita H. J. Lipid. Res. 2006;47:1559. doi: 10.1194/jlr.D600007-JLR200. [DOI] [PubMed] [Google Scholar]
- 19.Gu M, Kerwin JL, Watts JD, Aebersold R. Anal Biochem. 2004;244:347. doi: 10.1006/abio.1996.9915. [DOI] [PubMed] [Google Scholar]


