

Abstract
Förster resonance energy transfer (FRET) has become an important tool for analyzing different aspects of interactions among biological macromolecules in their native environments. FRET analysis has also been successfully applied to study the spatiotemporal regulation of various cellular processes using genetically encoded FRET-based biosensors. A variety of procedures have been described for measuring FRET efficiency or the relative abundance of donor-acceptor complexes, based on analysis of the donor fluorescence lifetime or the spectrally resolved fluorescence intensity. The latter methods are preferable if one wants to not only quantify the apparent FRET efficiencies but also calculate donor-acceptor stoichiometry and observe fast dynamic changes in the interactions among donor and acceptor molecules in live cells. This review focuses on a comparison of the available intensity-based approaches used to measure FRET. We discuss their strengths and weaknesses in terms of FRET quantification, and provide several examples of biological applications.
Introduction
The spatiotemporal localization of molecular interactions is of key importance for understanding the signaling processes that coordinate cellular function. Typically, although proteins vary in size by up to tens of nanometers, the resolution of standard fluorescence microscopy is an order of magnitude larger. Recent developments in superresolution microscopy have successfully overcome this optical resolution limit for particular applications; however, direct imaging of protein-protein interactions remains elusive. Förster resonance energy transfer (FRET) is a physical process in which weak electronic coupling occurs between two excitable molecules with 1), overlap of donor emission and acceptor excitation spectra; 2), favorable orientation of their transition dipole moments; and 3), close proximity, leading to the quenching and sensitization of donor and acceptor molecules, respectively (1–3). Over the last few decades, various features of this physical process have been exploited for the development of tools to investigate molecular interactions that occur at distances far below the diffraction-limited resolution.
Many previous reviews have discussed the main principles and biological applications of FRET (4–7); therefore, in this work we provide a detailed overview of approaches for quantifying and interpreting FRET. We briefly discuss the advantages and disadvantages of methods that use either fluorescence lifetimes or spectrally resolved intensity measurements, with a particular focus on the various intensity-based approaches. We compare intensity-based FRET methods in terms of the required assumptions, limiting constraints, and the experimental work flow, including reference, calibration, and sample measurements. Finally, we provide several examples of the successful application of spectral FRET methods to investigate biological questions.
Apparent versus Characteristic FRET Efficiency
Although FRET efficiency is clearly defined as
| (1) |
where is the energy transfer rate constant and sums all depletion rates of the donor excited state, the meaning of FRET efficiency can vary considerably depending on the scale of one’s perspective. Macroscopically, any increase in donor quenching and sensitized emission from a sample can be interpreted as an increase in FRET efficiency. If each donor within the macroscopic ensemble is examined individually, the same change can be interpreted not as a change in E or as a change in the fraction of donors that participate in FRET complexes, while the FRET efficiency E of the individual donor-acceptor FRET complexes remains constant. In the following, we distinguish between these situations by defining the characteristic FRET efficiency according to Eq. 1 (8), and the apparent FRET efficiency as the efficiency measured from the macroscopic point of view. The apparent FRET efficiency can be defined as the average of all characteristic FRET efficiencies present in a sample weighed by the fraction of the relevant fluorophores. In a sample with partial interaction of donor- and acceptor-labeled molecules, two apparent FRET efficiencies can be measured. One is the characteristic efficiency of interaction scaled by the fractional occupancies of the donor, fD, and the other is scaled by the fractional occupancy of the acceptor, fA, given as
| (2) |
respectively, where is the concentration of donor-acceptor FRET complexes and and are the total donor and acceptor concentrations, respectively. We will show that either EfD or EfA can be measured depending on the specific form of the analysis. This distinction is important for biological applications in which interactions among donor and acceptor molecules are of central interest. In such cases the fractional occupancies, rather than the magnitude of E, will provide information about the degree of interaction.
Fluorescence-Lifetime Approaches
When the criteria for FRET are fulfilled, an additional depletion pathway of the excited donor state becomes available. This reduces the donor fluorescence lifetime and allows the energy transfer efficiency to be determined as , where and are the fluorescence lifetimes of the quenched and free donor, respectively. These quantities can be measured directly by time-correlated single-photon counting (TCSPC), in which fluorescence decay histograms are compiled from fluorescence photon arrival times after pulsed excitation. The major advantage of this strategy is that the measurements themselves do not require extensive calibration. Furthermore, these measurements are relatively robust, lacking many of the artifacts that plague other approaches. Because TCSPC probes individual donor fluorescence events in serial, this method has the ability to provide information about the discrete FRET states as well as the donor fractional occupancy by , where and are the amplitudes of the individual decay components. However, it is not possible to obtain fA by fluorescence-lifetime measurements, because the acceptor fluorescence is usually not considered. Another major drawback of this method is the large amount of photons that must be collected to build fluorescence-decay histograms, which is necessary to fit data with the reasonable accuracy. This is particularly problematic when one attempts to build histograms from which separate decay components can be resolved. Accordingly, changes in FRET can only be measured with relatively low spatiotemporal resolution. As a faster alternative to TCSPC, one can quantify the fluorescence lifetime in the frequency domain by measuring the phase shift and amplitude between the modulation of excitation and emission. Although the temporal resolution of this approach is much higher, only a fraction of the emitted photons are used for evaluation. On the other hand, because the signal/noise ratio of all fluorescence measurements is ultimately limited by photobleaching, efficient photon use is of paramount concern for FRET quantification. Additionally, it is difficult to distinguish multiple fluorescence lifetimes in the frequency-domain method using one modulation frequency, although the polar plot approach (9–11) tries to overcome this problem. With rare exceptions (12,13), most applications of fluorescence-lifetime measurements do not separate exponential components, and thus only the mean lifetime, which cannot be used to quantify E or EfD, is measured. On the other hand, fluorescence-lifetime FRET approaches allow the use of dark acceptors (14,15), which cannot be applied by the most intensity-based approaches.
Intensity-Based FRET Approaches
Alternatives to fluorescence-lifetime imaging microscopy (FLIM) include intensity-based approaches that can differentially exploit the complete spectral range. The ability to distinguish between donor and acceptor fluorescence minimizes the waste of photons, and the equipment required for intensity-based approaches is standard in most laboratories. The fluorescence emission from donor and acceptor fluorophores undergoing FRET is the superposition of five quantities: the donor fluorescence from 1), free donor and 2), donor acceptor complexes scaled by (1 − E); and the acceptor fluorescence from 3), free acceptor ; 4), directly excited acceptor in donor acceptor complexes; and 5), acceptor emission resulting from energy transfer from a donor within a donor-acceptor complex:
| (3) |
where the subscripts D and A refer to donor and acceptor, respectively, and the superscript i refers to the i-th excitation wavelength. is the measured fluorescence spectrum, is the excitation intensity, is the device transfer function, are the extinction coefficients, are the fluorescence quantum yields, and are the unit area normalized fluorescence spectra. Due to this complexity, it becomes apparent that the direct determination of FRET efficiency from spectrally resolved intensity-based measurements is not possible without additional information. Accordingly, unlike fluorescence-lifetime measurements, most spectral approaches make certain assumptions (e.g., acceptor photobleaching (APB) requires the fluorophores to be fixed in space, and linear unmixing FRET (lux-FRET) relies on fluorescence quantum yields of both donor and acceptor) and require reference and calibration measurements for a quantitative interpretation of the results.
APB
The most common intensity-based FRET approach, APB, measures the donor emission intensity in the presence and absence of the acceptor. This is achieved by measuring the donor fluorescence intensity before and after selective bleaching of the acceptor (16–18). Generally, this method requires irreversible bleaching, which limits it to a single measurement, and is commonly applied to fixed samples to prevent diffusion artifacts. However, the development of photoreversible organic dyes and fluorescent proteins has raised the possibility of using this approach for dynamic measurements in live cells (19,20).
FRET quantification with this method is similar to that achieved with fluorescence-lifetime methods, but relies on intensity information about the donor before () and after () APB, rather than fluorescence-lifetime decays. Moreover, the computed quantity is sensitive to errors caused by reabsorption, nonuniformity in the illumination/bleaching beams, and aberration in the excitation and emission beam path. Further corrections must be applied to compensate for incomplete acceptor bleaching and bleaching artifacts of the donor during acquisition. Because this technique is based on the donor emission only, the user receives no information about EfA. The advantage of this strategy, however, lies in its simplicity. APB measurements do not require any specialized equipment, except for a spatially defined bleaching capability, and thus can be performed on a wide range of instruments. In most cases the donor emission spectra are well separated from those of the acceptor, and thus no unmixing is required. A change in donor fluorescence intensity alone provides very clear evidence of FRET, and EfD can be calculated through a relatively simple analysis.
Semiquantitative sensitized emission
FRET can also be identified by measuring the acceptor emission resulting from donor excitation. In practice, however, an acceptor emission channel is often polluted by bleed-through of the donor emission. Youvan et al. (21) introduced a filter-based method to extract acceptor fluorescence intensity changes while correcting for donor direct acceptor excitation and donor bleed-through (21):
| (4) |
For this method, three measurements are required. First, at an excitation wavelength that directly excites the donor, the emission is measured in the acceptor and donor channels, and , respectively. Next, fluorescence is measured in the acceptor channel at an excitation wavelength that selectively excites the acceptor. The amount of donor bleed-through into the acceptor channel is determined by a donor-only measurement, which provides the calibration constant . In an acceptor-only measurement, the extent to which the short-wavelength excitation directly excites the acceptor is determined relative to the excitation at the longer wavelength. This results in the constant . It should be noted that although the donor bleed-though into the acceptor channel is considered and corrected for, any acceptor bleed-through into the donor channel is neglected. Methods that use these three measurements are collectively known as three-cube methods, reflecting the need to use three different filter cubes to perform the measurements. Both of the calibration constants, α and β, are fluorophore and system specific, and may vary with the performance of the device. Thus, occasionally it may be necessary to repeat the donor-only and acceptor-only reference measurements.
It is also notable that the nF, as provided by Eq. 4, does not represent a characteristic or even apparent FRET efficiency, and instead provides a value that varies with FRET (22). Specifically, this FRET index varies with the donor and acceptor concentration. Several studies have attempted to address this problem by scaling nF by various, somewhat arbitrary combinations of the donor and acceptor signals. The most popular forms are (23) and (24). Quantitative correlation of such FRET indices with physical processes or with the terms of Eq. 3 is unclear, as even the most extensively corrected approach, , has been shown to be nonlinear with respect to changes in E and fractional occupancies (25). Unfortunately, these strategies have been adopted by device manufacturers and are often found in microscope acquisition and image-processing software. Consequently, these methods continue to be widely used, even in the presence of several better-defined alternatives.
FRET stoichiometry—three-cube quantification
A quantitative solution to determine the apparent FRET efficiency from measurements of acceptor intensity was proposed by Lakowicz (8) in the form of
| (5) |
where and are the extinction coefficients of the donor and acceptor, respectively, at donor excitation. It should be noted that the fractional occupancy of acceptor which we denote as fA here is called fD in (8). This equation cannot be directly applied as written, and can only be used in the hypothetical situation in which the acceptor in a FRET sample can be measured in the absence of the donor.
More recently, Hoppe and colleagues (25) applied corrections for donor bleed-through and excitation cross talk to Eq. 5 to quantify apparent FRET efficiency with sensitized emission measurements using a three-cube microscope setup. The resulting equation,
| (6) |
where , still requires information about the relative excitability of the donor and acceptor at the donor excitation wavelength. By applying Eq. 6 to a reference measurement of a donor-acceptor tandem construct with known characteristic FRET efficiency, as measured from fluorescence-lifetime measurements, one can determine γ. Hoppe et al. (25) further extended this approach by taking into account the donor quenching due to FRET, and were able to calculate the donor-dependent apparent FRET efficiency:
| (7) |
as well as the donor acceptor ratio:
| (8) |
To calculate EfD and Rt, one must determine the constant ξ, which contains information about the donor and acceptor quantum efficiencies and the device detection efficiency, in a manner similar to that used for γ, by applying reference measurements of a known FRET efficiency construct and solving Eq. 7.
Thus, in addition to quantifying α and β from donor-only and acceptor-only reference measurements in a manner similar to that described by Youvan et al. (21), one must perform an additional reference measurement of a donor-acceptor tandem construct with known FRET efficiency to determine γ and ξ. Furthermore, the excitation wavelengths and emission channels are constrained as in the calculation of nF, such that exA does not excite the donor and no acceptor emission occurs in the donor channel.
FRET stoichiometry has been packaged into an easily implemented and clearly documented ImageJ plug-in. However, although only a single additional reference measurement is required to apply the FRET stoichiometry approach, the nonquantitative, nF-like approaches continue to be used more frequently for a variety of biological applications.
Spectral RET
In 2005, Thaler et al. (26) presented a quantitative FRET approach that uses spectral imaging detectors. In that work, the fluorescence signal from a FRET sample was discussed as a superposition of three quantities: 1), the quenched donor emission; 2), the acceptor emission from direct excitation; and 3), the acceptor emission sensitized through FRET:
| (9) |
This equation is similar to Eq. 3. However, and are the unit emission spectra measured from a fixed amount of fluorophore under defined conditions, and thus contain the information . d and a are fractions of the donor and acceptor unit concentration. The transfer factor , measured as the ratio of fluorescence intensities for equal concentrations of donor and acceptor, represents the ratio of the fluorophores’ photophysical properties, . To find a solution for d, a, and E, two spectral datasets of the donor and acceptor reference and the FRET sample acquired at two different excitation wavelengths are required. The rephrased equations in (26) are then
| (10) |
| (11) |
| (12) |
where δ and are the apparent concentrations obtained from linear unmixing, and .
Unfortunately, the spectral RET approach requires reference samples of known concentration (i.e., purified fluorescent proteins). Furthermore, variation in excitation power, wavelength, bandwidth, and pulse width prevents the use of predetermined references. In addition, spectral RET does not explicitly consider free donor and acceptors in the sample; rather, it states that in the presence of free donor and free acceptor, E becomes a certain weighted average E. Also, the explicit relation of spectral RET to EfD and EfA remains unclear.
Lux-FRET
Inspection of Eq. 3 indicates that the measured spectrum from a sample (or pixel of an image) that contains a mixture of unpaired acceptors at concentration , unpaired donors , and donor-acceptor complexes is a linear superposition of terms (the first row in Eq. 3) that have the emission properties of the donor and others that have the emission properties of the acceptor. By rearranging Eq. 3, we obtain
| (13) |
This suggests a spectral separation either by linear unmixing or by fitting with the sum of the scaled donor and acceptor reference spectra, . These two spectra, and , have to be obtained by two reference measurements on samples that contain donor and acceptor only at concentration and , respectively. Normalizing the components of the fit with respect to these references cancels out and , and leaves only the ratios and as parameters that have to be obtained from the literature or measured separately. We call the normalized fitting coefficients the apparent concentrations of donor and acceptor , and arrive at
| (14) |
| (15) |
Furthermore, a consideration of the spectral parameters of the reference measurements yields
| (16) |
where are the ratios of excitation strengths (donor/acceptor) at excitation wavelengths i.
Substituting Eq. 16 into Eqs. 14 and 15, and considering two excitation wavelengths results in four equations for three unknowns , , and . Disregarding , which represents the excitation of donor at the second (long) wavelength, which is usually very small, leaves three unknowns to be calculated, resulting in
| (17) |
| (18) |
Here obtained from tandem construct and and . Similarly, Eqs. 14 and 15 can be solved for and in terms of the respective reference concentrations (27).
Lux-FRET corrects for bleed-through, cross talk, and unpaired fluorophores in two well-separated steps: First, it takes bleed-through into account in a rigorous way by separating the spectral components. Thus, it does not need to restrict data acquisition to well-separated spectral channels, and instead uses photons from the whole spectrum for the fitting process, resulting in better efficiency of photon usage (26). It should be also noted that the equivalent of the three-cube measurement is readily performed using two filter cubes for two excitations, with a beam splitter that separates the emission into two channels. Linear unmixing in this case is reduced to solving two linear equations with two unknowns (see Appendix 1 in Wlodarczyk et al. (27)). In a second step, by solving Eqs. 14 and 15, the method takes the contributions of unpaired donors and acceptors rigorously into account. For cases in which one can assume a time-invariant and uniform donor/acceptor ratio (as in the case of tandem construct sensors), one can employ simplified imaging modes to measure lux-FRET (1). For example, after an initial spectrally resolved dual-excitation calibration, the user can perform repetitive single-excitation wavelength measurements to quantify EfD at high temporal resolution.
Practically, lux-FRET can be performed on all devices that offer spectral resolution, such as spectrofluorometers and spectral detectors in imaging systems (Zeiss 510 META, Zeiss 710/780, and Nikon A1), as well as on filter-based systems.
Applications of Quantitative, Intensity-Based FRET Methods
The aforementioned intensity-based FRET approaches have been extensively used to analyze different aspects of protein-protein interactions in live cells. In addition, spectral FRET analysis has been successfully applied to study the spatiotemporal regulation of various cellular processes using genetically encoded FRET-based biosensors. The main advantage of these approaches in biological applications is that they allow one to not only detect and quantify apparent FRET efficiencies but also to calculate donor-acceptor stoichiometry and even relative interaction affinity. Moreover, the combination of spectral FRET approaches with microscopy provides the unique possibility to monitor macromolecular interactions in live cells with high resolution in real time.
For example, FRET stoichiometry (25) has been used in a couple of studies to analyze the molecular mechanism of phagocytosis in macrophages, particularly the contributions of small GTPases (e.g., Cdc42, Rac1, Rac2, Arf1, and Arf6) to this process. Analysis of the activation dynamics of endogenous small GTPases by FRET revealed that their activity was mostly restricted to phagocytic cups (28). Moreover, FRET analysis indicated distinct patterns of GTPase activation during phagocytosis: activation of Cdc42 occurred at the tip of pseudopodia, whereas Rac1 and Rac2 were preferentially active in phagocytic cups during phagosome closure. FRET stoichiometry also showed that the small GTPases Arf1 and Arf6 possess a different activation profile (i.e., activated ARF6 was concentrated at the tip of pseudopodia, whereas activated Arf1 was distributed throughout the forming phagosome) and coordinate different functions of the phagosome forming in a PI3K-dependent manner (29). In a subsequent study using similar experimental strategies, Beemiller et al. (30) demonstrated that the interdependent activities of PI3K and Cdc42 are critically involved in organizing the actin dynamics in the phagocytic cup. In parallel, FRET stoichiometry was extended to three-dimensional FRET reconstruction microscopy, which allows for high-resolution four-dimensional (x,y,z,t) imaging of molecular interactions (31). This novel approach was then used to elucidate spatiotemporal details of the signaling framework involved in the formation of macropinosomes in macrophages (32).
Another very broad field of applications for intensity-based FRET approaches is the analysis of protein oligomerization and clustering. For example, Meyer and colleagues (33) improved the sensitized acceptor emission FRET approach and investigated the oligomerization state of the neurokinin-1 receptor (NK1R). They demonstrated that functional NK1Rs exist as monomers at the physiological expression level. The same approach was used to analyze the clustering of different heterotrimeric G-proteins in microdomains (34). This study revealed that G-proteins belonging to the Gi and Gq families show activation-specific microdomain localization, which may be responsible for their specific interaction with effectors. Another method of choice for analyzing protein-protein interaction is lux-FRET (27). As discussed above, this approach allows one to calculate and visualize (Fig. 1) the apparent FRET efficiencies for donors, EfD, and acceptors, EfA, over a wide range of donor molar fractions, xD . Lux-FRET was successfully applied to demonstrate specific homo-oligomerization of serotonin 5-HT1A receptor in live cells (35,36). Using lux-FRET, we have also shown that the 5-HT1A receptor can form heterodimers with 5-HT7 receptors (Fig. 1). More importantly, by combining lux-FRET with an appropriate dimerization model, we were able to calculate the relative dissociation constants for hetero- and homodimers, which allowed us for the first time, to our knowledge, to compare the relative concentrations of homo- and heterodimers, as well as the corresponding monomers, under physiological conditions (37). Because lux-FRET analysis also allows one to estimate the fraction of molecules that participate in complexes, this approach was used to verify the role of transmembrane domains TM4/TM5 as an interaction interface in 5-HT1A receptor dimers (38). In addition, lux-FRET was applied to verify homodimerization of the Src Homology 3 domain of the Ca2+ channel β-subunits (39), as well as to demonstrate a specific interaction between the survival motor neuron protein and profilin2a (40).
Figure 1.
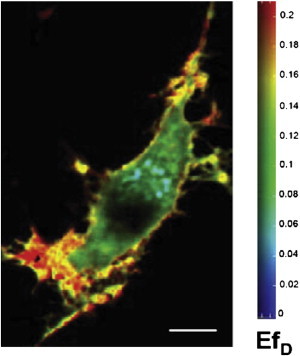
Heterodimerization of 5-HT1A and 5-HT7 receptors investigated by lux-FRET. 5-HT7-CFP (donor) and 5-HT1A-YFP (acceptor) receptors were coexpressed in neuroblastoma N1E-115 cells. Images of apparent FRET efficiency EfD were created according to the two-excitation lux-FRET method after confocal microscopy. Size bar: 5 μm. Reproduced from Renner et al. (37) with permission from the Journal of Cell Science.
The above-mentioned applications clearly demonstrate that FRET approaches that deliver well-defined parameters should be selected depending on the given question and experimental conditions. There is no universal approach that can be applied to all experimental situations, and each described technique has specific advantages and disadvantages compared with the others. If the fluorescence quantum yields of the individual fluorophores are known, the lux-FRET approach may provide the best quantitative results because it is sensitive and requires only minimal calibration efforts. However, if the fluorescence quantum yields are not known, it is advisable to apply either the FRET stoichiometry (if reference samples are available) or spectral RET (if the appropriate equipment is available). On the other hand, if the donor fluorescence decay is monoexponential, fluorescence-lifetime FRET may be a potential alternative to the spectral approaches because it can provide both E and EfD. The selection and design of the particular FRET approach should be tailored according to the specific application.
Acknowledgments
This study was supported by the Deutsche Forschungsgemeinschaft (grants PO732 and SFB621/C12 to E.G.P.) and DFG Research Center Molecular Physiology of the Brain (E.N. and A.W.). A.Z. was supported by the Federal Ministry of Education and Research of the Federal Republic of Germany (0315690D).
References
- 1.Forster T. Energiewanderung und fluoreszenz. Naturwissenschaften. 1946;33:166–175. [Google Scholar]
- 2.Forster T. Zwischenmolekulare energiewanderung und fluoreszenz. Ann. Phys. Berlin. 1948;2:55–75. [Google Scholar]
- 3.Förster T. Energy migration and fluorescence. 1946. J. Biomed. Opt. 2012;17:011002. doi: 10.1117/1.JBO.17.1.011002. [DOI] [PubMed] [Google Scholar]
- 4.Piston D.W., Kremers G.J. Fluorescent protein FRET: the good, the bad and the ugly. Trends Biochem. Sci. 2007;32:407–414. doi: 10.1016/j.tibs.2007.08.003. [DOI] [PubMed] [Google Scholar]
- 5.Sun Y., Wallrabe H., Periasamy A. FRET microscopy in 2010: the legacy of Theodor Förster on the 100th anniversary of his birth. ChemPhysChem. 2011;12:462–474. doi: 10.1002/cphc.201000664. [DOI] [PMC free article] [PubMed] [Google Scholar]
- 6.Ishikawa-Ankerhold H.C., Ankerhold R., Drummen G.P. Advanced fluorescence microscopy techniques—FRAP, FLIP, FLAP, FRET and FLIM. Molecules. 2012;17:4047–4132. doi: 10.3390/molecules17044047. [DOI] [PMC free article] [PubMed] [Google Scholar]
- 7.Padilla-Parra S., Tramier M. FRET microscopy in the living cell: different approaches, strengths and weaknesses. Bioessays. 2012;34:369–376. doi: 10.1002/bies.201100086. [DOI] [PubMed] [Google Scholar]
- 8.Lakowicz J. Kluwer Academic/Plenum Publishers; New York, Boston, Dordrecht, London, Moscow: 1999. Principles of Fluorescence Spectroscopy. [Google Scholar]
- 9.Clayton A.H., Hanley Q.S., Verveer P.J. Graphical representation and multicomponent analysis of single-frequency fluorescence lifetime imaging microscopy data. J. Microsc. 2004;213:1–5. doi: 10.1111/j.1365-2818.2004.01265.x. [DOI] [PubMed] [Google Scholar]
- 10.Redford G.I., Clegg R.M. Polar plot representation for frequency-domain analysis of fluorescence lifetimes. J. Fluoresc. 2005;15:805–815. doi: 10.1007/s10895-005-2990-8. [DOI] [PubMed] [Google Scholar]
- 11.Digman M.A., Caiolfa V.R., Gratton E. The phasor approach to fluorescence lifetime imaging analysis. Biophys. J. 2008;94:L14–L16. doi: 10.1529/biophysj.107.120154. [DOI] [PMC free article] [PubMed] [Google Scholar]
- 12.Padilla-Parra S., Audugé N., Tramier M. Quantitative comparison of different fluorescent protein couples for fast FRET-FLIM acquisition. Biophys. J. 2009;97:2368–2376. doi: 10.1016/j.bpj.2009.07.044. [DOI] [PMC free article] [PubMed] [Google Scholar]
- 13.Padilla-Parra S., Audugé N., Tramier M. Quantitative FRET analysis by fast acquisition time domain FLIM at high spatial resolution in living cells. Biophys. J. 2008;95:2976–2988. doi: 10.1529/biophysj.108.131276. [DOI] [PMC free article] [PubMed] [Google Scholar]
- 14.Ganesan S., Ameer-Beg S.M., Wouters F.S. A dark yellow fluorescent protein (YFP)-based resonance energy-accepting chromoprotein (REACh) for Förster resonance energy transfer with GFP. Proc. Natl. Acad. Sci. USA. 2006;103:4089–4094. doi: 10.1073/pnas.0509922103. [DOI] [PMC free article] [PubMed] [Google Scholar]
- 15.Murakoshi H., Lee S.J., Yasuda R. Highly sensitive and quantitative FRET-FLIM imaging in single dendritic spines using improved non-radiative YFP. Brain Cell Biol. 2008;36:31–42. doi: 10.1007/s11068-008-9024-9. [DOI] [PMC free article] [PubMed] [Google Scholar]
- 16.Van Munster E.B., Kremers G.J., Gadella T.W., Jr. Fluorescence resonance energy transfer (FRET) measurement by gradual acceptor photobleaching. J. Microsc. 2005;218:253–262. doi: 10.1111/j.1365-2818.2005.01483.x. [DOI] [PubMed] [Google Scholar]
- 17.Gu Y., Di W.L., Zicha D. Quantitative fluorescence resonance energy transfer (FRET) measurement with acceptor photobleaching and spectral unmixing. J. Microsc. 2004;215:162–173. doi: 10.1111/j.0022-2720.2004.01365.x. [DOI] [PubMed] [Google Scholar]
- 18.Wouters F.S., Bastiaens P.I., Jovin T.M. FRET microscopy demonstrates molecular association of non-specific lipid transfer protein (nsL-TP) with fatty acid oxidation enzymes in peroxisomes. EMBO J. 1998;17:7179–7189. doi: 10.1093/emboj/17.24.7179. [DOI] [PMC free article] [PubMed] [Google Scholar]
- 19.Giordano L., Jovin T.M., Jares-Erijman E.A. Diheteroarylethenes as thermally stable photoswitchable acceptors in photochromic fluorescence resonance energy transfer (pcFRET) J. Am. Chem. Soc. 2002;124:7481–7489. doi: 10.1021/ja016969k. [DOI] [PubMed] [Google Scholar]
- 20.Subach F.V., Zhang L., Verkhusha V.V. Red fluorescent protein with reversibly photoswitchable absorbance for photochromic FRET. Chem. Biol. 2010;17:745–755. doi: 10.1016/j.chembiol.2010.05.022. [DOI] [PMC free article] [PubMed] [Google Scholar]
- 21.Youvan D.C., Silva C.M., Yang M.M. Calibration of fluorescence resonance energy transfer in microscopy using genetically engineered GFP derivatives on nickel chelating beads. Biotechnology. 1997;3:1–18. [Google Scholar]
- 22.Berney C., Danuser G. FRET or no FRET: a quantitative comparison. Biophys. J. 2003;84:3992–4010. doi: 10.1016/S0006-3495(03)75126-1. [DOI] [PMC free article] [PubMed] [Google Scholar]
- 23.Gordon G.W., Berry G., Herman B. Quantitative fluorescence resonance energy transfer measurements using fluorescence microscopy. Biophys. J. 1998;74:2702–2713. doi: 10.1016/S0006-3495(98)77976-7. [DOI] [PMC free article] [PubMed] [Google Scholar]
- 24.Xia Z., Liu Y. Reliable and global measurement of fluorescence resonance energy transfer using fluorescence microscopes. Biophys. J. 2001;81:2395–2402. doi: 10.1016/S0006-3495(01)75886-9. [DOI] [PMC free article] [PubMed] [Google Scholar]
- 25.Hoppe A., Christensen K., Swanson J.A. Fluorescence resonance energy transfer-based stoichiometry in living cells. Biophys. J. 2002;83:3652–3664. doi: 10.1016/S0006-3495(02)75365-4. [DOI] [PMC free article] [PubMed] [Google Scholar]
- 26.Thaler C., Koushik S.V., Vogel S.S. Quantitative multiphoton spectral imaging and its use for measuring resonance energy transfer. Biophys. J. 2005;89:2736–2749. doi: 10.1529/biophysj.105.061853. [DOI] [PMC free article] [PubMed] [Google Scholar]
- 27.Wlodarczyk J., Woehler A., Neher E. Analysis of FRET signals in the presence of free donors and acceptors. Biophys. J. 2008;94:986–1000. doi: 10.1529/biophysj.107.111773. [DOI] [PMC free article] [PubMed] [Google Scholar]
- 28.Hoppe A.D., Swanson J.A. Cdc42, Rac1, and Rac2 display distinct patterns of activation during phagocytosis. Mol. Biol. Cell. 2004;15:3509–3519. doi: 10.1091/mbc.E03-11-0847. [DOI] [PMC free article] [PubMed] [Google Scholar]
- 29.Beemiller P., Hoppe A.D., Swanson J.A. A phosphatidylinositol-3-kinase-dependent signal transition regulates ARF1 and ARF6 during Fcγ receptor-mediated phagocytosis. PLoS Biol. 2006;4:e162. doi: 10.1371/journal.pbio.0040162. [DOI] [PMC free article] [PubMed] [Google Scholar]
- 30.Beemiller P., Zhang Y., Swanson J.A. A Cdc42 activation cycle coordinated by PI 3-kinase during Fc receptor-mediated phagocytosis. Mol. Biol. Cell. 2010;21:470–480. doi: 10.1091/mbc.E08-05-0494. [DOI] [PMC free article] [PubMed] [Google Scholar]
- 31.Hoppe A.D., Shorte S.L., Heintzmann R. Three-dimensional FRET reconstruction microscopy for analysis of dynamic molecular interactions in live cells. Biophys. J. 2008;95:400–418. doi: 10.1529/biophysj.107.125385. [DOI] [PMC free article] [PubMed] [Google Scholar]
- 32.Yoshida S., Hoppe A.D., Swanson J.A. Sequential signaling in plasma-membrane domains during macropinosome formation in macrophages. J. Cell Sci. 2009;122:3250–3261. doi: 10.1242/jcs.053207. [DOI] [PMC free article] [PubMed] [Google Scholar]
- 33.Meyer B.H., Segura J.M., Vogel H. FRET imaging reveals that functional neurokinin-1 receptors are monomeric and reside in membrane microdomains of live cells. Proc. Natl. Acad. Sci. USA. 2006;103:2138–2143. doi: 10.1073/pnas.0507686103. [DOI] [PMC free article] [PubMed] [Google Scholar]
- 34.Abankwa D., Vogel H. A FRET map of membrane anchors suggests distinct microdomains of heterotrimeric G proteins. J. Cell Sci. 2007;120:2953–2962. doi: 10.1242/jcs.001404. [DOI] [PubMed] [Google Scholar]
- 35.Kobe F., Renner U., Ponimaskin E. Stimulation- and palmitoylation-dependent changes in oligomeric conformation of serotonin 5-HT1A receptors. Biochim. Biophys. Acta. 2008;1783:1503–1516. doi: 10.1016/j.bbamcr.2008.02.021. [DOI] [PubMed] [Google Scholar]
- 36.Woehler A., Wlodarczyk J., Ponimaskin E.G. Specific oligomerization of the 5-HT1A receptor in the plasma membrane. Glycoconj. J. 2009;26:749–756. doi: 10.1007/s10719-008-9187-8. [DOI] [PMC free article] [PubMed] [Google Scholar]
- 37.Renner U., Zeug A., Ponimaskin E.G. Heterodimerization of serotonin receptors 5-HT1A and 5-HT7 differentially regulates receptor signalling and trafficking. J. Cell Sci. 2012;125:2486–2499. doi: 10.1242/jcs.101337. [DOI] [PubMed] [Google Scholar]
- 38.Gorinski N., Kowalsman N., Niv M. Computational and experimental analysis of the transmembrane domain 4/5 dimerization interface of the serotonin 5-HT1A receptor. Mol. Pharmacol. 2012;82:448–463. doi: 10.1124/mol.112.079137. [DOI] [PubMed] [Google Scholar]
- 39.Miranda-Laferte E., Gonzalez-Gutierrez G., Hidalgo P. Homodimerization of the Src homology 3 domain of the calcium channel β-subunit drives dynamin-dependent endocytosis. J. Biol. Chem. 2011;286:22203–22210. doi: 10.1074/jbc.M110.201871. [DOI] [PMC free article] [PubMed] [Google Scholar]
- 40.Nölle A., Zeug A., Claus P. The spinal muscular atrophy disease protein SMN is linked to the Rho-kinase pathway via profilin. Hum. Mol. Genet. 2011;20:4865–4878. doi: 10.1093/hmg/ddr425. [DOI] [PubMed] [Google Scholar]