

Abstract
Cell fusion, a process that merges two or more cells into one, is required for normal development and has been explored as a tool for stem cell therapy. It has also been proposed that cell fusion causes cancer and contributes to its progression. These functions rely on a poorly understood ability of cell fusion to create new cell types. We suggest that this ability can be understood by considering cells as attractor networks whose basic property is to adopt a set of distinct, stable, self-maintaining states called attractors. According to this view, fusion of two cell types is a collision of two networks that have adopted distinct attractors. To learn how these networks reach a consensus, we model cell fusion computationally. To do so, we simulate patterns of gene activities using a formalism developed to simulate patterns of memory in neural networks. We find that the hybrid networks can assume attractors that are unrelated to parental attractors, implying that cell fusion can create new cell types by nearly instantaneously moving cells between attractors. We also show that hybrid networks are prone to assume spurious attractors, which are emergent and sporadic network states. This finding means that cell fusion can produce abnormal cell types, including cancerous types, by placing cells into normally inaccessible spurious states. Finally, we suggest that the problem of colliding networks has general significance in many processes represented by attractor networks, including biological, social, and political phenomena.
Introduction
Cell fusion is a process that combines two or more cells into one (1,2). The resulting cells are called heterokaryons (containing different nuclei) or, if the cells multiply, hybrids. Cell fusion has diverse functions, both as a physiological process and as a tool in therapy and research: it is required for normal development (2), has been implicated in cancer (3–5), and has been explored for stem cell therapy (6,7). For example, fusion of a sperm to an egg creates a hybrid that produces all cell types of our body (2); fusion of myoblasts produces skeletal muscles (8); fusion of monocytes creates osteoclasts, the cells that remodel bones (9); and fusion of macrophages, which is a part of the immune response, results in foreign-body giant cells (10). At the onset of human pregnancy, fusion of trophoblasts creates the syncytiotrophoblast, a giant cell that serves as the interface between the fetus and the mother and secretes a set of hormones, including chorionic gonadotropin, which is detected by pregnancy tests (11). Finally, fusion between circulating stem cells and resident cells of some organs can yield progenitor-like cells that can repopulate damaged tissues, a phenomenon that has been explored with a view to producing progenitors for stem cell therapy (see previous reviews (6,7,12).
These functions of cell fusion rely on its poorly understood ability to create new cell types. The potential danger of this ability may explain why cell fusion in the body is tightly controlled and is restricted only to certain cell types. For example, sperm fuses only to the egg, muscle precursors do not fuse to epithelial cells and epithelial cells do not fuse to each other (1,2). However, this regulation can be bypassed by molecules capable of fusing cell membranes (13). For example, viral fusogenic proteins function by fusing the viral envelope to the cell membrane, thus injecting the viral content into the target cell. Because these proteins can also fuse membranes of neighboring cells (13), infections with some viruses, such as herpes virus, measles, or HIV, are accompanied by accidental, indiscriminate cell fusion (4,14). The fate of the resulting cells is unknown.
We and others have proposed that accidental cell fusion can cause cancer and its progression (see previous reviews (4,5,15–17)). This model is based on several observations: 1), multinucleated tumor cells, whose origin is unknown, are common in cancers and precancerous lesions; 2), fusogenic proteins are often expressed in common cancers; 3), cell fusion causes conditions characteristic for cancer cells, such as chromosomal instability and epigenetic plasticity; 4), cell fusion can create new cell types or produce dedifferentiated cells; 5), fusion between cancerous and host cells has been demonstrated in experimental models of cancer; and 6), fusion of nontumorigenic cells can produce hybrids that form tumors in experimental animals.
Finally, a common trait of cancer cells and cell hybrids is the diversity of abnormal cell types and the heterogeneity of their populations (3–5). The phenotypic diversity of cancer cells is such that even experienced pathologists can disagree on identifying a particular cancer cell type (18), and the underlying molecular diversity has led to the view that each individual cancer is unique and thus requires personalized therapy (19). Genome-wide gene expression studies show that each cell hybrid is also unique (20–29). Some of this diversity can be ascribed to chromosomal instability, which is common in hybrids (4,30), but heterokaryons and hybrids that have stable chromosome complements also have unique gene expression patterns (23,31).
How does cell fusion produce new cell types? Cell fusion may combine properties of parental cells, thus creating a combination that is not found in other cell types. For example, hybridomas combine the ability of lymphocytes to produce a specific antibody with the ability of myeloma cells to proliferate indefinitely. Likewise, metastatic cells were proposed to arise by fusion of premalignant cells, which proliferate freely but do not spread, to cells that travel freely in the body, such as macrophages or circulating stem cells (5,15,32). However, simple blending of properties appears to be limited to fusion of closely related cell types (33) and does not explain how heterokaryons or hybrids acquire emergent properties (34). For example, in a mouse model of liver damage, fusion of bone-marrow-derived cells to hepatocytes produced cells that express a set of genes normally active in neuronal cells (34). Moreover, fusion of distinct cell types usually yields cells that fail to express cell-type-specific genes of each of the parents but retain expression of the housekeeping genes, a phenomenon called extinction (29,31,33,35). The mechanisms of extinction are largely unknown, and the functional properties of the resulting cells, which are of particular interest because the lack of a normal cell type identity is a common feature of cancerous cells, are poorly understood (35). The current view is that properties of hybrids are a result of interaction among a small set of parental cell-type-specific transcriptional regulators that somehow cancel each other (35).
We thought that the consequences of cell fusion could be understood better by considering the model of cells as attractor networks (36–38). A basic property of these networks is that they adopt a set of discreet, stable, and self-maintaining states called attractors. For example, a human cell is a network that interrelates tens of thousands of genes and an even larger inventory of their products, which implies an astronomical number of possible network configurations. However, each cell normally adopts only one of ∼400 stable states, known as cell types (39).
The attractor model is often visualized by comparing a cell to a ball that rolls on a virtual landscape whose points represent all states that the cell can adopt (40). Once the ball rolls into a basin, it settles at the bottom, which is an attractor that corresponds to a cell type. According to this model, the number of attractors that the cellular network can adopt determines the number of existing cell types. Because a perturbed network returns to its attractor unless it is moved beyond the edge of the attractor’s basin, the attractor model can explain why a differentiated cell retains its cell type despite perturbations and noise. The model also explains why switching a differentiated cell from one cell type to another is difficult, as this transition would require removing the cell from its current basin and transferring it to the desired basin across a hilly landscape that is filled with unrelated basins (38,40,41).
If cell types are network attractors, then understanding the consequences of fusing cells requires an understanding of the consequences of fusing attractor networks. Therefore, in this study, we represent cell types as attractors of artificial neural networks and model their fusion computationally. We find that hybrid networks can assume a new attractor state that is unrelated to either of the parental attractors and often has abnormal properties. Our findings explain how hybrids can acquire emergent properties and why properties specific to the parental cell types could be extinguished. Our findings also imply that even fusion of normal cells is prone to produce diverse abnormal hybrids with virtually unpredictable properties.
Methods
Description of the model
To model the intracellular regulatory network, we use time-dependent network equations similar to the continuous Hopfield model (42). The equations describe the levels of expression of a set of genes. The levels of expression are defined by the concentration of gene products in the cell contained in variables xi, where i is the gene number. Variable xi is shown in Figs. 1–3 by colored square arrays. This variable defines the deviation of concentration of products of gene number i from the basal level observed in the absence of all other genes. Red, green, and white pixels in Fig. 1 B correspond to the values of variable x equal to 1, −1, and 0 respectively. The gene products are assumed to be created at the rate described by variable ui and eliminated with time constant τ. The equation describing the dynamics of gene expression is therefore
| (1) |
The rate of gene-product creation is related to the concentration of other products by the network interaction matrix, . Here, is a nonlinear function that relates the rate of gene production to the concentrations of other gene products. We use the nonlinear function frequently employed in neural networks that form sparse representations (43,44). We assumed that for , for , and zero otherwise . This function has an interval of inputs within which it is zero. This property makes it possible for some genes to remain inactive, which means that gene activities are sparse (43,44). The function also saturates at large positive and negative values of input. We used and in our simulations. However, we have verified that similar results can be obtained if these parameters and function F are reduced by up to 50%, which implies that our conclusions are robust with respect to the choice of parameters.
Figure 1.
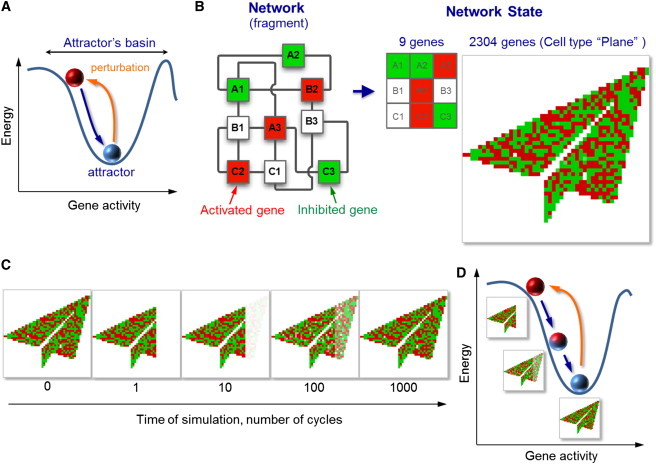
Cell types represented as network attractors. (A) An attractor is a state of a network in which the energy of this network is locally minimal within the region known as the basin of the attractor. The current state of a cell is represented as a ball at the bottom of the attractor. The ball displaced within the attractor’s basin returns to the attractor (see also Movie S1). (B) Cell types modeled as network attractors. A fragment of the network used in this study illustrates that it is composed of interconnected nodes (genes A1 to B3). The state of this network is represented by an array in which activated genes are indicated in red, inhibited genes in green, and genes with basal activity in white. The entire network contains 2304 (482) genes and its state is thus visualized by a 48 × 48 array. The network is preprogrammed to contain a set of attractor states (embedded cell types) that correspond to a set of recognizable pictorial symbols, such as Plane. (C and D) To verify that the Plane is an attractor state, the nose of the Plane is cut by resetting a group of the genes to their basal activity. The network spontaneously restores the nose by returning to its initial state, thus confirming that this state is an attractor.
Figure 2.
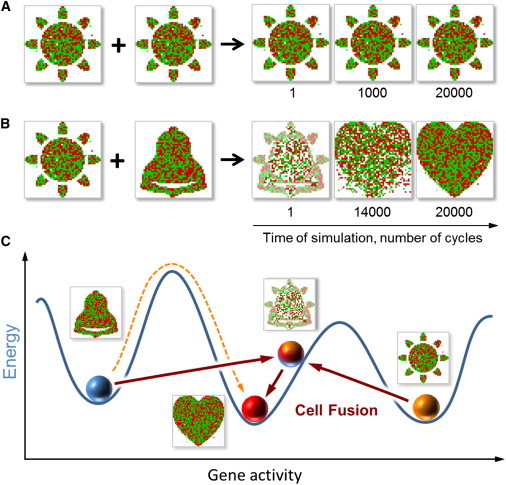
Simulated cell fusion can change cell types. (A) Fusion of two cells of the same type leads to a hybrid of the same type. (B) Fusion of two cell types (Sun and Bell) results in a hybrid that belongs to another cell type (Heart; see also Movie S2). (C) Interpretation of B. Cell fusion can transport a cell from one attractor (Bell) to the basin of another (Heart) by creating an intermediate product (Bell + Sun) with another cell (Sun). This mechanism bypasses the need to overcome the hills of the epigenetic space.
Figure 3.
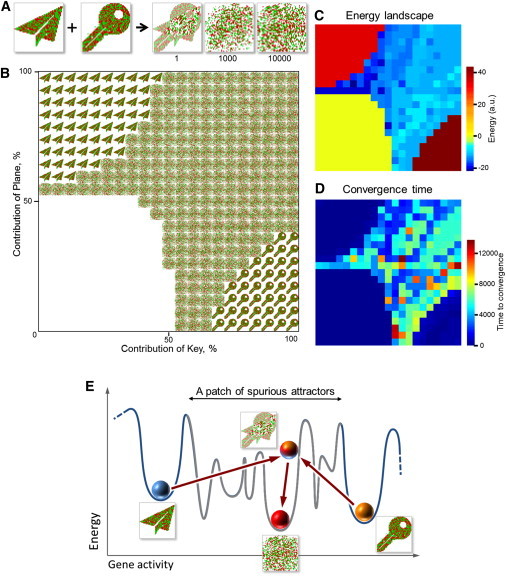
Simulated fusion of two embedded cell types places the resulting cell into one of numerous spurious states. (A) The evolution of the hybrid between Plane and Key (see also Movie S3). (B) Fusing two cell types results in a set of diverse hybrids. The fusion table shows the final settled gene activity patterns of hybrids obtained by fusing Plane and Key with varied contribution of each of these cell types at 5% increments. The white quadrant (lower left) represents the states in which all genes acquire their basal activity, an equivalent of cell death. (C) Spurious states differ in their energy, as shown in this energy map of the hybrids displayed in B. A 3-D representation of this map is shown in Fig. S1. Spurious attractors (center of image) are heterogeneous, as manifested by the diverse colors on the map, and the depth of these colors. (D) Settling into spurious states takes longer than settling into embedded states. The image shows the average time to reach the final states displayed in B. A 3-D representation can be seen in Fig. S2. (E) Cell fusion can place cells into spurious attractors. Fusion of Plane to Key creates a product that is in the basin of a spurious attractor. The abundance of spurious attractors (Fig. 3, B–D) suggests that they can exist in patches that cover the space between embedded (normal) attractors.
The network weight matrix contains information about the patterns of gene activities in embedded cell types:
| (2) |
Here, is the gene activity pattern corresponding to cell type number c, Nc is the number of nonzero pixels in this pattern, and the sum is assumed over 90 embedded cell types. This expression is similar to the standard form used in the Hopfield model (45), with the normalization dependent on the number of active genes. The patterns were generated from a library of black and white 48 × 48 icons modulated by random white-noise patterns through . We use a set of recognizable icons for illustration purposes. All patterns were downloaded from an internet database of black and white computer icons. The complete set of icons used in our simulations is presented in the Supporting Material.
Lyapunov function
By introducing a variable that could be viewed as the activity of the promoter of gene i, , we can rewrite Eq. 1 as
| (3) |
with the additional constraint . Equation 3 maps our dynamic model to the continuous Hopfield model (42). The role of energy in this equation is played by the Lyapunov function
| (4) |
This means that if the weight matrix is symmetric, the system of differential equations (Eq. 3) can be represented as a form of gradient descent with the energy function given by the Lyapunov function: . The cost function in Eq. 4 is (cf. Koulakov and Rinberg (44)). and can be evaluated to be
| (5) |
Because of the absolute value present in the first term of the cost function, some large nonzero force is needed to activate a gene, similar to sparse models with L1-norm cost, i.e., our model yields sparse activity vectors (43,44) with a large number of inactive genes. The Lyapunov function, L, for the pattern of gene activities after convergence is displayed in Fig. 3 C.
The Lyapunov function is nonincreasing in our model, i.e., . Indeed,
The latter result is nonpositive, because F is monotonously nondecreasing.
Modeling cell fusion
To implement cell fusion, we form the combination of gene activities corresponding to attractors from two parent cells . The coefficients c1 and c2 determine the contributions of the parents and vary from 0 to 1. These two coefficients form the set of coordinates for Fig. 3, B through D. Although for conserved volume and interpreting variables xi as concentrations we expect that , corresponding to the diagonal in the figures, we explored a 2D range of parameters. We assume therefore that volume may not be conserved in fusion and that gene products may be localized within cells in regions with nonconserved volume. The new variable, , is used as the initial condition for Eq. 1. After fusion, we run a simulation for 50,000 steps. The time constant in Eq. 1 is . We use simple finite differences with time step to model dynamics. We verify that the pattern of gene activities reaches convergence by ensuring that the activity vector did not change substantially at the end of the simulation.
To evaluate the convergence time to the final configuration, we calculate change in the gene activity vector as a function of time (Fig. 4). The time to convergence after fusion is calculated as . This variable is displayed in Fig. 3 D.
Figure 4.
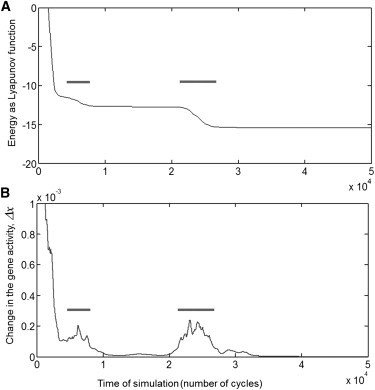
The convergence to the spurious state is not gradual and is punctuated by sudden changes in the network state separated by long periods of relative stability. The results are presented for the convergence to the mixture of 50% Plane and 50% Key, as depicted in Fig. 3. (A) The Lyapunov function, which plays the role of energy in this network, always decreases over time. The decrease is not uniform and consists in slow decay punctuated by fast drops (horizontal bar). (B) The change in the gene activity vector, (defined in Methods), displays spikes that coincide with the drops in the Lyapunov function.
Programming the result of cell fusion
Physiological cell fusion is a highly controlled event with a predictable outcome. The identities of parental and hybrid cell types are predetermined. For example, only certain cell types can fuse to create muscle fibers. The network mechanisms that make fusion predictable are likely to emerge in the course of evolution concurrently with cell types themselves. Although we observed that some embedded cell types emerged as the result of fusion of two other embedded cell types spontaneously, we found that it is also possible to program the outcome of cell fusion by adjusting the gene activity patterns corresponding to the desired hybrid. Thus, pattern Heart in Fig. 2 B was programmed to facilitate its production from the sum of Sun and Bell. To this end, we calculated the sum of the latter two patterns and assigned the white-noise variable to match the sign of for 40% of pixels chosen randomly within the overlap of these two patterns.
Results
To represent cell types as attractors, we adopted the mathematical formalism introduced by Hopfield to simulate associative memory in neural networks (42,45). In Hopfield networks, attractors represent patterns of neural activity that encode embedded memories. We applied this approach to represent patterns of gene activity corresponding to cell types. Our implementation includes several elements (Fig. 1 B). First, we defined the network nodes, which represent individual genes. Each gene can be activated or inhibited or can retain its basal activity. The pattern representing activities of all genes defines the network state. In the mathematical sense, this pattern is a vector with the length equal to the number of genes. If a gene in the network is activated or suppressed, the corresponding entry in the vector becomes positive or negative, respectively. Therefore, this vector defines how expression of a gene deviates from its basal level. The vector is visualized as an array (Fig. 1 B) in which each unit represents a gene. In this array, activated genes are denoted in red, inhibited genes in green, and genes whose activity is basal in white. Because our network contained 482 (2304) genes, the state of this network is visualized by a 48 × 48 array of units.
Next, we defined the patterns of gene expression that correspond to cell types in our model. To make these patterns recognizable, we used a set of 90 images (Supporting Material), such as Plane (Fig. 1 B), Key, Sun, etc. To make these patterns network attractors, we defined interactions between genes as prescribed by the Hopfield model (42,45). The interactions between a pair of genes were considered positive or negative to reflect the ability of genes in the cell to activate or suppress each other. The strength of interaction between any two genes was assumed to be proportional to the incidence with which their activities correlate in all 90 gene activity patterns (Supporting Material) that we designated as cell types (Methods, Eq. 2). Therefore, the more often any two genes are coactive in all 90 cell types, the stronger they activate each other in the model. In a similar way, the more often the activities of any two genes anticorrelate, the more strongly these genes inhibit each other. For simplicity, gene interactions were assumed to be pairwise and symmetric, meaning that if gene A can activate gene B, then the reverse is also true.
A key property of Hopfield networks is that if the interactions within every pair of elements are set as we just described, the patterns used to calculate these values become network attractors. Therefore, in our model, all 90 pictorial symbols that we designated as cell types and used to build gene-gene interactions became network attractors. We will call these 90 attractors embedded cell types. To verify that the embedded cell types are attractors, we perturbed one of them (Plane) by resetting some of its genes to their basal state (note the missing nose of the Plane in Fig. 1 C, T = 1). As expected, the network automatically restored the silenced region (see Fig. 1 C), confirming that Plane is an attractor.
To simulate cell fusion, we assumed that the gene activity pattern (i.e., the network state) of the hybrid is initially an average of the parental states. In other words, the activity of a gene in the newly formed hybrid is the average of the activities of this gene in the parents. We also assumed that fusion does not change how the genes interact with each other. Once the hybrid network is formed, its gene activity pattern then evolves spontaneously according to the rules of gene interactions. To test our simulation, we first fused two identical cell types. Fusing two Sun cell types resulted in a hybrid of the same type (Fig. 2 A). This implies that in the absence of differences between the parental states, the hybrid remains in the same attractor as its parents.
Fusing different cell types produced two types of hybrids. In one case, the hybrids assumed an embedded cell type (one of the designated 90 patterns) that was distinct from either parent. For example, fusing Sun and Bell resulted in Heart (Fig. 2 B). We interpret this result by assuming that the immediate product of combining Sun and Bell landed in the basin of the attractor Heart, because this attractor is located in the epigenetic space somewhere between the parental attractors (Fig. 2 C). This interpretation implies that cell fusion can almost instantly move a cell from attractor A to the basin of attractor B by creating an intermediate product with another cell. Because this process bypasses the need to overcome the hills that can separate A and B in the epigenetic landscape, one can argue that cell fusion allows a cell to hop between two attractors with the help of another cell.
In other cases, the hybrid network assumed stable states that were unlike any of the embedded cell types, such as a result of fusing Plane to Key (Fig. 3 A). Such de novo states are known in network theory as spurious attractors (42,46). They are emergent, unavoidable, and usually undesirable features of complex networks. Thus, we assumed that the hybrid of Plane and Key happened to be in the basin of a spurious attractor.
To test how abundant the spurious attractors are, we systematically changed the conditions of fusion by varying the relative contributions of the parents, Plane and Key (Fig. 3 B). If the contribution of one parent was relatively large, the hybrid assumed the cell type of this parent (Fig. 3 B, upper left and lower right quadrants of the fusion table), which is consistent with experimental observations (23). This behavior can be envisioned as a tug of war between two parents, in which weakening one competitor gives the victory to the other. If the contribution of both parents was below a certain threshold, then all genes in the hybrids assumed their basal activity (Fig. 3 B, lower left quadrant of the fusion table, white arrays). This event could be interpreted as an equivalent of cell death, that is, as a condition in which any interactions among genes cease to exist, implying that cell death is one of the attractors. The intermediate range of parental contributions produced numerous spurious states (Fig. 3 B, center). Notably, even an incremental change in parental contribution placed the hybrid into a spurious attractor, implying that the basins of embedded and spurious attractors are close to each other.
To determine whether spurious states observed in this experiment are diverse, we compared their energy defined as the Lyapunov function of the network (Fig. 3 C and Fig. S1 in the Supporting Material). A Lyapunov function is defined as a function that it is minimized by the dynamics of the network (42). Thus, despite not being related to any physical form of energy, this function can be viewed as a proxy for energy in complex systems and, as such, has been extensively used to study the properties of complex networks (42). The dynamics of a network is represented as a descent in the virtual landscape described by the Lyapunov function, similar to the descent of a ball in a physical landscape, and the local stable states, i.e., attractors, can be identified as local minima of this function. Hence, attractors can be distinguished from each other by comparing their Lyapunov function values. The spurious states that we observed (Fig. 3 B) differed in these values (Fig. 3 C and Fig. S1), indicating that these states are indeed diverse. The multitude and diversity of spurious attractors accessible to the hybrids of two cell types suggests that the number of spurious states in the network exceeds the number of embedded states.
Spurious states also differed from the embedded cell types and from each other in respect to the time that it took a hybrid network to reach them—reaching a spurious state took much longer (Fig. 3 D and Fig. S2). We also found that the convergence to the spurious state is not gradual and is punctuated by sudden changes in the network state separated by long periods of relative stability (Fig. 4). These observations mean that a newly formed hybrid system can undergo a long set of transformations before settling into its final spurious state.
Discussion
In this study, we computationally modeled fusion of cells assuming that they are attractor networks and that cell types are attractors (36–38,40). To simulate gene expression patterns corresponding to cell types, we used Hopfield nets, an approach that has been developed to simulate associative memory in neural networks. Our results lead us to propose that cancerous cell types correspond to spurious attractors, which are inherent and usually undesirable features of attractor networks. Our model also shows that cell fusion is prone to place cells into these spurious states, which may not be accessible by other means.
We suggest that cell fusion creates a new cell type in two steps. First, fusion of two cells immediately results in a heterokaryon whose gene expression pattern is a combination of the parental patterns. In the epigenetic landscape, this pattern would appear in an area that is distinct from either of the parental attractors. This pattern is likely to emerge in a basin of an attractor rather than directly in an attractor itself, as attractors are merely dots in a landscape formed by their basins (40). Therefore, during the second stage, the hybrid pattern will continuously change as the underlying network slides along the slope of the basin, converging to its attractor. The identity of this attractor will determine the cell type of the hybrid. This view implies that cell fusion can almost instantly move a cell from one attractor to the basin of another by creating an intermediate product with another cell.
Our model makes several specific predictions. First, fusion of just two cell types may result in a large number of diverse abnormal hybrids, which may have emergent properties. Second, adopting an abnormal cell type takes longer than adopting a normal cell type. Third, the convergence to the abnormal cell type is not gradual but is punctuated by several sudden changes in gene expression pattern. We suggest that this behavior of hybrid networks is consistent with two basic properties of cancer development. The protracted and uneven convergence to spurious attractors is similar to the dynamics of carcinogenesis (47), and the abundance and diversity of the spurious attractors is reminiscent of the diversity of cancerous cells (48,49). The behavior of hybrid networks also reflects properties of cell hybrids, as gene expression in cell hybrids can erratically change over time and include sudden, spontaneous changes after prolonged periods of latency (23,29,31,33).
Previous studies have suggested that cells become cancerous by assuming abnormal attractors that are unavailable during normal differentiation (37,50). The origins of these abnormal attractors and how the cells get there are unclear. We propose (Fig. 3 E) that these abnormal attractors are some of the spurious states inherent to attractor networks (42,46) and that the ability to place cells into a spurious attractor could be the main mechanisms through which cell fusion contributes to carcinogenesis. In other words, cancer could be a side effect of the ability of cell fusion to create new cell types. Which of the spurious attractors would correspond to cancerous cell types? We suggest that it could be any attractor that includes an activated set of genes whose products are sufficient to cause invasion and metastasis.
A view held currently is that a cell type created by cell fusion is determined by interactions among a small set of transcriptional regulators specific to parental cell types (6,7,51,52). In contrast, our results suggest that the cell type of hybrids may be a consensus that is reached through interactions between many, perhaps all, elements of the parental networks. The ability of cell fusion to move cells between unrelated attractors explains the appearance of emergent properties in hybrids (20–25,34,53), as well as repression of genes specific to parental cell types, a phenomenon known as extinction (31,35).
Our model suggests that using cell fusion in therapy (6,7) should be considered with an abundance of caution. For example, animal models suggest that fusing bone-marrow-derived cells to liver cells from the same patient could produce immunologically compatible progenitors that repopulate the damaged organ (34). The key question is whether such hybrids are harmless (21,34,54). Our model suggests that heterogeneity and abnormal properties of cell hybrids are inherent consequences of merging attractor networks. For example, we find that an incremental variation in relative contribution of parental networks can place the hybrid into a different attractor. Hence, the heterogeneity of parental cells with respect to cell volume, which doubles during the cell cycle, could result in hybrids that are heterogeneous with respect to their cell types. Our finding that some spurious attractors are adjacent to embedded attractors also implies that an incremental change in properties of parental cells can shift the resulting hybrid from a normal to an abnormal cell type. Finally, because settling into a spurious attractor takes longer than settling into an embedded attractor, abnormal properties of hybrids may manifest themselves only after a long period of latency.
To simulate cell types, we applied a formalism that has been developed and used to simulate patterns of associative memory. The question is to what extent this approach and, consequently, our conclusions regarding cell fusion and its relation to cancer are valid. One caveat is that we rely on a model that uses a simplified version of the intracellular network. This model does not account for compartmentalization of gene products within a cell, asymmetry in network interactions, interactions that involve more than two products, particular properties of eukaryotic genes and proteins, the dynamic nature of cellular attractors, cell-cell signaling, etc. We also assume that cell fusion does not affect gene-gene interactions. An open question is whether considering these properties would lead to a substantial change in our conclusions. We surmise that incorporating these properties into our model would reveal that reaching a consensus between two cells after their fusion is an even more complex process than we have described. However, we suggest that if cell types are network attractors, the basic rules that we outlined will stand. Thus, we propose that our model describes the class of behaviors pertinent to cells, rather than reproducing the detailed dynamics of gene interactions.
Previous studies of Hopfield networks suggest that many basic conclusions drawn from a simple model such as ours remain robust if the models are made more complex by accounting for specific properties of biological systems. For example, our model assumes that genes are fully and symmetrically connected, which is not always the case in the cell. Previous studies (55–58) have found, however, that basic properties of the Hopfield model, such as the presence of both embedded and spurious attractors remain robust in ultradiluted Hopfield networks, in which every node is connected asymmetrically with a small number of other randomly chosen nodes. In the context of gene-gene interactions, asymmetry of connections could implement predetermined paths of cell differentiation. Our approach can therefore be used to model cell differentiation by mechanisms other than cell fusion, such as during normal development. Another simplification of our model is that the gene network is represented by a fully random graph, whereas gene-gene interaction networks are not fully random but display complex features, such as small-world (59) and scale-free properties (60,61). However, the main conclusions of the Hopfield model also hold qualitatively for scale-free, small-world network architectures (62–64). Therefore, we propose that the class of behaviors displayed by our model can be generalized to more complex network architectures.
In our model, embedded attractors can be easily distinguished from spurious ones by visual examination, because the embedded states were defined as easily recognizable images (Supporting Material). In Hopfield networks, the number of stable spurious states is exponential in the number of embedded patterns (65). Embedded states become unstable, when their number exceeds ∼13% of network nodes (42). In this regime, only spurious states are stable. In our simulation, the ratio of embedded states to the number of network nodes is ∼4%, whereas in intracellular networks the ratio of cell types to the number of genes is 1–2% (considering 411 cell types and 22,000 human genes). Because our model belongs to the class of Hopfield models, the embedded states are stable in our simulations, whereas spurious cell types should substantially outnumber the number of embedded cell types. In cells, spurious attractors can be identified by analyzing gene expression patterns.
Because our simulation considers network elements and their interactions as abstractions, the basic implication of our study is that the propensity to assume abnormal states may be a fundamental emergent property of colliding networks rather than a result of how a particular network is implemented. For example, behavior of hybrid networks in our model is reminiscent of mergers of large businesses, which have been considered as complex attractor networks (66). As our model predicts, business mergers can produce companies that are successful because they have predicted properties, but they more often result in companies failing because their elements do not interact as expected (67). We suggest that the similarities between the consequences of merging living cells and businesses are not superficial, but may reflect general properties of hybrid networks. Overall, our study suggests that combining complex systems, whether they are cells, species, personalities, businesses, or countries is inherently fraught with the possibility of unintended outcomes.
Acknowledgments
The authors are grateful to C. B. Marks for numerous helpful discussions and to the reviewers for encouraging comments.
A.K. was supported by National Institutes of Health grant R01MH092928. A.K. acknowledges the hospitality of the Aspen Center for Physics, which is supported by National Science Foundation grant PHY-1066293. YL was supported by the Starr Foundation grant I3-A139.
Supporting Material
References
- 1.Ogle B.M., Cascalho M., Platt J.L. Biological implications of cell fusion. Nat. Rev. Mol. Cell Biol. 2005;6:567–575. doi: 10.1038/nrm1678. [DOI] [PubMed] [Google Scholar]
- 2.Oren-Suissa M., Podbilewicz B. Evolution of programmed cell fusion: common mechanisms and distinct functions. Dev. Dyn. 2010;239:1515–1528. doi: 10.1002/dvdy.22284. [DOI] [PubMed] [Google Scholar]
- 3.Duelli D., Lazebnik Y. Cell fusion: a hidden enemy? Cancer Cell. 2003;3:445–448. doi: 10.1016/s1535-6108(03)00114-4. [DOI] [PubMed] [Google Scholar]
- 4.Duelli D., Lazebnik Y. Cell-to-cell fusion as a link between viruses and cancer. Nat. Rev. Cancer. 2007;7:968–976. doi: 10.1038/nrc2272. [DOI] [PubMed] [Google Scholar]
- 5.Pawelek J.M., Chakraborty A.K. Fusion of tumour cells with bone marrow-derived cells: a unifying explanation for metastasis. Nat. Rev. Cancer. 2008;8:377–386. doi: 10.1038/nrc2371. [DOI] [PubMed] [Google Scholar]
- 6.Gurdon J.B., Melton D.A. Nuclear reprogramming in cells. Science. 2008;322:1811–1815. doi: 10.1126/science.1160810. [DOI] [PubMed] [Google Scholar]
- 7.Yamanaka S., Blau H.M. Nuclear reprogramming to a pluripotent state by three approaches. Nature. 2010;465:704–712. doi: 10.1038/nature09229. [DOI] [PMC free article] [PubMed] [Google Scholar]
- 8.Simionescu A., Pavlath G.K. Molecular mechanisms of myoblast fusion across species. Adv. Exp. Med. Biol. 2011;713:113–135. doi: 10.1007/978-94-007-0763-4_8. [DOI] [PubMed] [Google Scholar]
- 9.Vignery A. Macrophage fusion: molecular mechanisms. Methods Mol. Biol. 2008;475:149–161. doi: 10.1007/978-1-59745-250-2_9. [DOI] [PubMed] [Google Scholar]
- 10.Helming L., Gordon S. Molecular mediators of macrophage fusion. Trends Cell Biol. 2009;19:514–522. doi: 10.1016/j.tcb.2009.07.005. [DOI] [PubMed] [Google Scholar]
- 11.Pereira L., Maidji E., Tabata T. Insights into viral transmission at the uterine-placental interface. Trends Microbiol. 2005;13:164–174. doi: 10.1016/j.tim.2005.02.009. [DOI] [PubMed] [Google Scholar]
- 12.Alvarez-Dolado M., Martínez-Losa M. Cell fusion and tissue regeneration. Adv. Exp. Med. Biol. 2011;713:161–175. doi: 10.1007/978-94-007-0763-4_10. [DOI] [PubMed] [Google Scholar]
- 13.Sapir A., Avinoam O., Chernomordik L.V. Viral and developmental cell fusion mechanisms: conservation and divergence. Dev. Cell. 2008;14:11–21. doi: 10.1016/j.devcel.2007.12.008. [DOI] [PMC free article] [PubMed] [Google Scholar]
- 14.Murooka T.T., Deruaz M., Mempel T.R. HIV-infected T cells are migratory vehicles for viral dissemination. Nature. 2012 doi: 10.1038/nature11398. [DOI] [PMC free article] [PubMed] [Google Scholar]
- 15.Bjerkvig R., Tysnes B.B., Terzis A.J. Opinion: the origin of the cancer stem cell: current controversies and new insights. Nat. Rev. Cancer. 2005;5:899–904. doi: 10.1038/nrc1740. [DOI] [PubMed] [Google Scholar]
- 16.Lu X., Kang Y. Cell fusion as a hidden force in tumor progression. Cancer Res. 2009;69:8536–8539. doi: 10.1158/0008-5472.CAN-09-2159. [DOI] [PMC free article] [PubMed] [Google Scholar]
- 17.Parris G.E. The role of viruses in cell fusion and its importance to evolution, invasion and metastasis of cancer clones. Med. Hypotheses. 2005;64:1011–1014. doi: 10.1016/j.mehy.2004.11.012. [DOI] [PubMed] [Google Scholar]
- 18.Allison K.H., Reed S.D., Garcia R.L. Diagnosing endometrial hyperplasia: why is it so difficult to agree? Am. J. Surg. Pathol. 2008;32:691–698. doi: 10.1097/PAS.0b013e318159a2a0. [DOI] [PMC free article] [PubMed] [Google Scholar]
- 19.Dancey J.E., Bedard P.L., Hudson T.J. The genetic basis for cancer treatment decisions. Cell. 2012;148:409–420. doi: 10.1016/j.cell.2012.01.014. [DOI] [PubMed] [Google Scholar]
- 20.Powell A.E., Anderson E.C., Wong M.H. Fusion between intestinal epithelial cells and macrophages in a cancer context results in nuclear reprogramming. Cancer Res. 2011;71:1497–1505. doi: 10.1158/0008-5472.CAN-10-3223. [DOI] [PMC free article] [PubMed] [Google Scholar]
- 21.Ambrosi D.J., Tanasijevic B., Rasmussen T.P. Genome-wide reprogramming in hybrids of somatic cells and embryonic stem cells. Stem Cells. 2007;25:1104–1113. doi: 10.1634/stemcells.2006-0532. [DOI] [PubMed] [Google Scholar]
- 22.Cowan C.A., Atienza J., Eggan K. Nuclear reprogramming of somatic cells after fusion with human embryonic stem cells. Science. 2005;309:1369–1373. doi: 10.1126/science.1116447. [DOI] [PubMed] [Google Scholar]
- 23.Palermo A., Doyonnas R., Blau H.M. Nuclear reprogramming in heterokaryons is rapid, extensive, and bidirectional. FASEB J. 2009;23:1431–1440. doi: 10.1096/fj.08-122903. [DOI] [PMC free article] [PubMed] [Google Scholar]
- 24.Mukhopadhyay K.D., Bandyopadhyay A., Sun L.Z. Isolation and characterization of a metastatic hybrid cell line generated by ER negative and ER positive breast cancer cells in mouse bone marrow. PLoS ONE. 2011;6:e20473. doi: 10.1371/journal.pone.0020473. [DOI] [PMC free article] [PubMed] [Google Scholar]
- 25.Dittmar T., Schwitalla S., Zänker K.S. Characterization of hybrid cells derived from spontaneous fusion events between breast epithelial cells exhibiting stem-like characteristics and breast cancer cells. Clin. Exp. Metastasis. 2011;28:75–90. doi: 10.1007/s10585-010-9359-3. [DOI] [PubMed] [Google Scholar]
- 26.Wang Y., Fan H., Lu S. Fusion of human umbilical cord mesenchymal stem cells with esophageal carcinoma cells inhibits the tumorigenicity of esophageal carcinoma cells. Int. J. Oncol. 2012;40:370–377. doi: 10.3892/ijo.2011.1232. [DOI] [PubMed] [Google Scholar]
- 27.Lu X., Kang Y. Efficient acquisition of dual metastasis organotropism to bone and lung through stable spontaneous fusion between MDA-MB-231 variants. Proc. Natl. Acad. Sci. USA. 2009;106:9385–9390. doi: 10.1073/pnas.0900108106. [DOI] [PMC free article] [PubMed] [Google Scholar]
- 28.Klee W.A., Nirenberg M. A neuroblastoma times glioma hybrid cell line with morphine receptors. Proc. Natl. Acad. Sci. USA. 1974;71:3474–3477. doi: 10.1073/pnas.71.9.3474. [DOI] [PMC free article] [PubMed] [Google Scholar]
- 29.Ringertz N.R., Savage R.E. Academic Press; New York: 1976. Cell Hybrids. [Google Scholar]
- 30.Larizza L., Schirrmacher V. Somatic cell fusion as a source of genetic rearrangement leading to metastatic variants. Cancer Metastasis Rev. 1984;3:193–222. doi: 10.1007/BF00048385. [DOI] [PubMed] [Google Scholar]
- 31.Massa S., Junker S., Matthias P. Molecular mechanisms of extinction: old findings and new ideas. Int. J. Biochem. Cell Biol. 2000;32:23–40. doi: 10.1016/s1357-2725(99)00102-8. [DOI] [PubMed] [Google Scholar]
- 32.Munzarová M., Kovarík J. Is cancer a macrophage-mediated autoaggressive disease? Lancet. 1987;1:952–954. doi: 10.1016/s0140-6736(87)90295-9. [DOI] [PubMed] [Google Scholar]
- 33.Gourdeau H., Fournier R.E. Genetic analysis of mammalian cell differentiation. Annu. Rev. Cell Biol. 1990;6:69–94. doi: 10.1146/annurev.cb.06.110190.000441. [DOI] [PubMed] [Google Scholar]
- 34.Quintana-Bustamante O., Grueso E., Segovia J.C. Cell fusion reprogramming leads to a specific hepatic expression pattern during mouse bone marrow derived hepatocyte formation in vivo. PLoS ONE. 2012;7:e33945. doi: 10.1371/journal.pone.0033945. [DOI] [PMC free article] [PubMed] [Google Scholar]
- 35.Bulla G.A., Luong Q., Hickman S. Genome-wide analysis of hepatic gene silencing in mammalian cell hybrids. Genomics. 2010;96:323–332. doi: 10.1016/j.ygeno.2010.08.006. [DOI] [PubMed] [Google Scholar]
- 36.Huang S., Eichler G., Ingber D.E. Cell fates as high-dimensional attractor states of a complex gene regulatory network. Phys. Rev. Lett. 2005;94:128701. doi: 10.1103/PhysRevLett.94.128701. [DOI] [PubMed] [Google Scholar]
- 37.Huang S., Ernberg I., Kauffman S. Cancer attractors: a systems view of tumors from a gene network dynamics and developmental perspective. Semin. Cell Dev. Biol. 2009;20:869–876. doi: 10.1016/j.semcdb.2009.07.003. [DOI] [PMC free article] [PubMed] [Google Scholar]
- 38.Kauffman S.A. Oxford University Press; New York/Oxford: 1993. The Origins of Order: Self-Organization and Selection in Evolution. [Google Scholar]
- 39.Vickaryous M.K., Hall B.K. Human cell type diversity, evolution, development, and classification with special reference to cells derived from the neural crest. Biol. Rev. Camb. Philos. Soc. 2006;81:425–455. doi: 10.1017/S1464793106007068. [DOI] [PubMed] [Google Scholar]
- 40.Macarthur B.D., Ma’ayan A., Lemischka I.R. Systems biology of stem cell fate and cellular reprogramming. Nat. Rev. Mol. Cell Biol. 2009;10:672–681. doi: 10.1038/nrm2766. [DOI] [PMC free article] [PubMed] [Google Scholar]
- 41.Bar-Yam Y., Harmon D., de Bivort B. Systems biology. Attractors and democratic dynamics. Science. 2009;323:1016–1017. doi: 10.1126/science.1163225. [DOI] [PubMed] [Google Scholar]
- 42.Hertz J., Krogh A., Palmer R.G. Westview; Cambridge, MA: 1991. Introduction to the Theory of Neural Computation. [Google Scholar]
- 43.Rozell C.J., Johnson D.H., Olshausen B.A. Sparse coding via thresholding and local competition in neural circuits. Neural Comput. 2008;20:2526–2563. doi: 10.1162/neco.2008.03-07-486. [DOI] [PubMed] [Google Scholar]
- 44.Koulakov A.A., Rinberg D. Sparse incomplete representations: a potential role of olfactory granule cells. Neuron. 2011;72:124–136. doi: 10.1016/j.neuron.2011.07.031. [DOI] [PMC free article] [PubMed] [Google Scholar]
- 45.Hopfield J.J. Neural networks and physical systems with emergent collective computational abilities. Proc. Natl. Acad. Sci. 1982;79:2554–2558. doi: 10.1073/pnas.79.8.2554. [DOI] [PMC free article] [PubMed] [Google Scholar]
- 46.Amit D.J., Gutfreund H., Sompolinsky H. Storing infinite numbers of patterns in a spin-glass model of neural networks. Phys. Rev. Lett. 1985;55:1530–1533. doi: 10.1103/PhysRevLett.55.1530. [DOI] [PubMed] [Google Scholar]
- 47.Feinberg A.P., Ohlsson R., Henikoff S. The epigenetic progenitor origin of human cancer. Nat. Rev. Genet. 2006;7:21–33. doi: 10.1038/nrg1748. [DOI] [PubMed] [Google Scholar]
- 48.Bonavia R., Inda M.M., Furnari F.B. Heterogeneity maintenance in glioblastoma: a social network. Cancer Res. 2011;71:4055–4060. doi: 10.1158/0008-5472.CAN-11-0153. [DOI] [PMC free article] [PubMed] [Google Scholar]
- 49.Marusyk A., Polyak K. Tumor heterogeneity: causes and consequences. Biochim. Biophys. Acta. 2010;1805:105–117. doi: 10.1016/j.bbcan.2009.11.002. [DOI] [PMC free article] [PubMed] [Google Scholar]
- 50.Kaneko K. Characterization of stem cells and cancer cells on the basis of gene expression profile stability, plasticity, and robustness: dynamical systems theory of gene expressions under cell-cell interaction explains mutational robustness of differentiated cells and suggests how cancer cells emerge. Bioessays. 2011;33:403–413. doi: 10.1002/bies.201000153. [DOI] [PubMed] [Google Scholar]
- 51.Soza-Ried J., Fisher A.G. Reprogramming somatic cells towards pluripotency by cellular fusion. Curr. Opin. Genet. Dev. 2012 doi: 10.1016/j.gde.2012.07.005. [DOI] [PubMed] [Google Scholar]
- 52.Foshay K.M., Looney T.J., Lahn B.T. Embryonic stem cells induce pluripotency in somatic cell fusion through biphasic reprogramming. Mol. Cell. 2012;46:159–170. doi: 10.1016/j.molcel.2012.02.013. [DOI] [PMC free article] [PubMed] [Google Scholar]
- 53.Rappa G., Mercapide J., Lorico A. Spontaneous formation of tumorigenic hybrids between breast cancer and multipotent stromal cells is a source of tumor heterogeneity. Am. J. Pathol. 2012;180:2504–2515. doi: 10.1016/j.ajpath.2012.02.020. [DOI] [PMC free article] [PubMed] [Google Scholar]
- 54.Curril I.M., Koide M., Spees J.L. Incomplete reprogramming after fusion of human multipotent stromal cells and bronchial epithelial cells. FASEB J. 2010;24:4856–4864. doi: 10.1096/fj.09-152991. [DOI] [PMC free article] [PubMed] [Google Scholar]
- 55.Derrida B., Gardner E., Zippelius A. An exactly solvable asymmetric neural network model. Europhys. Lett. 1987;4:167–173. [Google Scholar]
- 56.Montemurro M.A., Tamarit F.A. An efficient dilution strategy for constructing sparsely connected neural networks. Physica A. 2001;294:340–350. [Google Scholar]
- 57.Arenzon J.J., Lemke N. Simulating highly diluted neural networks. J. Phys. Math. Gen. 1994;27:5161–5165. [Google Scholar]
- 58.Dasilva C.R., Tamarit F.A., Curado E.M.F. Generalization in a diluted neural-network. J. Phys. Math. Gen. 1995;28:1593–1602. [Google Scholar]
- 59.Watts D.J., Strogatz S.H. Collective dynamics of “small-world” networks. Nature. 1998;393:440–442. doi: 10.1038/30918. [DOI] [PubMed] [Google Scholar]
- 60.Barabasi A.L., Albert R. Emergence of scaling in random networks. Science. 1999;286:509–512. doi: 10.1126/science.286.5439.509. [DOI] [PubMed] [Google Scholar]
- 61.Albert R., Jeong H., Barabasi A.L. Error and attack tolerance of complex networks. Nature. 2000;406:378–382. doi: 10.1038/35019019. [DOI] [PubMed] [Google Scholar]
- 62.Stauffer D., Aharony A., Adler J. Efficient Hopfield pattern recognition on a scale-free neural network. Eur. Phys. J. B. 2003;32:395–399. [Google Scholar]
- 63.Costa L.D., Stauffer D. Associative recall in non-randomly diluted neuronal networks. Physica A. 2003;330:37–45. [Google Scholar]
- 64.Perotti J.I., Tamarit F.A., Cannas S.A. A scale-free neural network for modelling neurogenesis. Physica A. 2006;371:71–75. [Google Scholar]
- 65.Bruck J., Roychowdhury V.P. On the number of spurious memories in the Hopfield model. IEEE Trans. Inf. Theory. 1990;36:393–397. [Google Scholar]
- 66.Wilkinson I., Young L. On cooperating: firms, relations and networks. J. Bus. Res. 2002;55:123–132. [Google Scholar]
- 67.Bruner R.F. Wiley; Hoboken, N.J.: 2005. Deals from Hell: M & A Lessons That Rise Above the Ashes. [Google Scholar]
Associated Data
This section collects any data citations, data availability statements, or supplementary materials included in this article.