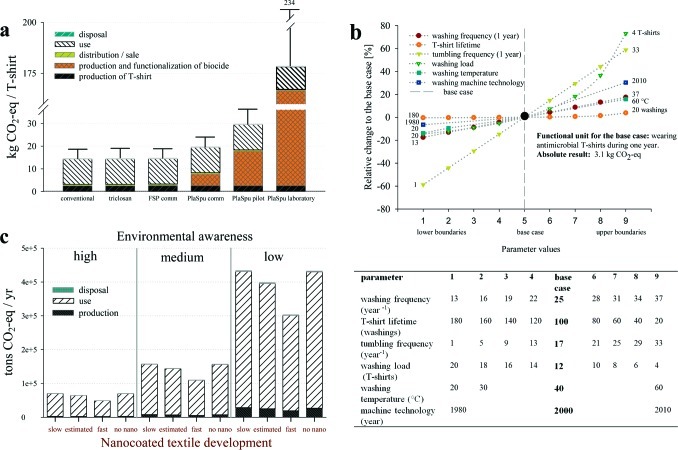
A correction to Figure 2 is given below, with the x-axis description being added.
Figure 2.
(a) Cradle-to-grave climate footprint of biocidal T-shirts and a regular T-shirt (100 washings). Error bars show the upper bound of the 95% confidence interval for the results (Monte Carlo Analysis of the inventory, see also SI S8; commercialized = comm.). (b) Sensitivity analysis of the use phase. The parameter values are listed below the graphic. (c) Annual climate footprint (GWP IPCC 2001, 100 yrs) of the scenarios with nanotechnology development on the bottom x-axis and changing environmental awareness on the top x-axis.


