

Abstract
Regions in left occipitotemporal (OT) cortex, including the putative visual word form area, are among the most commonly activated in imaging studies of single-word reading. It remains unclear whether this part of the brain is more precisely characterized as specialized for words and/or letters or contains more general-use visual regions having properties useful for processing word stimuli, among others. In Analysis 1, we found no evidence of greater activity in left OT regions for words or letter strings relative to other high–spatial frequency high-contrast stimuli, including line drawings and Amharic strings (which constitute the Ethiopian writing system). In Analysis 2, we further investigated processing characteristics of OT cortex potentially useful in reading. Analysis 2 showed that a specific part of OT cortex 1) is responsive to visual feature complexity, measured by the number of strokes forming groups of letters or Amharic strings and 2) processes learned combinations of characters, such as those in words and pseudowords, as groups but does not do so in consonant and Amharic strings. Together, these results indicate that while regions of left OT cortex are not specialized for words, at least part of OT cortex has properties particularly useful for processing words and letters.
Keywords: extrastriate, fMRI, fusiform, orthography, reading
General Introduction
Reading permeates our daily lives—from reading work-related documents and best-selling novels to reading directions and recipes. Students who develop into fluent readers take many years of training to acquire full proficiency, and fluent reading is a major predictor of success in school and life (Stanovich 1986). Perhaps, this protracted road to fluency reflects the fact that reading is a phylogenetically recent (i.e., ∼5000 years) development, becoming widespread in the developed world only in the last several centuries. Reading, then, necessitates the use of brain mechanisms that have not evolved explicitly for the purpose of reading. Though much progress has been made in the effort to describe the behavioral and neural underpinnings of this acquisition (see Schlaggar and McCandliss 2007 for a review), many open questions remain. Thus, an understanding of how the brain instantiates fluent reading and the types of neural processes that have come to be used for this evolutionarily recent task is of considerable interest, from both a basic science and a public health perspective.
Reading aloud requires transforming visual inputs into spoken outputs using orthographic, phonologic, semantic, and articulatory processes. While the neural localization of these transformations is still under study, a region in the left fusiform cortex, near the occipitotemporal (OT) junction, has been described as important for the higher level visual processing of words during reading (Cohen et al. 2002; McCandliss et al. 2003; Cohen and Dehaene 2004). As far back as 1892 (Dejerine 1892), lesions at or near this region have been shown to result in a relatively specific impairment of fluent reading (Dejerine 1892; Warrington and Shallice 1980; Cohen et al. 2003; Gaillard et al. 2006). Meta-analyses of functional neuroimaging studies show this OT fusiform region to be one of the most consistently reported locations of differential activation during single-word reading tasks (Turkeltaub et al. 2002; Jobard et al. 2003; Mechelli et al. 2003; Vigneau et al. 2006). Cohen et al. (2002) reported increased activity in this region when subjects viewed words regardless of case, size, and location, and some reports indicate increased activity for words relative to consonant strings, digits, and objects (Polk et al. 2002; McCandliss et al. 2003; Vinckier et al. 2007). These findings have led Cohen and colleagues to term this piece of OT fusiform cortex the “visual word form area” (VWFA; Cohen et al. 2002; McCandliss et al. 2003; Cohen and Dehaene 2004).
The appropriateness of referring to this brain region as the VWFA has been debated essentially since the term was coined (see “The myth of the visual word form area” by Price and Devlin 2003 for a review). Though some groups have reported more activity for letter strings than consonant strings and false fonts (Cohen et al. 2002; Polk et al. 2002; McCandliss et al. 2003; Baker et al. 2007; Vinckier et al. 2007), others have reported the opposite (Tagamets et al. 2000; Cohen et al. 2003; Xue et al. 2006). There are numerous reports of significant activity in this region when viewing picture stimuli (Bar et al. 2001; Price and Devlin 2003; Ben-Shachar et al. 2007; Ploran et al. 2007; Starrfelt and Gerlach 2007; Kherif et al. 2011), including reports of equivalent activity for pictures and words (Van Doren et al. 2010). Moreover, the specificity of lesion locations producing pure alexia has been questioned (Price and Devlin 2003; Hillis et al. 2005), as well as the specificity of letter processing disruption from lesions to the left OT fusiform cortex (Behrmann et al. 1990, 1998; Starrfelt et al. 2009). Several groups have found evidence that patients with apparently “pure alexia” also show impairments in naming objects, particularly under visually demanding circumstances including rapid presentation rates (Friedman and Alexander 1984) and increased complexity (Behrmann et al. 1998). At least some alexic patients are deficient in the simultaneous processing of both digits and letters (Starrfelt et al. 2009). Due to this controversy, we will refer to this region as the “putative visual word form area (pVWFA)” in order to emphasize that this label is contentious while still allowing for a convenient and recognizable description.
Despite (or perhaps because of) the uncertainty over the specificity of the processing performed in the pVWFA, the nature of that processing has been the subject of much study. Studies manipulating lexicality have consistently demonstrated that the pVWFA shows less activity for words than for pseudowords (Mechelli et al. 2003; Kronbichler et al. 2007; Bruno et al. 2008; Church et al. 2008, 2011) regardless of whether the pseudoword “sounds like a word” or not (Kronbichler et al. 2007; Bruno et al. 2008). Consistent with decreased pVWFA activity for familiar words relative to pseudowords, several groups have reported a negative relationship between pVWFA activity and word frequency (less activity for higher-frequency words) (Kronbichler et al. 2004; Church et al. 2011; Graves et al. 2010). Visual training of nonnative language logographic characters also leads to decreased activity in the pVWFA for the trained characters (Xue et al. 2006; Xue and Poldrack 2007). Generally, these results suggest that activity in the pVWFA decreases with increased exposure to specific visual forms.
Additionally, the pVWFA seems capable of performing visual processing at several levels of combinatorial complexity, ranging from bigrams to whole words. A recent study by Schurz et al. (2010) demonstrated a length-by-lexicality effect in the pVWFA, with increased activity for long pseudowords relative to short pseudowords but no corresponding effect of length for real words. The authors argue this length-by-lexicality interaction indicates sensitivity to both whole-word forms and chunks of words in the OT region. Cohen and colleagues have also found sensitivity to letter strings of variable length, ranging from bigrams to whole words in the pVWFA, though they argue this sensitivity exists in a posterior-to-anterior gradient moving from letters to whole words (Cohen and Dehaene 2004; Vinckier et al. 2007). Evidence of the ability of the pVWFA to process stimuli in groups of varying sizes can also be found in the lesion literature. Typically, patients with pure alexia have not lost the ability to read entirely. Rather, they have lost the ability to read words as a whole or in letter groups larger than single letters (Cohen et al. 2003). Starrfelt et al. (2009) tested patients whose pure alexia arose from damage to the pVWFA on tasks designed to measure simultaneous processing of both letters and digits and found these alexic patients to be impaired on both types of items.
It is also notable that activity in the pVWFA is most commonly seen in response to highly complex, high-frequency, high-contrast visual stimuli. Words are composed of individual components (i.e., letters, bigrams) with a number of features (i.e., conjunctions of lines) arranged in a complex order. Line-drawn objects, one of the other most common stimulus types shown to elicit strong activity in the pVWFA (Bar et al. 2001; Price and Devlin 2003; Ben-Shachar et al. 2007; Ploran et al. 2007; Starrfelt and Gerlach 2007; Van Doren et al. 2010) share the characteristic of complex conjunctions of many visual features. Relatedly, alexics have more difficulty processing complex visual stimuli (Behrmann et al. 1998). When activity for high–spatial frequency and low–spatial frequency visual stimuli is compared directly, the left fusiform cortex at or near the pVWFA shows more activity for the high–spatial frequency stimuli (Kveraga et al. 2007; Woodhead et al. 2011), consistent with a parvocelluar/ventral and magnocellular/dorsal processing stream distinction (Livingstone and Hubel 1987, 1988; Maunsell and Newsome 1987).
In this study, organized around 2 sets of analyses (described below), we aim to characterize further the role of left OT cortex in reading by investigating both the specificity of its activation for words and letters and the particular processing characteristics that might make it useful for reading. As mentioned above, Dehaene and Cohen (2007) have argued that the left OT fusiform cortex should be termed the VWFA due to their results indicating preferential processing of words and pseudowords versus similar visual stimuli and consistent activity despite changes in font, size, and location of word presentation. Cohen and Dehaene (2007) proposed that this type of regional specialization (increased activity for the “specialized” stimuli that does not depend on the specific visual features) arises due to a large body of experience and training with specific stimuli and that when such specialization through training occurs, the region can be thought of as becoming culturally adapted for predominant use in reading. We test for such specialization in left OT cortex in general and left pVWFA in particular in Analysis 1. The results presented in that study argue against this type of specialization or preferential processing, with nonletter stimuli showing increased activity relative to words and pseudowords in left OT cortex. After failing to find the type of specialization proposed by Cohen and Dehaene, we further explore whether the type of processing performed in left OT cortex might make it particularly suitable for use in reading and other visual processing tasks. In Analysis 2, we argue that processes such as the ability to manage complex visual stimuli in groups of various sizes (described above) do exist in left OT cortex at or near the pVWFA. These processing properties would make specific regions within left OT cortex particularly useful during reading, even though we contend that this extent of cortex does not include regions specialized for words and letters per se.
Analysis 1
Introduction
The aforementioned processing characteristics of the pVWFA—its sensitivity to visual perceptual training, its differential responses to variably sized “groups” of visual features, and its contribution to the processing of high-contrast, high–spatial frequency visually complex stimuli—certainly render plausible the notion that this region of cortex could be “co-opted” for use in reading through training as proposed by Dehaene and Cohen (2007). On the other hand, the pVWFA may indeed be ideally situated to perform the type of visual processing used in reading while also being more generally recruited for the visual processing of other nonletter and nonword stimuli containing similar visual properties in tasks with similar processing demands. In other words, this region could, through long-term use, come to be used predominantly in reading, or it could remain a more generic visual processor that is used in reading in addition to common use across a number of other tasks.
Here, we will attempt to adjudicate between these 2 hypotheses. To this end, we directly compare the blood oxygen level–dependent (BOLD) activity elicited by a matching task involving 6 classes of stimuli: words, pseudowords composed of legal letter combinations, nonwords composed of orthographically illegal letter combinations, consonant strings, line-drawn objects, and Amharic character strings (Amharic characters are used in the Ethiopian writing system). Because they are visually similar to Roman letters, yet have no meaning to the Amharic-naive English-speaking subjects in the present study, Amharic characters should not elicit strong activity in a region used predominantly for reading. As such, they are a useful stimulus class for querying the specificity of processing in the pVWFA.
Methods
Participants
Subjects included 27 (13 male) right-handed, native and monolingual English speakers, aged 21–26 years. All were screened for neurologic and psychiatric diagnoses and for use of chronic medications by telephone interview and questionnaire. The majority of subjects were from the Washington University or Saint Louis University communities and all were either college students or college graduates. All gave written informed consent and were compensated for their time per Washington University Human Studies Committee guidelines. All subjects were tested for IQ using the Wechsler Abbreviated Scale of Intelligence (Wechsler 1999) and for reading level using 3 subtests of the Woodcock–Johnson III (Letter–Word ID, Passage Comprehension, and Word Attack) (Woodcock and Johnson 2002). All subjects were determined to have above average IQ (average 127, standard deviation 7.7) and reading level (average reading level greater than or equal to that of college graduates, estimated by a composite of the 3 Woodcock-Johnson III subtests).
Stimuli
Stimuli used for the same/different judgment tasks (described in more detail below) consisted of pairs of either line-drawn pictures or 4-character strings. Strings were of 5 types: real words (e.g., ROAD), pseudowords with legal letter combinations (e.g., PRET), nonwords with orthographically illegal letter combinations (e.g., PPID), consonant strings (e.g., FGRT), or strings of Amharic characters (for more examples of all stimuli, see Fig. 1). Letter strings were always 4 letters long and presented in all uppercase letters to eliminate the possibility of matching on ascender/descender patterns. Words, pseudowords, and nonwords were matched for letter frequency, and consonant strings were screened to ensure none made an easily recognizable abbreviation and no letter was overrepresented. All string stimuli were matched for the number of repeated letter/characters present in each item. Each pair of items consisted of only one stimulus type. Pairs were presented with one string/picture above the fixation crosshair and one string/picture below. Each string or picture subtended approximately 0.5° visual angle and was presented 0.5° from the central fixation cross, in white on a black background. Stimuli were presented using PsyScope X (Cohen et al. 1993).
Figure 1.

Examples of stimulus pairs. Six types of stimulus pairs were used in a visual matching judgment task. Fifty percent of the pairs presented were the same (as seen in the second column), 25% were hard, 2-character different pairs (as seen in the third column), and 25% were easy, all different pairs (as seen in the fourth column). In the picture-matching run (bottom row), pictures were drawn from the same semantically related category for the hard condition and from separate semantic categories for the easy condition.
Subjects saw a single run of each stimulus type, with the ordering of the runs counterbalanced across participants. Sixty pairs of letter or Amharic character strings were presented in each string-matching run. In half of these pairs, the strings were identical. Of the remaining 30 pairs per run, half (15 pairs) were easy pairs, different in all 4 character positions, and half were hard pairs, different in only 2 character positions (for examples, see Fig. 1). The positions of the character substitutions were matched across string type. Each string was presented for 1500 ms. For the line-drawn pictures, 48 pairs of line-drawn objects from the Snodgrass and Vanderwart (1980) set were presented in a single run, half (24) of which were identical. Of the 24 remaining pairs, half were easy pairs, different and not in the same semantic category, and half (12) were hard pairs, different and in the same semantically related category (i.e., both animals, articles of clothing, or man-made manipulable objects). Each picture pair was presented for 750 ms. The line-drawn object presentation times were not matched to the string presentation times because they were optimized for a separate comparison, not presented in the current study. Four separate pseudorandom orders (constrained such that subjects never saw more than 3 identical or 3 different pairs in a row) were generated for each run/stimulus type.
Task Design
Subjects were asked to make a visual matching judgment on each pair of strings/pictures. Each subject was instructed to press a button with the index finger of one hand if the stimuli looked the same and with the index finger of the opposite hand if the stimuli looked different in any way. The hand assignment was counterbalanced across subjects.
In all runs, the stimulus trials were intermixed with an equal number of 2.5-s null frames in which only a fixation crosshair was present on the screen. Stimuli were intermixed with null frames such that pairs could appear in consecutive frames or with 1 or 2 null frames between stimulus presentations. Strings were presented for 1.5 s within a 2.5-s TR (time repetition), resulting in a 1-, 3.5-, or 6-s interstimulus interval. Pictures were presented for only 750 ms, resulting in a 1.75-, 4.25-, or 6.75-s interstimulus interval. Jittered spacing such as this allows for deconvolution of the hemodynamic response for individual trials (Miezin et al. 2000). Twenty-four separate lists with different combinations of stimulus trials and null frames were generated for the string-matching runs, while 12 separate lists were generated for the picture-matching runs.
Of note, the matching tasks were embedded within a longer study consisting of a series of tasks including single-letter matching, single-letter and picture naming, word and nonword reading, and rhyme and picture-sound judgment. In total, each subject performed 16 runs split over 2 scanning sessions held 1–28 days apart. All tasks were intermixed, and the order of the runs was counterbalanced within and across scanning sessions.
Behavioral Data Acquisition and Analysis
Behavioral data were collected via a PsyScope-compatible optical button box. Accuracy and response time (RT) were analyzed. Six-level repeated measures analyses of variance (ANOVAs) were used to determine whether the accuracy and RT varied by stimulus type (i.e., Amharic, consonant string, etc.). In the case of a significant effect of stimulus type, we planned an additional set of post hoc paired t-tests comparing each stimulus type with every other type.
MRI Data Acquisition and Preprocessing
A Siemens 3T magnetic resonance imaging (MRI) Trio scanner (Erlanger, Germany), with a Siemens 12-channel Matrix head coil was used to collect all functional and anatomical scans. A single high-resolution structural scan was acquired using a sagittal magnetization-prepared rapid gradient-echo (MP-RAGE) sequence (slice time echo = 3.08 ms, TR = 2.4 s, inversion time = 1 s, flip angle = 8°, 176 slices, 1 × 1 × 1 mm voxels). All functional runs were acquired parallel to the anterior–posterior commissure plane using an asymmetric spin-echo echo-planar pulse sequence (TR = 2.5 s, T2* evolution time 27 ms, flip angle 90°). Complete brain coverage was achieved by collecting 32 contiguous interleaved 4 mm axial slices (4 × 4 mm in-plane resolution).
Preliminary image processing included the removal of a single pixel spike caused by signal offset, whole-brain normalization of signal intensity across frames, movement correction within and across runs, and slice-by-slice normalization to correct for differences in signal intensity due to collecting interleaved slices (for detailed description, see Miezin et al. 2000).
After preprocessing, data were transformed into a common stereotactic space based on Talairach and Tournoux (1988) but using an in-house atlas composed of the average anatomy of 12 healthy young adults aged 21–29 years and 12 healthy children aged 7–8 years (see Lancaster et al. 1995; Snyder 1996; Brown et al. 2005 for methods). As part of the atlas transformation, the data were resampled isotropically at 2 × 2 × 2 mm. Registration was accomplished via a 12-parameter affine warping of each individual’s MP-RAGE to the atlas target, using difference image variance minimization as the objective function. The atlas-transformed images were checked against a reference average to ensure appropriate registration.
Participant motion was corrected and quantified using an analysis of head position based on rigid body translation and rotation. In-scanner movement was relatively low as subjects were both instructed to hold as still as possible during each run and were custom-fitted with a thermoplastic mask to minimize head movement during the scan session. However, frame-by-frame movement data from the rotation and translation in the x, y, and z planes was computed for each subject for each run, to ensure there were no runs with overall movement greater than 1.5 mm rms. No runs were removed as the maximum movement was 0.755 mm rms (average 0.254 mm rms).
fMRI Processing and Data Analysis
Stimulus type by timecourse analyses
Statistical analyses of event-related functional magnetic resonance imaging (fMRI) data were based on the general linear model (GLM), conducted using in-house software programmed in the interactive data language (Research Systems, Inc., Boulder, CO) as previously described (Miezin et al. 2000; Schlaggar et al. 2002; Brown et al. 2005). The GLM for each subject included time as a 7-level factor made up of the 7 MR frames (17.5 s, 2.5 s/frame) following the presentation of the stimulus, stimulus type as a 6-level factor (pictures, Amharic character strings, consonant strings, nonwords, pseudowords, and words), and pair type as a 3-level factor (same pairs, hard/2-character different [or same semantic category] pairs, and easy/4-character different [or different semantic category] pairs). No assumptions were made regarding the shape of the hemodynamic response function. Only correct trials were included in the analysis; errors were coded separately in the GLM (see Table 1 for information about error rates).
Table 1.
Behavioral results for the visual matching task
| Stimulus type | Accuracy | RT (msec) | ||||
| Average (%) | Range (%) | SD (%) | Average | Range | SD | |
| Pictures | 98 | 89.5–100 | 2.9 | 797 | 618–1289 | 145 |
| Amharic strings | 94.3 | 88.3–100 | 3.3 | 1373 | 907–1996 | 271 |
| Consonant strings | 98.1 | 81–100 | 3.4 | 1011 | 760–1706 | 224 |
| Nonwords | 97.9 | 73–100 | 5.1 | 919 | 771–1483 | 164 |
| Pseudowords | 98.3 | 90–100 | 2.5 | 886 | 701–1325 | 138 |
| Words | 98.6 | 95–100 | 1.8 | 898 | 705–1253 | 139 |
First, a 6 stimulus type (pictures vs. Amharic strings vs. consonant strings vs. nonwords vs. pseudowords vs. words) by 7 timecourse (7 timepoints) voxelwise whole-brain repeated measures ANOVA was conducted. A Monte Carlo correction was used to guard against false positives resulting from computing a large number of statistical comparisons over many images (Forman et al. 1995; McAvoy et al. 2001). To achieve a P < 0.05 corrected for multiple comparisons, a threshold of 24 contiguous voxels with a Z > 3.5 was applied.
This voxelwise analysis produced an image containing voxels showing a stimulus type by timecourse interaction (i.e., activity that both varies across the 7 timepoints and is different between the 6 stimulus conditions). Regions were extracted from this image using an in-house peak-finding algorithm (courtesy of Avi Snyder) that locates activity peaks within the Monte Carlo–corrected images by first smoothing with a 4-mm kernel, then extracting only peaks with a Z-score > 3.5, containing 24 contiguous voxels and located at least 10 mm from other peaks.
The directionality of the statistical effect was demonstrated by calculating separate stimulus type by timepoint ANOVAs for each type of stimulus compared with each other type of stimulus. These effects were then visualized by extracting the timecourses (percent BOLD signal change at each of the 7 timepoints) from every individual subject for each stimulus type in each of the regions defined from the ANOVAs described above. Percent BOLD signal change at each timepoint was averaged across all subjects, and these average timecourses were plotted for each stimulus type. Coordinates for significant regions are reported in MNI space (Evans et al. 1992).
Region-of-interest analyses
A similar analysis was performed on predefined regions of interest (ROIs), including the pVWFA coordinates from Cohen and Dehaene (2004) (left anterior VWFA: −43, −48, −12 [Talairach coordinates], −45, −51, −12 [MNI coordinates]; left classic VWFA: −43, −54, −12 [Talairach coordinates], −45, −57, −12 [MNI coordinates]; left posterior VWFA: −43, −68, −12 [Talairach coordinates], −45, −72, −10 [MNI coordinates]). For this literature-derived ROI analysis, we first converted the Talairach coordinates to our in-house atlas coordinates and then built an 8-mm sphere around each peak (though, again, MNI coordinates are used for reporting purposes). The same 6 × 7 repeated measures ANOVAs described above were applied to these regions looking for stimulus type by timecourse interactions. The percent BOLD signal change was extracted for each of the 7 timepoints for each stimulus type for each subject and then averaged for each timepoint to produce the group timecourses shown in Figure 3.
Figure 3.

Stimulus effects in literature-derived pVWFA regions. (A) Location of applied pVWFA regions from Cohen and Dehaene (2004), displayed on a transverse section through fusiform cortex and on a semi-inflated CARET surface. (B) Timecourses for all 6 stimulus types in the applied VWFA regions. There was no stimulus type by timecourse interaction in the anterior (−45, −51, −12, MNI coordinates) and classic (−45, −57, −12, MNI coordinates) regions. There is a significant stimulus type by timecourse interaction in the posterior (−45, −72, −10, MNI coordinates) region (P < 0.05), which post hoc ANOVAs show is due to trend-level greater activity for Amharic characters than consonants, pseudowords, and words (all P < 0.10) and significantly greater activity for pictures than nonwords, pseudowords, and words (all P < 0.04).
Regressing out RT
To ensure the effects reported here were not largely due to RT differences between the stimulus types, a separate set of GLMs similar to the stimulus type by timecourse GLMs described above was generated for each subject. These GLMs not only included separate terms for errors, stimulus type, and pair type (as above) but also coded the RT for each individual trial. Thus, RT could be used as a continuous regressor, and effects most related to RT would be assigned to that variable.
Results
Behavioral Results
All subjects performed the visual matching task with high accuracy (94–98%), though they were statistically significantly less accurate when matching the Amharic character strings than any other stimulus (P < 0.00001). Subjects were also significantly slower to match Amharic character strings than any of the other stimulus classes (P < 0.0001 for all post hoc t-tests) and were significantly faster to match pictures than any of the other stimulus types (P < 0.0001 for all post hoc t-tests). Subjects were also statistically slower to match consonant strings than all other letter strings (P ≤ 0.001 for all post hoc t-tests) and slower to match nonwords than pseudowords (P = 0.037), though there was no difference between consonant strings and nonwords, nonwords and words, or pseudowords and words. The average, range, and standard deviation of accuracy and RT for each type of stimulus pair are reported in Table 1.
Imaging Results
Stimulus type by timecourse interactions
A whole-brain analysis was performed first, in search of regions showing differential activity for the 6 stimulus types: pictures, Amharic character strings, consonant strings, nonwords, pseudowords, and words. A voxelwise 6 (stimulus type) by 7 (timepoints) whole-brain repeated measures ANOVA produced the set of regions with activity differentiating between the stimulus types across time shown in Figure 2B and detailed in Table 2. In all of these regions, the interaction was driven by the Amharic character strings, pictures, or both the Amharic character strings and pictures producing a more substantial change in BOLD signal than the letter strings. None of these regions showed more BOLD activity for words, or even for letter strings in general, than for Amharic character strings and pictures.
Figure 2.

Left fusiform regions showing a stimulus type by timecourse interaction. (A) Image derived from the whole-brain analysis, focusing on slices in occipital and fusiform cortex, showing voxels with a significant stimulus type by timecourse interaction. (B) Whole-brain analysis image showing all voxels with a significant stimulus type by timecourse interaction projected to the surface of semi-inflated brain surfaces rendered with CARET (Van Essen et al. 2001; http://brainmap.wustl.edu/caret). Letter labels indicate regions for which timecourses are shown in panels (C) and (D). (C) Timecourses for all 6 stimulus types in a left fusiform region posterior and superior to the classically described VWFA (−42, −76, −3 in MNI coordinates). Further ANOVAs show this interaction is due to more activity for Amharic characters than pictures (P < 0.001) and letter strings (P < 0.001 for all) and more activity for pictures than letter strings (P < 0.001 for all). (D) Timecourses for all 6 stimulus types in a left fusiform region anterior and medial to the classically described VWFA (−31, −61, −10 in MNI coordinates). Further ANOVAs show this interaction is due to more activity for Amharic characters than pictures (P < 0.001) and letter strings (P < 0.001 for all) and more activity for pictures than letter strings (P < 0.001 for all).
Table 2.
Regions showing a stimulus type by timecourse interaction
| MNI coordinates | Anatomical label | Interaction Z-score | Number of voxels | ||
| x | y | z | |||
| −31 | −61 | −10 | L fusiform | 8.58 | 309 |
| 30 | −53 | −15 | R fusiform | 7.44 | 270 |
| −30 | −83 | −7 | L fusiform | 8.51 | 384 |
| 11 | −83 | −11 | R fusiform | 5.51 | 47 |
| 44 | −59 | −8 | R fusiform | 8.72 | 325 |
| 41 | −69 | −6 | R fusiform | 8.89 | 395 |
| −42 | −76 | −3 | L fusiform | 9.46 | 334 |
| −15 | −101 | 5 | L occipital | 8.18 | 291 |
| 21 | −95 | 3 | R occipital | 6.31 | 145 |
| 35 | −86 | 3 | R occipital | 8.58 | 275 |
| −39 | −86 | 5 | L occipital | 9.55 | 241 |
| −1 | −91 | 6 | Medial occipital | 5.14 | 100 |
| −28 | −95 | 8 | L occipital | 9.11 | 323 |
| 26 | −96 | 13 | R occipital | 5.93 | 90 |
| −29 | −75 | 11 | L occipital | 5.76 | 96 |
| 10 | −86 | 6 | R occipital | 5.42 | 84 |
| 42 | −78 | 5 | R occipital | 8.84 | 298 |
| −44 | −78 | 14 | L occipital | 6.5 | 269 |
| 49 | −65 | 12 | R occipital | 5.45 | 167 |
| −18 | −66 | 14 | L occipital | 4.75 | 75 |
| 12 | −72 | 16 | R occipital | 5.62 | 158 |
| −3 | −76 | 18 | Medial occipital | 5.31 | 202 |
| 2 | −84 | 16 | Medial occipital | 4.92 | 111 |
| 3 | −79 | 30 | Medial occipital | 4.82 | 106 |
| −28 | −89 | 21 | L occipitoparietal | 8.74 | 397 |
| 38 | −83 | 15 | R occipital | 7.92 | 289 |
| −25 | −79 | 32 | L occipitoparietal | 6.92 | 302 |
| −30 | −65 | 18 | L occipitotemporal | 5.41 | 82 |
| −24 | −64 | 49 | L occipitoparietal | 7.7 | 417 |
| 30 | −72 | 40 | R occipitoparietal | 8.36 | 454 |
| 1 | −71 | 56 | Medial parietal | 7.33 | 283 |
| −16 | −75 | 54 | L parietal | 5.47 | 101 |
| 16 | −69 | 58 | R parietal | 7.13 | 278 |
| 6 | −48 | 48 | Precuneus | 4.82 | 82 |
| 2 | −50 | 73 | Precuneus | 6.46 | 123 |
| −39 | −44 | 47 | L parietal | 5.51 | 207 |
| 37 | −37 | 42 | R parietal | 5.37 | 153 |
| 3 | −35 | 27 | Posterior cingulate | 5.06 | 104 |
| 46 | −34 | 46 | R parietal | 6.37 | 211 |
| −34 | −28 | 60 | L parietal | 6.85 | 284 |
| 34 | −30 | 66 | R parietal | 5.59 | 78 |
| 28 | −57 | 53 | R parietal | 9.39 | 468 |
| −41 | −20 | 57 | L postcentral gyrus | 6.84 | 243 |
| 38 | −22 | 56 | R postcentral gyrus | 6.54 | 246 |
| −29 | 29 | 2 | L insula | 4.84 | 221 |
| 18 | 26 | 2 | R insula | 5.8 | 177 |
| −32 | 19 | 7 | L insula | 5.16 | 84 |
| 32 | 20 | 4 | R insula | 6.88 | 337 |
| 23 | 41 | 3 | R frontal | 5.13 | 236 |
| 50 | 29 | 6 | R frontal | 6.68 | 42 |
| 2 | 45 | 12 | Anterior cingulate | 4.69 | 124 |
| −7 | 14 | 41 | Anterior cingulate | 4.88 | 61 |
| 6 | 27 | 36 | Anterior cingulate | 6.32 | 244 |
| 49 | 31 | 24 | R frontal | 5.65 | 46 |
| 18 | 45 | 30 | R frontal | 5.62 | 157 |
| 29 | 23 | 32 | R frontal | 5.04 | 70 |
| 24 | 60 | −9 | R frontal | 5.11 | 109 |
| 30 | 36 | 39 | R frontal | 5.15 | 281 |
| −42 | −8 | 49 | L precentral gyrus | 6.85 | 108 |
| 35 | −14 | 63 | R precentral gyrus | 6.69 | 52 |
| 0 | −14 | 54 | Medial precentral gyrus | 4.81 | 60 |
| 48 | 5 | 36 | R precentral gyrus | 7.39 | 46 |
| 42 | 11 | 28 | L precentral gyrus | 6.22 | 56 |
| −26 | −5 | 52 | L precentral gyrus | 6.67 | 167 |
| 40 | 0 | 51 | R precentral gyrus | 6.4 | 266 |
| 27 | −5 | 56 | R precentral gyrus | 7.07 | 354 |
| 15 | −8 | 69 | R precentral gyrus | 5.86 | 64 |
| −6 | −2 | 59 | Medial precentral gyrus | 6.05 | 142 |
| −4 | 29 | 59 | Medial superior frontal | 4.87 | 68 |
| 2 | 17 | 53 | Medial superior frontal | 7.08 | 295 |
| 6 | −2 | 65 | Medial precentral gyrus | 5.3 | 122 |
| 1 | −8 | 10 | Thalamus | 4.65 | 46 |
| −12 | −22 | 14 | L thalamus | 5.04 | 44 |
| 28 | −11 | 8 | R thalamus | 4.38 | 24 |
| 11 | −15 | 7 | R thalamus | 4.8 | 107 |
| 15 | −6 | 18 | R basal ganglia | 4.95 | 95 |
| −11 | 16 | 0 | L basal ganglia | 5.16 | 90 |
| 11 | 16 | 3 | R basal ganglia | 5.78 | 169 |
| −25 | 6 | −5 | L basal ganglia | 6.05 | 133 |
| 24 | 9 | −5 | R basal ganglia | 5.48 | 153 |
| −9 | 5 | 3 | L basal ganglia | 5.26 | 68 |
| −20 | 7 | 8 | L basal ganglia | 5.96 | 150 |
| 18 | 4 | 8 | R basal ganglia | 6.01 | 257 |
| −33 | −55 | −26 | L cerebellum | 6.44 | 132 |
| −43 | −71 | −24 | L cerebellum | 4.54 | 50 |
| −1 | −81 | −20 | Medial cerebellum | 5.77 | 135 |
| 26 | −84 | −20 | R cerebellum | 6.31 | 211 |
Note: All coordinates are reported in MNI coordinates, listed by anatomical location. All show significantly greater deflection from baseline for Amharic characters, pictures, or both Amharic characters and pictures than for letter strings. L, left; R, right.
The general pattern of Amharic character strings and pictures resulting in greater activity than letter strings held even in regions identified in the left fusiform cortex (Fig. 2A), including those closest to the pVWFA (Fig. 2C,D). Post hoc comparisons of the BOLD timecourses for each stimulus type in the 2 extracted left fusiform regions show significantly more activity for Amharic character strings than pictures (P < 0.001) and more activity for pictures (P < 0.001 for all) and Amharic character strings (P < 0.001 for all) than for every kind of letter string. There was also slightly less activity for pseudowords than consonant strings in both regions (P = 0.006) and less activity for pseudowords than nonwords in the posterior fusiform region (Fig. 2C; P = 0.03). No other statistical differences were identified between letter strings in either region.
ROI analysis
None of the regions identified in the whole-brain analysis was a near-exact match to the classically described pVWFA. Therefore, we applied ROIs at the coordinates described by Cohen and Dehaene (2004): anterior VWFA (Talairach: −43, −48, −12; MNI: −45, −51, −12), classic VWFA (Talairach: −43, −54, −12; MNI: −45, −57, −12), and posterior VWFA (Talairach: −43, −68, −12; MNI: −45, −72, −10). A 6 (stimulus type) by 7 (timepoints) repeated measures ANOVA was performed on 8-mm diameter spherical regions centered on the aforementioned coordinates. The anterior and classic VWFA regions did not show a stimulus type by timecourse interaction, and all stimuli, including pictures and Amharic character strings, showed significantly positive BOLD activity in these regions (Fig. 3B,C). The posterior VWFA also showed significantly positive BOLD activity for all 6 conditions, along with a stimulus type by timecourse interaction (Fig. 3D). The pattern of activity in the posterior VWFA was similar to that described for the closest fusiform regions identified in the whole-brain analysis, with a trend toward greater activity for Amharic characters than consonants, pseudowords, and words (all P < 0.10) and significantly more activity for pictures than pseudowords, nonwords, and words (all P < 0.04).
Effect of RT
It is difficult to envision how RT would drive the results of the present study as the RT for matching pictures is significantly faster than the RT for matching letter strings, which is in turn significantly faster than the RT for matching Amharic character strings, a pattern that is inconsistent with the observed BOLD activity (letter strings < pictures < Amharic strings). Also, the pictures were presented for a shorter duration than the letter and Amharic strings, which should, if anything, decrease BOLD activity in visual processing regions, though the opposite is observed. Nonetheless, we wanted to rule out whether any of the observed imaging results might be due to the significantly longer RTs for matching Amharic character strings as compared with all other stimulus types by performing a second 6 (stimulus type) by 7 (timepoints) whole-brain repeated measures ANOVA with GLMs that included RT as a continuous regressor. Even with RT regressed out, the regions near the pVWFA identified in the whole-brain analysis continue to show a significant stimulus type by timecourse interaction with more activity for Amharic characters than pictures and more activity for both Amharic characters and pictures than for letter strings. Similarly, when RT is regressed out, there is still no effect of stimulus type in the anterior and classic VWFA applied regions (though there remains qualitatively more activity for Amharic character strings than letter strings), while the stimulus type by timecourse interaction (Amharic > pictures > letter strings) in the left posterior VWFA remains significant.
Discussion
To adjudicate between the competing hypotheses that 1) the pVWFA is predominately used in reading as the visual region most closely related to the processing of letters and words or 2) the pVWFA is a more general region used in the visual processing of letters, words, and other stimuli with similar visual processing demands, we compared BOLD activity elicited by a matching task involving 6 classes of stimuli: words, pseudowords composed of legal letter combinations, nonwords composed of orthographically illegal letter combinations, consonant strings, line-drawn pictures, and Amharic character strings. The equivalent or greater activity for matching Amharic character strings and line-drawn pictures as compared with letter strings in left OT fusiform regions strongly suggests that left OT cortex contains general visual processing regions that, while recruited for reading, also participate in the processing of many other kinds of visual stimuli. That is, the results of this study are contrary to the notion that there is specialization for words or letters in left OT cortex in general, or the pVWFA in particular, as indicated by increased (or at least equivalent) activity for nonletter stimuli relative to words and pseudowords. These results are also inconsistent with the notion that the role of the VWFA in reading precludes its involvement in other tasks that involve similar types of processing.
No demonstrable preferential activity for words and letterstrings is found in the pVWFA.
In this matching task, no brain regions were identified as showing more activity for words or letter strings than Amharic character strings and pictures, even when coordinates from the pVWFA (Cohen and Dehaene 2004) were applied directly. In applied VWFA regions, we found either no difference between letter strings and Amharic character strings and pictures (anterior and classic VWFA) or more activity for Amharic character strings and pictures than letter strings (posterior VWFA). While we, like Vinckier et al. (2007), see differences between the posterior pVWFA and more anterior regions, our results do not suggest any preference for words.
Our results are consistent with many previous studies that observed no preferential BOLD activity in the pVWFA for letters or words (see Price and Devlin 2003 for an early review, Xue et al. 2006; Xue and Poldrack 2007; Brem et al. 2010; Mei et al. 2010; Van Doren et al. 2010). A possible explanation for the discrepancy between our results and those that do show such preferential activity (Cohen et al. 2002; Vinckier et al. 2007) may be found in the task design, a similar observation to that noted in Starrfelt and Gerlach (2007). Our study utilized both a visual matching task and a long presentation time (1500 ms). Tagamets et al. (2000), Xue et al. (2006), and Xue and Poldrack (2007), all of whom showed more activity for false fonts than letters, used matching tasks with subsequently, rather than simultaneously, presented stimuli. This type of subsequent presentation matching design requires subjects to keep some representation of the stimuli online throughout the presentation set. Van Doren et al. (2010), who also showed equivalent activity for pictures and letters, used a recognition memory task that presumably requires deeper processing than the passive viewing (Cohen et al. 2002) or the simple ascender judgment (Vinckier et al. 2007) tasks that show more activity for letter strings than for consonant strings and false fonts. Additionally, both Cohen et al. (2002) and Vinckier et al. (2007) used very short presentation times (200 and 100 ms, respectively). When presentation time is increased in a passive viewing task (to 1700 ms), the word > consonant string effect is reversed and more activity is seen for consonant strings than for letters (Cohen et al. 2003).
Recently, Brem et al. (2010) demonstrated that even when there was no preferential activity for words in the pVWFA as measured by BOLD activity, there was preferential event related potentials, as measured by electroencephalography, in the N200 response for words relative to false fonts. The authors hypothesize that this difference may be related to the timescale of the preferential response—words are processed faster than false fonts in the pVWFA, but overall activity is relatively equivalent between the stimulus types. This “fast processing” advantage could account for the observed specialization for words in tasks with very fast presentation rates and minimal processing requirements (i.e., Cohen et al. 2002), relative to slower presentation rates (Cohen et al. 2003; the present study), increased memory requirements (Xue et al. 2006), or deeper processing demands (Van Doren et al. 2010). Thus, it seems that “preferential” activity for words and letter strings relative to other visual stimuli may be seen only when the task or presentation time does not allow for or does not encourage more than superficial processing of nonword or nonletter stimuli.
Analysis 2
Introduction
While Analysis 1 does not indicate that left OT cortex in general or the pVWFA in particular is predominately or preferentially used in reading, left OT cortex at or near the location of the pVWFA is consistently activated during single-word reading. Thus, this part of the brain likely performs some type of processing useful for reading. As discussed in the General Introduction, the literature points to several possible processing characteristics of the pVWFA that would be useful for the type of visual transformation required by reading. A visual region used for reading is likely to respond to high spatial frequency, high contrast stimuli with complex (multicomponent) features, exactly those visual features that characterize letters and words. Additionally, reading requires the ability to group stimuli, particularly familiar stimuli, into the appropriate visual chunks since fluent reading entails putting letters into statistically appropriate combinations that form large chunks or whole words. This grouping likely underlies the ability of fluent readers to read high-frequency words of variable length in about the same amount of time (Weekes 1997; Cohen et al. 2003).
In Analysis 2, we directly test for brain regions with activity related to 2 of the processing demands useful for but not exclusive to reading, specifically visual complexity and the ability to group visual stimuli. To this end, we took advantage of various dimensions of the non-object stimuli presented in the visual matching experiment described in Analysis 1.
Changizi and Shimojo (2005) proposed that the visual complexity of a writing system could be measured by the number of brushstrokes per character. We adapted this measure of visual complexity as a way of characterizing the string pairs described in Analysis 1 in order to identify brain regions exhibiting sensitivity to line-based visual complexity.
Additionally, we leveraged the fact that stimulus pairs differed by either 2 or 4 characters as a means of querying for cortical regions that demonstrate visual “chunking” or “grouping.” Comparing BOLD activity for stimuli that are processed in a group versus those that must be processed as individual components potentially allows us to identify regions used in grouped visual processing. Stimuli processed as individual components, or characters, should elicit increased RT and increased BOLD activity for pairs that are all the same relative to pairs that are 2 characters different, which in turn should require greater processing time and BOLD activity than pairs that are all different. Such increases in RT and BOLD activity reflect the fact that stimuli processed sequentially require comparing only 1 character when the strings are all different; 1, 2, or 3 characters when the strings have 2-character differences, and all 4 characters when the strings are identical. If, in contrast, the strings can be processed in chunks or as a whole, there should be similar activity for at least the identical and 4-character difference pairs. We hypothesized that real words should be able to be processed as a group, as discussed above. However, stimuli very different from real words, like Amharic strings, even though they elicit strong activity in this region, are not expected to be processed as a singular group. To test this hypothesis, we compared RT and BOLD activity for the different pair types (identical, hard/2-, and easy/4-character different pairs) and tested for RT and BOLD activity differences for pair types that depended on stimulus type.
Methods
All subjects, stimuli, task design, imaging acquisition, and preprocessing were identical to those described in Analysis 1. Data analysis, however, utilized 2 different sets of statistical analyses described below.
Complexity by Timecourse Analysis
A set of GLMs was created for the 5 types of string stimuli to look at the effect of visual complexity. In these GLMs, each trial was coded by stimulus type (Amharic character strings, consonant strings, nonwords, pseudowords, and words) and visual complexity as measured by the number of brushstrokes per character (criteria defined in Changizi and Shimojo 2005). Each pair was given a single complexity value by adding together the number of brushstrokes per character for each character in each pair. Complexity was used as a categorical variable by dividing the set of 60 pairs of each stimulus type into thirds (see Table 3). The 20 pairs with the highest complexity values were labeled “most complex,” the 20 pairs with the lowest complexity values “least complex,” and the middle 20 were modeled as a separate category in the GLM but not included in subsequent analyses. A 2 (most vs. least visually complex) by 7 (timepoints) whole-brain repeated measures ANOVA that collapsed complexity across all stimulus types was used to identify voxels showing a significant effect of visual complexity. The same methods described in Analysis 1 were used to correct for multiple comparisons, extract peaks of activity, and identify ROIs. The timecourse of BOLD signal change was extracted for each subject for the identified regions and averaged together to create group timecourses.
Table 3.
Average complexity values for stimulus pairs
| Stimulus type | Average complexity of all pairs | Average complexity of least complex pairs | Average complexity of most complex pairs |
| Amharic strings | 33.53 | 27.78 | 39.15 |
| Consonant strings | 20.4 | 17.0 | 23.7 |
| Nonwords | 20.2 | 15.95 | 24.05 |
| Pseudowords | 20.2 | 16.45 | 23.9 |
| Words | 20.2 | 16.35 | 24.5 |
Note: Complexity for each pair was computed as the summed value of brushstrokes/character (Changizi and Shimojo 2005) for all 8 characters in each pair. The 20 pairs with the highest complexity values for each stimulus type were labeled “most complex” and the 20 pairs with the lowest complexity values for each stimulus type were labeled “least complex.”
ROI-based analysis
A 2 (most vs. least visually complex) by 7 (timepoints) ANOVA was also performed on the BOLD activity from a 10-mm spherical region centered on the coordinates of the classically described pVWFA (Cohen and Dehaene 2004), and timecourses for the most and least complex pairs (averaged across stimulus types) were extracted.
Pair Type by Timecourse Analysis
Behavioral analysis
A pair type (same, hard/4-character different pairs, easy/2-character different pairs) by stimulus type (Amharic, consonants, nonwords, pseudowords, words) repeated measures ANOVA was performed. As the pair type by stimulus type interaction was found to be significant, we subsequently performed planned post hoc single-factor repeated measures ANOVAs of pair type (with 3 levels) for each stimulus type individually. For any stimulus showing a significant effect of pair type, we performed paired t-tests comparing each pair type against every other pair type within that stimulus.
Imaging analysis
Another set of GLMs, identical to the stimulus type by timecourse GLMs described in Analysis 1 but excluding pictures, was generated. A 3 (pair type: same vs. hard vs. easy) by 7 (timepoints) whole-brain repeated measures ANOVA that collapsed across all stimulus types was used to identify voxels that showed an effect of pair type. The same methods described in Analysis 1 for multiple comparison correction, peak extraction, and ROI identification were used. Timecourses of BOLD signal change for the 3 separate pair types were extracted for each subject for the identified regions and averaged together to create group timecourses.
A separate region-based repeated measures ANOVA was also performed on the “pair type by timecourse” regions identified in the above-described analysis. This 5 (stimulus type: Amharic vs. consonants vs. nonwords vs. pseudowords vs. words) by 3 (pair type: same vs. hard vs. easy) by 7 (timepoints) repeated measures ANOVA was used to look for effects of pair type that varied with stimulus type. The timecourse of BOLD signal change was extracted for each subject for each pair type for each stimulus type and averaged together to create group timecourses. Additionally, separate ANOVAs were run for each stimulus type to determine the effect of pair type on each stimulus type individually.
ROI-based analysis
A 3 (pair type) by 7 (timepoints) ANOVA was performed for each stimulus type on the BOLD activity from a 10-mm spherical region centered on the coordinates of the classically described pVWFA, and timecourses for the 3 pair types were extracted for each stimulus type.
Regressing out RT.
In this analysis, the RT effects mimicked the BOLD effects; thus a separate set of GLMs was generated for each subject to ensure the effects reported were not simply due to these RT differences. Separate GLMs including RT as a trialwise regressor were generated for both the complexity by timecourse and pair type by timecourse GLMs described above.
Conjunction of Interactions
To determine whether the stimulus-by-timecourse, complexity-by-timecourse, and pair type-by-timecourse interactions described above were identified within an overlapping region, we performed a conjunction analysis of the 3 interactions. For each interaction, we first created a thresholded image, including only voxels showing an interaction Z-score > 3. We then converted these thresholded images to a positive mask, where every voxel present (i.e., every voxel with Z > 3) was labeled as “active” (with a value of 1) and every other voxel given a value of 0. These 3 thresholded masked images were then summed so that voxels showing all interactions would have a value of 3. The same peak-finding algorithm described above was used to identify the peak coordinates of any region showing all effects.
Results
Complexity-by-Timecourse interactions
Whole brain analysis. The effect of complexity was analyzed in a 2 (most/top 20 vs. least/bottom 20 complex pairs) by 7 (timepoints) whole-brain repeated measures ANOVA, which identified 2 groups of voxels showing an effect of visual complexity: one near the left OT border (−40, −64, −4 in MNI coordinates, shown in Fig. 4) and one in right posterior occipital cortex (28, −95, 0 in MNI coordinates, data not shown). In both cases, there was more BOLD activity for the most complex stimuli relative to the least complex stimuli. There was no complexity by stimulus type by timecourse interaction (i.e., the effect of complexity did not depend on the type of stimulus), and in all stimulus types, the most complex pairs produced more activity than the least complex pairs. Of note, Amharic characters were more visually complex than all of the letter strings (see Table 3), which could have contributed to the increased activity for Amharic characters relative to letter strings in the stimulus type by timecourse analyses presented in Analysis 1.
Figure 4.

Left OT region showing a complexity by timecourse interaction. (A) Location of voxels showing a visual complexity by timecourse interaction Z-score > 3.5 in a transverse slice through fusiform cortex. The circled OT region (−40, −64, −4 in MNI coordinates) was the only left hemisphere region identified. (B) Location of the left OT region from panel (A) showing a visual complexity by timecourse interaction on a semi-inflated CARET surface. (C). Timecourses for the most and least visually complex pairs (all stimulus types averaged together) in the left OT region identified from the whole-brain complexity by timecourse analysis. This region shows more activity for the most complex relative to the least complex pairs (P = 0.013).
ROI-based analysis. A qualitatively similar result was found in the applied pVWFA ROI that is 1.2 cm vector distance from the regions identified from the voxelwise analysis (Fig. 5). While there was no statistical complexity-by-timecourse interaction in this region, there was a significant effect of complexity (P = 0.02, Z = 2.41) demonstrated by more activity for the most complex versus the least complex pairs.
Figure 5.

Complexity timecourses in the applied pVWFA ROI. There is more activity for the most visually complex pairs of stimuli relative to the least complex pairs in an applied, classically defined pVWFA region (Cohen and Dehaene 2004).
Pair Type by Stimulus Type Interactions
We earlier mentioned that fluent reading requires processing visual stimuli in “groups” or “chunks”. Making same/different judgments on strings of all different items should be easy regardless of whether those stimuli are processed as groups or in chunks (since such a distinction can be made by looking only at 1 character), while making such judgments on strings with only 2-character differences should take longer and entail more processing. Making a same/different judgment on identical strings should take even longer than matching 2-character substitution strings if each character must be evaluated individually but should be done very quickly if all items are processed together.
Behavioral results. Evaluating the overall pattern of RTs to make such decisions shows a mixed set of effects in the present study. Collapsing across stimulus type, there is an effect of pair type on RT (P < 0.001) with the fastest RT for the easy/4-different judgments, which is significantly faster than the hard/2-different pairs (P < 0.001), which is significantly faster than the same pairs (P < 0.001). However, our stimuli were designed so that some obeyed the rules and statistical regularities of real words (words and pseudowords), while others did not follow such rules and regularities (consonant strings and Amharic character strings). Thus, we performed a second repeated measures ANOVA on the RTs, taking into account not only pair type but stimulus type as well. There is a pair type by stimulus type interaction on RT, indicating the effect of pair type differs by stimulus type.
RTs to match the consonant and Amharic character strings increased with the number of characters that must be evaluated sequentially to make a same/different judgment (see Fig. 6). Subjects were fastest to match the easy stimuli different in all 4 character positions (P < 0.001 for both stimulus types). Matching hard pairs with 2-character differences was somewhat slower (P < 0.001 for both stimulus types), and the slowest RTs were found when matching pairs that were all the same (P ≤ 0.001 for both stimulus types). As described in the Introduction to Analysis 2, this pattern is expected if subjects have to process each character sequentially to make the same/different judgment. Thus, we will henceforth refer to the Amharic character and consonant strings as “ungroupable.”
Figure 6.
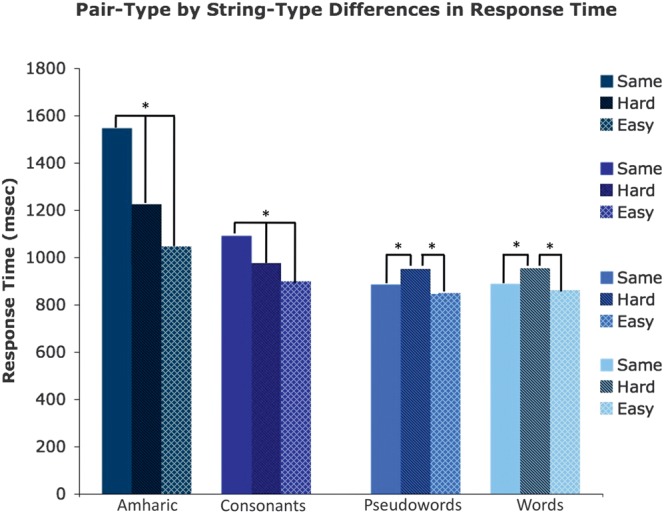
RT to match various pair types for each stimulus type. RT to match Amharic character and consonant strings increases with the number of characters that must be evaluated to make the matching decision. The RTs are significantly different for all pair types in these stimuli. RTs to match pseudowords and words are equivalent for the same and easy (4-different) pairs, which are faster to match than hard (2-different) pairs. All statistical effects are denoted with asterisks indicating P < 0.05. Error bars indicate the standard error of the mean.
In contrast, subjects are about as fast to make a same/different judgment on the same pairs as the easy (4-different) pairs (P ≥ 0.08) for stimuli that follow the rules and regularities of real words (words and pseudowords), indicating these stimuli are processed as “groups” (see Fig. 6). The increased RT for hard (2-different) pairs (P ≤ 0.02 for all contrasts in both stimulus types) in the words and pseudowords could be due to the shared letters between the pairs. Such shared letters could cause the activation of overlapping representations, resulting in increased processing time to resolve the discrepancy. Thus, we will henceforth refer to words and pseudowords as “groupable.”
Whole brain analysis. A brain region in which neural processing is related to grouping visual stimuli should have a pattern of BOLD effects similar to that observed for the RTs. We first compared the BOLD response for the 3 different pair types, as done for RT, in a 3 (pair type: easy vs. hard vs. same) by 7 (timepoints) whole-brain repeated measures ANOVA that collapsed across stimulus type. This whole-brain ANOVA identified a number of regions in frontal and parietal cortex (left lateral hemisphere regions shown in Fig. 7B, all detailed in Table 4) as well as a single left OT region (−44, −67, −4 in MNI coordinates, shown in fuchsia in Fig. 7B). The left OT region (and all pink regions in Fig. 7B) showed a similar pattern as the RTs for the words and pseudowords—more activity when pairs are identical or differed in only 2 characters than when the pairs differed in all 4 character positions (Fig. 7C).
Figure 7.

Left OT region showing a pair type by timecourse interaction. (A) Location of voxels showing a pair type by timecourse interaction Z-score > 3.5 in a transverse slice through fusiform cortex. The peak of the left OT region is located at −44, −67, −4 in MNI coordinates. (B) All left lateral hemisphere regions showing a pair type by timecourse interaction on a semi-inflated CARET surface. In fuchsia is the OT region shown in panel (A). Pink regions show a similar pattern of effects as the fuchsia region (BOLD activity for same pairs = hard/2-different pairs > easy/4-different pairs); green regions show BOLD activity for hard pairs > same pairs = easy pairs. (C) Timecourses for the 3 types of stimulus pairs (pairs of the same strings, hard pairs, easy pairs, BOLD activity from all stimulus types averaged together) in the left OT region identified from the whole-brain difficulty by timecourse region circled in panel (A) and shown in fuchsia in panel (B).
Table 4.
Regions showing a pair type by timecourse interaction
| Anatomical location | MNI coordinates | Number of voxels | Pair type Z-score | Pair type effects | 3-Way interaction P value | ||
| x | y | z | |||||
| L fusiform | −44 | −67 | −4 | 31 | 3.42 | H = S > E | 0.0013 |
| R fusiform | 41 | −84 | 10 | 30 | 3.29 | H = S > E | 0.022 |
| R parietal | 33 | −58 | 53 | 431 | 6.30 | H = S > E | 0.00149 |
| L occipital | −30 | −93 | 19 | 56 | 4.12 | H = S > E | 0.034 |
| R precentral gyrus | 27 | −7 | 53 | 48 | 4.30 | H = S > E | 0.074 |
| L occipital | −5 | −82 | −13 | 31 | 3.66 | H = S > E | 0.749 |
| R occipital | 31 | −88 | 12 | 78 | 3.79 | H = S > E | 0.226 |
| R basal ganglia | 11 | 2 | 5 | 49 | 3.48 | H = S > E | 0.724 |
| R basal ganglia | 10 | −16 | 13 | 46 | 3.70 | H = S > E | >0.75 |
| L basal ganglia | −9 | −18 | 14 | 41 | 3.81 | H = S > E | 0.987 |
| L basal ganglia | −14 | −4 | 14 | 96 | 4.18 | H = S > E | 0.771 |
| R basal ganglia | 17 | −4 | 18 | 92 | 4.03 | H = S > E | >0.75 |
| L cerebellum | −29 | −58 | −28 | 71 | 3.77 | H = S > E | 0.24 |
| L parietal | −28 | −62 | 50 | 458 | 6.28 | H > S > E | 0.000045 |
| Anterior cingulate | −3 | 15 | 52 | 346 | 5.81 | H > S > E | 0.021 |
| R precentral gyrus | 42 | 6 | 33 | 369 | 5.57 | H > S > E | 0.033 |
| L anterior cingulate | −11 | 16 | 43 | 85 | 3.61 | H > S > E | 0.658 |
| R frontal | 50 | 25 | 24 | 149 | 4.59 | H > S > E | 0.16 |
| R frontal | 43 | 30 | 28 | 237 | 5.07 | H > S > E | 0.9325 |
| L lateral parietal | −43 | −60 | 48 | 83 | 3.07 | H > S = E | 0.00059 |
| L lateral parietal | −47 | −48 | 49 | 228 | 5.19 | H > S = E | 0.000198 |
| L precentral gyrus | −44 | 3 | 35 | 447 | 7.29 | H > S = E | 0.000119 |
| L frontal | −46 | 32 | 20 | 178 | 5.38 | H > S = E | 0.0215 |
| L frontal | −39 | 10 | 48 | 46 | 3.02 | H > S = E | 0.334 |
| L frontal | −43 | 20 | 28 | 278 | 5.33 | H > S = E | 0.374 |
| R occipital | 19 | −97 | 0 | 66 | 4.47 | S > H > E | 0.617 |
Note: Regions are ordered in the list by pattern of pair type by timecourse effects. Three-way interaction refers to the pair type by stimulus type by timecourse interaction; these regions differ by stimulus type as to whether they show hard/same/easy effects. Those regions showing significant pair type by stimulus type by timecourse interactions are detailed in Table 5. The left OT region depicted in Figure 6 is shown in the top line. L, left; R, right; H, hard (2-different); E, easy (4-different); S, same.
However, the more informative analysis for determining whether the “groupability” of the stimuli seen in RT is reflected in the BOLD activity is the search for a pair type by stimulus type interaction. In other words, for a region processing visual stimuli in “groups” to be useful in reading, it only needs to be able to “group” stimuli that look like words, as seen in the RT pair type by stimulus type interaction. BOLD activity in such a region should show the same pair type by stimulus type interaction as the RTs, where there is less activity for processing the easy/all-different and same pairs than the hard pairs in “groupable” stimuli (words and pseudowords) and more activity for the same pairs relative to hard relative to easy pairs in ungroupable stimuli (Amharic characters and consonant strings), as described above. A 3 (pair type: easy vs. hard vs. same) by 5 (stimulus type: Amharic strings vs. consonant strings vs. nonwords vs. pseudowords vs. words) by 7 (timepoints) repeated measures ANOVA performed on all of the regions identified from the pair type by timecourse analysis revealed about half of the pair type by timecourse regions showing an additional interaction with stimulus type (the full report of which can be found in Table 5). Here, the focus will be on the left OT region shown in Figure 7, which in addition to the region defining pair type by timecourse effect also had a significant pair type by stimulus type by timecourse effect.
Table 5.
Regions showing a pair type by stimulus type by timecourse interaction
| Anatomical location | MNI coordinates | 3-Way interaction P value | Amharic | Consonant | Nonwords | Pseudowords | Words | ||
| x | y | z | |||||||
| L fusiform | −44 | −67 | −4 | 0.0013 | H = S > E | S > H > E | ns | H > S = E | H > S = E |
| R fusiform | 41 | −84 | 10 | 0.022 | S > H = E | S > H > E | ns | ns | H = S > E |
| R parietal | 33 | −58 | 53 | 0.00149 | H = S > E | H = S > E | H = S > E | H > S = E | H > S > E |
| L occipital | −30 | −93 | 19 | 0.034 | S > E | S > H > E | ns | H > S = E | H > E |
| L parietal | −28 | −62 | 50 | 0.0000449 | H > E = S | ns | H > S > E | H > S = E | H > S = E |
| Anterior cingulate | −3 | 15 | 52 | 0.021 | H = S > E | H = S > E | H = S > E | H > S = E | H > E |
| R precentral gyrus | 42 | 6 | 33 | 0.033 | H = S > E | H > S > E | ns | H > S = E | H = S > E |
| L lateral parietal | −43 | −60 | 48 | 0.00059 | H = S > E | ns | ns | H > E = S | H > S > E |
| L lateral parietal | −47 | −48 | 49 | 0.000198 | H = E > S | H = E > S | H > S > E | H > E = S | H > E = S |
| L precentral gyrus | −44 | 3 | 35 | 0.000119 | ns | H = S > E | H > S = E | H > S = E | H > S > E |
| L frontal | −46 | 32 | 20 | 0.0215 | ns | ns | ns | H > S = E | H > S = E |
Note: All regions from the pair type by timecourse analysis showing a 3-way pair type by stimulus type by timecourse interaction. The pattern of statistically significant effects is shown for each stimulus type. The left OT region detailed in Figure 7 is shown in the top row. L, left; R, right; S, same pairs; H, hard/2-character different pairs; E, easy/4-character different pairs; ns, nonsignificant.
In the left OT region identified as showing a pair type by stimulus type by timecourse interaction, the timecourses generally followed the pattern seen in the RTs. When subjects made a matching decision on “ungroupable” stimulus pairs (consonant and Amharic character strings), the left OT region showed a pattern of activity consistent with letter-by-letter (or character-by-character) processing (exemplified in Fig. 8D). When matching consonant strings, subjects showed the least activity when shown easy pairs, somewhat more activity for the hard pairs, and even more activity for identical pairs (Fig. 8E). Subjects matching Amharic character strings showed less activity for the easy pairs than for both the hard and identical pairs, which produced equivalent activity (Fig. 8F). As with RT, the magnitude of activity increased relative to the average number of characters that must be studied to make a same/different judgment for the consonant and Amharic character strings, suggesting that the subjects were looking at each letter (character) position sequentially.
Figure 8.

Difficulty by stimulus type by timecourse interactions in the left OT region. The left OT fusiform region (−44, −67, −4, MNI) was identified in the whole-brain pair type by timecourse analysis and shown in Figure 7. Note that all imaging effects in this region remain significant even when RT is regressed out. (A) Depiction of significant pair type by timecourse BOLD interaction for “groupable” strings (words and pseudowords). (B) BOLD group-average timecourses for the 3 pair types of words: hard > easy = same pairs. (C) BOLD group-average timecourses for the 3 pair types of pseudowords: hard > easy = same pairs. (D) Depiction of significant pair type by timecourse BOLD interaction for “ungroupable” stimuli (consonant strings and Amharic character strings). (E) BOLD group-average timecourses for the 3 pair types of consonant strings: same > hard > easy pairs. (F) BOLD group-average timecourses for the 3 pair types of Amharic character strings: same = hard > easy pairs.
In contrast, when viewing ”groupable” stimulus pairs (words and pseudowords, Fig. 8A), the left OT region showed more activity for the hard decision than for the easy and identical decisions, which produced equivalent activity (Fig. 8B,C). The similar BOLD response to completely identical and completely different pairs suggests that subjects did not need to look through each position to ensure the 2 letter strings were identical. The lower level of processing needed to make a correct “same” judgment indicates an ability to process these visual forms as a group. Again, the increased activity for the hard pairs likely reflects activation of partially overlapping representations due to the shared letters in the pairs, which takes increased processing to resolve.
To ensure the imaging results did not arise simply from RT differences, which in this case did mimic the BOLD data, we performed the same repeated measures ANOVAs but included RT as a trialwise regressor (as described in Methods). The pair type by stimulus type by timecourse interaction remained significant in the described OT region (P < 0.05, corrected for multiple comparisons) with RT regressed out. The pattern of hard > easy = same BOLD activity also remained significant for both words and pseudowords with RT regressed out, as did the same > hard > easy pattern for consonant strings and the same = hard > easy pattern for Amharic strings.
ROI-based analysis
A qualitatively similar pattern of BOLD activity (but without statistical significance) was seen in a spherical region centered on the classic pVWFA coordinates (see Fig. 9) that is 13 mm Euclidean distance from the region identified in the voxelwise analysis (Figs 7 and 8). In the case of the “ungroupable” stimuli, the largest change in BOLD activity was elicited for the same pairs (in which all characters need to be compared to make a decision), indicating each character was likely processed individually, while for the “groupable” stimuli, there was the least BOLD activity for the same pairs, indicating the group of letters was likely processed as a whole.
Figure 9.

Pair type timecourses in the classic pVWFA. “Ungroupable” stimuli show timecourses that qualitatively indicating character-by-character processing. Stimulus pairs that are all different produce the least amount of activity and pairs that are the same produce the most. “Groupable” stimuli show timecourses that qualitatively indicate they are processed as a whole, in which identical pairs show the least amount of activity.
Overlap of Interactions
If there is a region particularly adaptable for reading due to its processing of visually complex stimuli in groups, that region should demonstrate all of the previously described interactions: stimulus type by timecourse, complexity by timecourse, and pair type by timecourse interactions (following the grouping pattern). Using a conjunction analysis (as described in Analysis 2 Methods), we found only one region showing all 3 effects (Fig. 10). This region (−41, −66, −4 in MNI coordinates) was centered very near the left OT region described in the previous sections (2.25 and 3.17 mm Euclidean distance from the complexity by timecourse and pair type by timecourse regions, respectively), though 13 mm Euclidean distance from the classic pVWFA (Cohen et al. 2004), and also showed the aforementioned pair type by stimulus type by timecourse interaction.
Figure 10.

A single left OT region shows all previously described interactions. Location of the OT region (−41, −66, −4, MNI) showing all 3 (stimulus type by timecourse, complexity by timecourse, and pair type by timecourse) interactions. Voxels showing a significant interaction in all 3 ANOVAs are shown in red in both a transverse slice through fusiform cortex (left panel) and projected to the surface of a semi-inflated CARET surface (right panel). This region also had a significant pair type by stimulus type by timecourse interaction.
Discussion
We hypothesized that a visual processing region useful for reading (such as the pVWFA) would process visually complex stimuli in groups. A whole-brain analysis of the effect of visual complexity revealed a region in the left OT cortex showing more activity for our most visually complex stimuli relative to our least complex stimuli. A whole-brain analysis of pair type found a similarly located left OT region that also showed a pair type by stimulus type by timecourse interaction. This interaction was driven by differences in “grouping,” whereby stimuli following the rules and statistical regularities of real words (words and pseudowords) showed RTs and BOLD activity indicative of “grouped processing,” while stimuli that did not follow these rules and regularities (consonant and Amharic strings) showed RTs and BOLD activity indicative of character-by-character processing. The location of the complexity by timecourse, pair type by timecourse, and pair type by stimulus type by timecourse effects, as well as the stimulus type by timecourse effect described in Analysis 1, were colocalized to a single region in left OT cortex.
Location of the pVWFA
As mentioned above, the various effects seen in the present study were all colocalized to a single region of OT cortex centered on −41, −66, −4 (MNI coordinates). However, while this region, like the pVWFA is in the left OT cortex, it is about 13 mm Euclidean distance form the classic Cohen and Dehaene (2004) VWFA region when both regions are considered in the same atlas space.
Our conjunction analysis–derived region is closer to regions defined by cue-related activity (about 7 mm Euclidean distance from a meta-analytically defined region found at −45, −71, −1 MNI coordinates in Carter et al. 2010) in spatial cueing tasks (see Corbetta and Shulman 2002 for a review) and activity in visual search–related tasks (Leonards et al. 2000; Egner et al. 2008; Fairhall et al. 2009). These regions, while often reported as being near the middle temporal region (MT+ in humans), are consistently inferior to MT+ regions found in motion localizer tasks (i.e., −38, −60, 8 in MNI coordinates [Sarkheil et al. 2008]; −47, −79, 8 converted to MNI coordinates [Tootell et al. 1995]; −43, −72, 5 converted to MNI coordinates [Zacks et al. 2006]).
While our statistically defined region and the pVWFA are not an exact match, there are several indications that they are highly related. First, we have shown qualitatively similar results for all analyses described in a spherical region surrounding the “classic” pVWFA coordinates. Second, previous results from our group show resting-state functional connectivity magnetic resonance imaging (rs-fcMRI) correlations between a meta-analytically defined pVWFA region (−45, −62, −8 in MNI coordinates, 6.7 mm from the classically described pVWFA) and regions of the dorsal attention network but not reading-related regions (Vogel et al. 2011). Such results support the hypothesis that the pVWFA itself may be involved in “grouped” processing of visual stimuli, in general, rather than word and reading-related processing, in particular.
Finally, recent rs-fcMRI–defined community detection schemes indicate these regions are likely to be highly similar (Power et al. forthcoming; Yeo et al. 2010). These schemes have attempted to divide the whole of cerebral cortex into functional communities on a voxelwise basis, using similarities and differences in rs-fcMRI correlation to group the voxels into units. These rs-fcMRI–based divisions indicate there is a strip of OT cortex extending into fusiform cortex that is identified as belonging to a single community (Power et al. forthcoming). This strip of OT cortex encompasses the cue-related region described in the discussion above, the analytically defined region described in this paper, and the classically described pVWFA. The OT strip is part of a larger community of voxels that seems to overlap with the dorsal attention network (Power et al. forthcoming; Yeo et al. 2010), consistent with our results focused on the pVWFA alone (Vogel et al. 2011).
Despite this evidence, there is still the possibility that the region identified by the present analysis is not equivalent to the pVWFA and is functionally more similar to the other regions described above or distinct from both regions. Therefore, we will refer to our analytically defined region simply as “left OT cortex” throughout the remainder of the paper. Still, the relationship between these 3 regions should be studied further. Given the differences in tasks used for region definition, lack of clear coordinate locations in some studies, and differences in data acquisition properties and atlas transformations, we do not believe simply applying our described statistical tests to regions centered on literature-based VWFA and cue region coordinates, as done in this paper, is satisfactory. We anticipate that more specific methods of region definition, such as the combination of resting-state functional connectivity and functional-based region definition described in Nelson et al. (2010) and partly based on methods described in Cohen et al. (2008), or individual subject functional and anatomical localizers as described in Baker et al. (2007) will prove helpful in adjudicating whether regions from different studies and/or tasks converge anatomically.
The Effect of Complexity in Left OT Cortex
Our finding of increased activity in the left OT cortex for stimuli with increased visual complexity could explain some discrepant results in the pVWFA literature. For example, while some investigators show more activity for letters than digits (e.g., Polk et al. 2002) in regions near the pVWFA, digits tend to be less visually complex as measured by the brushstrokes/character criteria (Changizi and Shimojo 2005). Also, many line-drawn pictures are more visually complex than letters (on this metric), possibly resulting in increased BOLD activity for pictures relative to letter strings.
“Grouped” Processing in Left OT Cortex
The finding that a region in left OT cortex is related to “grouping” of word-like stimuli was expected. As described in the Introduction, acquired alexia, potentially caused by lesions to the left OT cortex or to its connections to parietal cortex, is characterized by the inability to read words as a “whole” (Cohen et al. 2003; Gaillard et al. 2006), and at least some alexics show deficits in simultaneous processing of multiple stimuli (Starrfelt et al. 2009). Also, Schurz et al. (2010) demonstrated the left fusiform cortex is responsive to both whole words and smaller segments of pseudowords.
Moreover, the conceptualization of the left OT cortex as able to process many types of stimuli in variably sized “groups” is consistent with recent data regarding the functional connectivity of the pVWFA. As mentioned earlier, a rs-fcMRI analysis by our group found the pVWFA has the strongest rs-fcMRI correlations with regions of the dorsal attention network, not regions typically thought to be involved in reading (Vogel et al. 2011). If the left OT cortex (possibly including the pVWFA) processes stimuli in variably sized groups, these rs-fcMRI connections may be due to the need to direct attention to the appropriate “group” of features as dorsal attention regions are thought to be involved in the allocation of spatial and feature-based attention. Wang et al. (2011) also found similar correlations between the pVWFA and parietal regions of the dorsal attention network during an active task.
High-Contrast High-Frequency Visual Processing in Left OT Cortex
Unfortunately, we were unable to test directly the responsiveness of the left OT cortex to high–spatial frequency high-contrast stimuli as all of our stimuli possessed these properties. However, previous results (Kveraga et al. 2007) show that left fusiform cortex is more responsive to line-drawn objects filtered to retain only high–spatial frequency information relative to those filtered to retain low–spatial frequency information. Additionally, Woodhead et al. (2011) recently demonstrated that left fusiform cortex is significantly more responsive to high–spatial frequency gratings than low–spatial frequency gratings. These findings are in keeping with work demonstrating that typical readers will have RTs indicating letter-by-letter reading when words are high-pass filtered and only low–spatial frequency information remains (Fiset et al. 2006).
General Discussion
The results presented here are by and large inconsistent with the notion that the left OT cortex in general, and the pVWFA in particular, processes words or letters exclusively or even preferentially (as defined by the presence of more activity for words and letters over similar stimuli, described in the Introduction). However, the results presented here do more than argue against ascribing the pVWFA a dominant use in reading. They also provide proscriptive information; Analysis 2 directly tested several properties that should be characteristic of a visual processor useful for reading, specifically the ability to process visually complex stimuli in groups. A region that seems to show these 2 properties—increased activity for more visually complex stimuli and activity reflective of grouped processing for stimuli following the rules and statistical regularities of real words—was found in left OT cortex. Thus, we not only argue against portraying the pVWFA as a skill-specific region but also hope to inform the understanding of the type of processing actually done in left OT cortex, including its contribution to reading.
With the motive of better understanding the type of information processing relevant to reading that is performed in the left OT cortex, likely including the pVWFA, we will describe how our results may be implemented on an information processing level. We hypothesize that neuronal populations in left OT cortex are generally responsive to complex high–spatial frequency stimuli. Letters and words are the most frequently encountered complex high–spatial frequency stimuli. As such, letters, groups of letters, and even words may come to be represented by populations of neurons due to individuals’ extensive experience with these stimuli (similar to the process hypothesized by Cohen and Dehaene 2004; Dehaene and Cohen 2007). However, as some populations become “tuned” to stimuli with the statistical regularities of words, the overall population of neurons in the left OT cortex does not lose its ability to engage with and process other similar visual stimuli and continues to be highly involved in such processing.
This conceptualization means we are not arguing against specialization for letters and words in left OT cortex in general or even the pVWFA in particular. Rather, we are arguing that the pVWFA may not be best conceived of as a “letter” or “word” area. Instead, we hypothesize that left OT cortex becomes useful for processing words and letters due to its information processing properties—properties also useful in processing many other types of stimuli.
If left OT cortex is conceived as such, we may be able to resolve several disputes in the literature. First, these results nicely account for the numerous reports of positive BOLD activity in and around the pVWFA region in response to nonletter and nonword stimuli (Tagamets et al. 2000; Bar et al. 2001; Price and Devlin 2003; Xue et al. 2006; Ben-Shachar et al. 2007; Ploran et al. 2007; Starrfelt and Gerlach 2007; Xue and Poldrack 2007; Mei et al. 2010; Van Doren et al. 2010). If, as we suggest, left OT cortex, possibly including the pVWFA, is a relatively general-use visual region that processes visually complex stimuli in groups during reading and other tasks, there should be activity in this region for pictures and other nonletter stimuli.
More importantly, the ability of left OT cortex to “group” stimuli, as demonstrated by the present results, may underlie reports of reduced activity for words relative to other visual items in this region. Specifically, the increased processing efficiency afforded by the ”grouped” processing may be driving the decreased activity for words relative to pseudowords (see Mechelli et al. 2003 for a review), as well as the negative relationship between word frequency and BOLD activity (Kronbichler et al. 2004; Church et al. 2011; Graves et al. 2010). Experience-dependent grouping could also account for the decreased activity for nonword stimuli seen after visual training (Xue et al. 2006). This “grouped” processing advantage may even be the basis for the preferential activity for words relative to consonant strings and false font stimuli observed exclusively at fast presentation times as such processing is presumably more efficient (see Analysis 1 Discussion). In this sense, the decreased activity seen for words and nonwords relative to nonletter stimuli does indicate a type of specialization. Yet, as mentioned previously, these results also indicate the ability to process stimuli with the statistical regularities of words does not supersede the ability of left OT cortex to process the individual components of a greater whole, hence the activity for false fonts and objects and the reported responsiveness to both whole words and smaller components (Schurz et al. 2010).
Conclusions
Using a visual matching task on pictures, strings of Amharic characters, and letter strings of varying levels of orthographic regularity, we have shown that left OT cortex is not predominantly used for reading as it shows equivalent or increased activity for visually similar nonletter stimuli relative to letter strings. Rather left OT cortex in general, including the pVWFA, likely performs more general visual processing that happens to be useful for reading. Our analyses indicate such properties include processing visually complex stimuli in groups. Direct tests indicate that a single region in left OT cortex demonstrates increased activity with increasing visual complexity and “grouped” processing of stimuli with the statistical regularities of real words but sequential processing of letter and letter-like stimuli very different from real words.
Funding
National Institutes of Health (NS0534425 and HD057076 to B.L.S., NS61144 and NS6144 to S.E.P.); National Science Foundation (IGERT 0548890 to A.C.V.).
Acknowledgments
The authors would like to thank Rebecca Coalson and Kelly McVey for their assistance in data collection and Fran Miezin for his technical assistance. We would also like to gratefully acknowledge Jessica Church, Katie Ihnen, and Joe Dubis for their careful reading and critiques of this manuscript. Conflict of Interest: None declared.
References
- Baker CI, Liu J, Wald LL, Kwong KK, Benner T, Kanwisher N. Visual word processing and experiential origins of functional selectivity in human extrastriate cortex. Proc Natl Acad Sci U S A. 2007;104:9087–9092. doi: 10.1073/pnas.0703300104. [DOI] [PMC free article] [PubMed] [Google Scholar]
- Bar M, Tootell RB, Schacter DL, Greve DN, Fischl B, Mendola JD, Rosen BR, Dale AM. Cortical mechanisms specific to explicit visual object recognition. Neuron. 2001;29:529–535. doi: 10.1016/s0896-6273(01)00224-0. [DOI] [PubMed] [Google Scholar]
- Behrmann M, Black SE, Bub D. The evolution of pure alexia: a longitudinal study of recovery. Brain Lang. 1990;39:405–427. doi: 10.1016/0093-934x(90)90148-a. [DOI] [PubMed] [Google Scholar]
- Behrmann M, Nelson J, Sekuler EB. Visual complexity in letter-by-letter reading: “pure” alexia is not pure. Neuropsychologia. 1998;36:1115–1132. doi: 10.1016/s0028-3932(98)00005-0. [DOI] [PubMed] [Google Scholar]
- Ben-Shachar M, Dougherty RF, Deutsch GK, Wandell BA. Differential sensitivity to words and shapes in ventral occipito-temporal cortex. Cereb Cortex. 2007;17:1604–1611. doi: 10.1093/cercor/bhl071. [DOI] [PubMed] [Google Scholar]
- Brem S, Bach S, Kucian K, Guttorm TK, Martin E, Lyytinen H, Brandeis D, Richardson U. Brain sensitivity to print emerges when children learn letter-speech sound correspondences. Proc Natl Acad Sci U S A. 2010;107:7939–7944. doi: 10.1073/pnas.0904402107. [DOI] [PMC free article] [PubMed] [Google Scholar]
- Brown TT, Lugar HM, Coalson RS, Miezin FM, Petersen SE, Schlaggar BL. Developmental changes in human cerebral functional organization for word generation. Cereb Cortex. 2005;15:275–290. doi: 10.1093/cercor/bhh129. [DOI] [PubMed] [Google Scholar]
- Bruno JL, Zumberge A, Manis FR, Lu ZL, Goldman JG. Sensitivity to orthographic familiarity in the occipito-temporal region. Neuroimage. 2008;39:1988–2001. doi: 10.1016/j.neuroimage.2007.10.044. [DOI] [PMC free article] [PubMed] [Google Scholar]
- Carter AR, Astafiev SV, Lang CE, Connor LT, Rengachary J, Strube MJ, Pope DL, Schulman GL, Corbetta M. (2010). Resting interhemispheric functional magnetic resonance imaging connectivity predicts performance after stroke. Anal of Neurol. 67(3):365–375. [DOI] [PMC free article] [PubMed]
- Changizi MA, Shimojo S. Character complexity and redundancy in writing systems over human history. Proc Biol Sci. 2005;272:267–275. doi: 10.1098/rspb.2004.2942. [DOI] [PMC free article] [PubMed] [Google Scholar]
- Church JA, Balota DA, Petersen SE, Schlaggar BL. Manipulation of length and lexicality localizes the functional neuroanatomy of phonological processing in adult readers. J Cogn Neurosci. 2011;23:1475–1493. doi: 10.1162/jocn.2010.21515. [DOI] [PMC free article] [PubMed] [Google Scholar]
- Church JA, Coalson RS, Lugar HM, Petersen SE, Schlaggar BL. A developmental fMRI study of reading and repetition reveals changes in phonological and visual mechanisms over age. Cereb Cortex. 2008;18:2054–2065. doi: 10.1093/cercor/bhm228. [DOI] [PMC free article] [PubMed] [Google Scholar]
- Cohen AL, Fair DA, Dosenbach NU, Miezin FM, Dierker D, Van Essen DC, Schlaggar BL, Petersen SE. Defining functional areas in individual human brains using resting functional connectivity MRI. Neuroimage. 2008;41:45–57. doi: 10.1016/j.neuroimage.2008.01.066. [DOI] [PMC free article] [PubMed] [Google Scholar]
- Cohen JD, MacWhinney B, Flatt M, Provost J. PsyScope: a new graphic interactive environment for designing psychology experiments. Behav Res Meth Ins C. 1993;25:257–271. [Google Scholar]
- Cohen L, Dehaene S. Specialization within the ventral stream: the case for the visual word form area. Neuroimage. 2004;22:466–476. doi: 10.1016/j.neuroimage.2003.12.049. [DOI] [PubMed] [Google Scholar]
- Cohen L, Lehericy S, Chochon F, Lemer C, Rivaud S, Dehaene S. Language-specific tuning of visual cortex? Functional properties of the Visual Word Form Area. Brain. 2002;125:1054–1069. doi: 10.1093/brain/awf094. [DOI] [PubMed] [Google Scholar]
- Cohen L, Martinaud O, Lemer C, Lehericy S, Samson Y, Obadia M, Slachevsky A, Dehaene S. Visual word recognition in the left and right hemispheres: anatomical and functional correlates of peripheral alexias. Cereb Cortex. 2003;13:1313–1333. doi: 10.1093/cercor/bhg079. [DOI] [PubMed] [Google Scholar]
- Corbetta M, Shulman G. Control of goal-directed and stimulus-driven attention in the brain. Nat Rev Neurosci. 2002;3:201–215. doi: 10.1038/nrn755. [DOI] [PubMed] [Google Scholar]
- Dehaene S, Cohen L. Cultural recycling of cortical maps. Neuron. 2007;56:384–398. doi: 10.1016/j.neuron.2007.10.004. [DOI] [PubMed] [Google Scholar]
- Dejerine J. Contribution a l'étude anatomoclinique et clinique des differentes varietes de cecite verbal. C R Hebd Séances Mém Soc Biol. 1892;4:61–90. [Google Scholar]
- Egner T, Monti JM, Trittschuh EH, Wieneke CA, Hirsch J, Mesulam MM. Neural integration of top-down spatial and feature-based information in visual search. J Neurosci. 2008;28:6141–6151. doi: 10.1523/JNEUROSCI.1262-08.2008. [DOI] [PMC free article] [PubMed] [Google Scholar]
- Evans AC, Marrett S, Neelin P, Collins L, Worsley K, Dai W, Milot S, Meyer E, Bub D. Anatomical mapping of functional activation in stereotactic space. Neuroimage. 1992;1:43–53. doi: 10.1016/1053-8119(92)90006-9. [DOI] [PubMed] [Google Scholar]
- Fairhall SL, Indovina I, Driver J, Macaluso E. The brain network underlying serial visual search: comparing overt and covert spatial orienting, for activations and for effective connectivity. Cereb Cortex. 2009;19:2946–2958. doi: 10.1093/cercor/bhp064. [DOI] [PubMed] [Google Scholar]
- Fiset D, Gosselin F, Blais C, Arguin M. Inducing letter-by-letter dyslexia in normal readers. J Cogn Neurosci. 2006;18:1466–1476. doi: 10.1162/jocn.2006.18.9.1466. [DOI] [PubMed] [Google Scholar]
- Forman SD, Cohen JD, Fitzgerald M, Eddy WF, Mintun MA, Noll DC. Improved assessment of significant activation in functional magnetic resonance imaging (fMRI): use of a cluster-size threshold. Magn Reson Med. 1995;33:636–647. doi: 10.1002/mrm.1910330508. [DOI] [PubMed] [Google Scholar]
- Friedman RB, Alexander MP. Pictures, images, and pure alexia: a case study. Cogn Neuropsychol. 1984;1:9–23. [Google Scholar]
- Gaillard R, Naccache L, Pinel P, Clemenceau S, Volle E, Hasboun D, Dupont S, Baulac M, Dehaene S, Adam C, et al. Direct intracranial, FMRI, and lesion evidence for the causal role of left inferotemporal cortex in reading. Neuron. 2006;50:191–204. doi: 10.1016/j.neuron.2006.03.031. [DOI] [PubMed] [Google Scholar]
- Graves WW, Desai R, Humphries C, Seidenberg MS, Binder JR. Neural systems for reading aloud: a multiparametric approach. Cereb Cortex. 2010;20:1799–1815. doi: 10.1093/cercor/bhp245. [DOI] [PMC free article] [PubMed] [Google Scholar]
- Hillis AE, Newhart M, Heidler J, Barker P, Herskovits E, Degaonkar M. The roles of the “visual word form area” in reading. Neuroimage. 2005;24:548–559. doi: 10.1016/j.neuroimage.2004.08.026. [DOI] [PubMed] [Google Scholar]
- Jobard G, Crivello F, Tzourio-Mazoyer N. Evaluation of the dual route theory of reading: a metanalysis of 35 neuroimaging studies. Neuroimage. 2003;20:693–712. doi: 10.1016/S1053-8119(03)00343-4. [DOI] [PubMed] [Google Scholar]
- Kherif F, Josse G, Price Cl. Automatic top-down processing explains common left occipito-temporal responses to visual words and objects. Cereb Cortex. 2011;21:103–114. doi: 10.1093/cercor/bhq063. [DOI] [PMC free article] [PubMed] [Google Scholar]
- Kronbichler M, Bergmann J, Hutzler F, Staffen W, Mair A, Ladurner G, Wimmer H. Taxi vs. taksi: on orthographic word recognition in the left ventral occipitotemporal cortex. J Cogn Neurosci. 2007;19:1584–1594. doi: 10.1162/jocn.2007.19.10.1584. [DOI] [PMC free article] [PubMed] [Google Scholar]
- Kronbichler M, Hutzler F, Wimmer H, Mair A, Staffen W, Ladurner G. The visual word form area and the frequency with which words are encountered: evidence from a parametric fMRI study. Neuroimage. 2004;21:946–953. doi: 10.1016/j.neuroimage.2003.10.021. [DOI] [PubMed] [Google Scholar]
- Kveraga K, Boshyan J, Bar M. Magnocellular projections as the trigger of top-down facilitation in recognition. J Neurosci. 2007;27:13232–13240. doi: 10.1523/JNEUROSCI.3481-07.2007. [DOI] [PMC free article] [PubMed] [Google Scholar]
- Lancaster JL, Glass TG, Lankipalli BR, Downs H, Mayberg H, Fox PT. A modality-independent approach to spatial normalization of tomographic images of the human brain. Hum Brain Mapp. 1995;3:209–223. [Google Scholar]
- Leonards U, Sunaert S, Van Hecke P, Orban GA. Attention mechanisms in visual search —an fMRI study. J Cogn Neurosci. 2000;12(Suppl 2):61–75. doi: 10.1162/089892900564073. [DOI] [PubMed] [Google Scholar]
- Livingstone MS, Hubel DH. Psychophysical evidence for separate channels for the perception of form, color, movement, and depth. J Neurosci. 1987;7:3416–3468. doi: 10.1523/JNEUROSCI.07-11-03416.1987. [DOI] [PMC free article] [PubMed] [Google Scholar]
- Livingstone MS, Hubel DH. Segregation of form, color, movement and depth: anatomy, physiology, and perception. Science. 1988;6:740–749. doi: 10.1126/science.3283936. [DOI] [PubMed] [Google Scholar]
- Maunsell JH, Newsome WT. Visual processing in monkey extrastriate cortex. Annu Rev Neurosci. 1987;10:363–401. doi: 10.1146/annurev.ne.10.030187.002051. [DOI] [PubMed] [Google Scholar]
- McAvoy MP, Ollinger JM, Buckner RL. Cluster size thresholds for assessment of significant activation in fMRI. Neuroimage. 2001;13:S198. [Google Scholar]
- McCandliss BD, Cohen L, Dehaene S. The visual word form area: expertise for reading in the fusiform gyrus. Trends Cogn Sci. 2003;7:293–299. doi: 10.1016/s1364-6613(03)00134-7. [DOI] [PubMed] [Google Scholar]
- Mechelli A, Gorno-Tempini ML, Price CJ. Neuroimaging studies of word and pseudoword reading: consistencies, inconsistencies, and limitations. J Cogn Neurosci. 2003;15:260–271. doi: 10.1162/089892903321208196. [DOI] [PubMed] [Google Scholar]
- Mei L, Xue G, Chen C, Xue F, Zhang M, Dong Q. The “visual word form area” is involved in successful memory encoding of both words and faces. Neuroimage. 2010;52:371–378. doi: 10.1016/j.neuroimage.2010.03.067. [DOI] [PMC free article] [PubMed] [Google Scholar]
- Miezin FM, Maccotta L, Ollinger JM, Petersen SE, Buckner RL. Characterizing the hemodynamic response: effects of presentation rate, sampling procedure, and the possibility of ordering brain activity based on relative timing. Neuroimage. 2000;11:735–759. doi: 10.1006/nimg.2000.0568. [DOI] [PubMed] [Google Scholar]
- Nelson SM, Cohen AL, Power JD, Wig GS, Miezin FM, Wheeler ME, Velanova K, Donaldson DI, Phillips JS, Schlaggar BL, et al. A parcellation scheme for human left lateral parietal cortex. Neuron. 2010;67:156–170. doi: 10.1016/j.neuron.2010.05.025. [DOI] [PMC free article] [PubMed] [Google Scholar]
- Ploran EJ, Nelson SM, Velanova K, Petersen SE, Wheeler ME. Evidence accumulation and the moment of recognition: dissociating perceptual recognition processes using fMRI. J Neurosci. 2007;27:11912–11924. doi: 10.1523/JNEUROSCI.3522-07.2007. [DOI] [PMC free article] [PubMed] [Google Scholar]
- Polk TA, Stallcup M, Aguirre GK, Alsop DC, D'Esposito M, Detre JA, Farah MJ. Neural specialization for letter recognition. J Cogn Neurosci. 2002;14:145–159. doi: 10.1162/089892902317236803. [DOI] [PubMed] [Google Scholar]
- Power JD, Cohen AL, Nelson SM, Wig GS, Barnes KA, Church JA, Vogel AC, Laumann TO, Miezin FM, Schlaggar BL, et al. (2011). Functional network organization of the human brain. Neuron, 72(4): 665–678. [DOI] [PMC free article] [PubMed]
- Price CJ, Devlin JT. The myth of the visual word form area. Neuroimage. 2003;19:473–481. doi: 10.1016/s1053-8119(03)00084-3. [DOI] [PubMed] [Google Scholar]
- Sarkheil P, Vuong QC, Bulthoff HH, Noppeney U. The integration of higher order form and motion by the human brain. Neuroimage. 2008;42:1529–1536. doi: 10.1016/j.neuroimage.2008.04.265. [DOI] [PubMed] [Google Scholar]
- Schlaggar BL, Brown TT, Lugar H, Visscher KM, Miezin FM, Petersen SE. 2002. Functional neuroanatomical differences between adults and school-age children in the processing of single words. Science. 296:1476–1479. [DOI] [PubMed]
- Schlaggar BL, McCandliss BD. Development of neural systems for reading. Annu Rev Neurosci. 2007;30:475–503. doi: 10.1146/annurev.neuro.28.061604.135645. [DOI] [PubMed] [Google Scholar]
- Schurz M, Sturm D, Richlan F, Kronbichler M, Ladurner G, Wimmer H. A dual-route perspective on brain activation in response to visual words: evidence for a length by lexicality interaction in the visual word form area (VWFA) Neuroimage. 2010;49:2649–2661. doi: 10.1016/j.neuroimage.2009.10.082. [DOI] [PMC free article] [PubMed] [Google Scholar]
- Snodgrass JG, Vanderwart M. A standardized set of 260 pictures: norms for name agreement, image agreement, familiarity, and visual complexity. J Exp Psychol Hum Learn. 1980;6:174–215. doi: 10.1037//0278-7393.6.2.174. [DOI] [PubMed] [Google Scholar]
- Snyder AZ. Difference image vs. ratio image error function forms in PET-PET realignment. In: Myer R, Cunningham VJ, Bailey DL, Jones T, editors. Quantification of brain function using PET. San Diego, CA: Academic Press; 1996. pp. 131–137. [Google Scholar]
- Stanovich KE. Matthew effects in reading: some consequences of individual differences in the acquisition of literacy. Read Res Quart. 1986;21:360–406. [Google Scholar]
- Starrfelt R, Gerlach C. The visual what for area: words and pictures in the left fusiform gyrus. Neuroimage. 2007;35:334–342. doi: 10.1016/j.neuroimage.2006.12.003. [DOI] [PubMed] [Google Scholar]
- Starrfelt R, Habekost T, Leff AP. Too little, too late: reduced visual span and speed characterize pure alexia. Cereb Cortex. 2009;19:2880–2890. doi: 10.1093/cercor/bhp059. [DOI] [PMC free article] [PubMed] [Google Scholar]
- Tagamets MA, Novick JM, Chalmers ML, Friedman RB. A parametric approach to orthographic processing in the brain: an fMRI study. J Cogn Neurosci. 2000;12:281–297. doi: 10.1162/089892900562101. [DOI] [PubMed] [Google Scholar]
- Talairach J, Tournoux P. Co-planar stereotaxic atlas of the human brain. New York: Thieme Medical Publishers, Inc; 1988. [Google Scholar]
- Tootell RB, Reppas JB, Kwong KK, Malach R, Born RT, Brady TJ, Rosen BR, Belliveau JW. Functional analysis of human MT and related visual cortical areas using magnetic resonance imaging. J Neurosci. 1995;15:3215–3230. doi: 10.1523/JNEUROSCI.15-04-03215.1995. [DOI] [PMC free article] [PubMed] [Google Scholar]
- Turkeltaub PE, Eden GF, Jones KM, Zeffiro TA. Meta-analysis of the functional neuroanatomy of single-word reading: method and validation. Neuroimage. 2002;16:765–780. doi: 10.1006/nimg.2002.1131. [DOI] [PubMed] [Google Scholar]
- Van Doren L, Dupont P, De Grauwe S, Peeters R, Vandenberghe R. The amodal system for conscious word and picture identification in the absence of a semantic task. Neuroimage. 2010;49:3295–3307. doi: 10.1016/j.neuroimage.2009.12.005. [DOI] [PubMed] [Google Scholar]
- Van Essen DC, Dickson J, Harwell J, Hanlon D, Anderson CH, Drury HA. An integrated software suite for surface-based analyses of cerebral cortex. J Am Med Inform Assoc. 2001;41:1359–1378. doi: 10.1136/jamia.2001.0080443. See also http://brainmap.wustl.edu/caret. [DOI] [PMC free article] [PubMed] [Google Scholar]
- Vigneau M, Beaucousin V, Herve PY, Duffau H, Crivello F, Houde O, Mazoyer B, Tzourio-Mazoyer N. Meta-analyzing left hemisphere language areas: phonology, semantics, and sentence processing. Neuroimage. 2006;30:1414–1432. doi: 10.1016/j.neuroimage.2005.11.002. [DOI] [PubMed] [Google Scholar]
- Vinckier F, Dehaene S, Jobert A, Dubus JP, Sigman M, Cohen L. Hierarchical coding of letter strings in the ventral stream: dissecting the inner organization of the visual word-form system. Neuron. 2007;55:143–156. doi: 10.1016/j.neuron.2007.05.031. [DOI] [PubMed] [Google Scholar]
- Vogel AC, Miezin FM, Petersen SE, Schlaggar BL. The putative visual word form area is functionally connected to the dorsal attention network. Cereb Cortex. 2011 doi: 10.1093/cercor/bhr100. (epub ahead of print). [DOI] [PMC free article] [PubMed] [Google Scholar]
- Wang X, Yang J, Shu H, Zevin JD. Left fusiform BOLD responses are inversely related to word-likeness in a one-back task. Neuroimage. 2011;55:1346–1356. doi: 10.1016/j.neuroimage.2010.12.062. [DOI] [PMC free article] [PubMed] [Google Scholar]
- Warrington ET, Shallice T. Word form dyslexia. Brain. 1980;103:99–112. doi: 10.1093/brain/103.1.99. [DOI] [PubMed] [Google Scholar]
- Wechsler D. Wechsler Abbreviated Scale of Intelligence. San Antonio, TX: The Psychological Corporation; 1999. [Google Scholar]
- Weekes BS. Differential effects of number of letters on word and nonword naming latency. Q J Exp Psychol A. 1997;50:439–456. [Google Scholar]
- Woodcock RW, Johnson MB. Woodcock-Johnson-Revised Tests of Achievement. Itasca, IL: Riverside Publishing; 2002. [Google Scholar]
- Woodhead ZV, Wise RJ, Serano M, Leech R. Dissociation of sensitivity to spatial frequency in word and face preferential areas of the fusiform cortex. Cereb Cortex. 2011;21:2307–2312. doi: 10.1093/cercor/bhr008. [DOI] [PMC free article] [PubMed] [Google Scholar]
- Xue G, Chen C, Jin Z, Dong Q. Language experience shapes fusiform activation when processing a logographic artificial language: an fMRI training study. Neuroimage. 2006;31:1315–1326. doi: 10.1016/j.neuroimage.2005.11.055. [DOI] [PubMed] [Google Scholar]
- Xue G, Poldrack RA. The neural substrates of visual perceptual learning of words: implications for the visual word form area hypothesis. J Cogn Neurosci. 2007;19:1643–1655. doi: 10.1162/jocn.2007.19.10.1643. [DOI] [PubMed] [Google Scholar]
- Yeo B, Sepulchre JR, Sabuncu MR, Lashkari D, Roffman J, Smoller JW, Fischl B, Liu H, Buckner RL. Estimates of surface-based cortical networks using intrinsic functional connectivity from 1000 subjects. San Diego, CA: Society for Neuroscience; 2010. [Google Scholar]
- Zacks JM, Swallow KM, Vettel JM, McAvoy MP. Visual motion and the neural correlates of event perception. Brain Res. 2006;1076:150–162. doi: 10.1016/j.brainres.2005.12.122. [DOI] [PubMed] [Google Scholar]