Abstract
Convoluted cortical folding and neuronal wiring are 2 prominent attributes of the mammalian brain. However, the macroscale intrinsic relationship between these 2 general cross-species attributes, as well as the underlying principles that sculpt the architecture of the cerebral cortex, remains unclear. Here, we show that the axonal fibers connected to gyri are significantly denser than those connected to sulci. In human, chimpanzee, and macaque brains, a dominant fraction of axonal fibers were found to be connected to the gyri. This finding has been replicated in a range of mammalian brains via diffusion tensor imaging and high–angular resolution diffusion imaging. These results may have shed some lights on fundamental mechanisms for development and organization of the cerebral cortex, suggesting that axonal pushing is a mechanism of cortical folding.
Keywords: cortical folding, diffusion tensor imaging, shape analysis
Introduction
Neuroscience research has demonstrated that the neural structures of gyri and sulci emerge from complex cortical folding processes during development (Rakic 1988). Among many factors (Barron 1950; Rakic 1988; Welker 1990; Sur and Rubenstein 2005) that play important roles in complex cortical folding, the axonal wiring process is believed to be a critical determinant (O’Leary 1989; Van Essen 1997). Therefore, at the conceptual level, it is reasonable to postulate that there is a close relationship between cortical folding and axonal wiring. However, due to a lack of joint and quantitative mapping between axonal wiring patterns and gyral and sulcal formations, the underlying mechanisms guiding these processes remain unclear. In this paper, based on quantitative analysis of macroscale neuroimaging data and microscale microscopic bioimaging data, we present a novel axonal pushing theory of cortical folding.
Thanks to recent technical developments, diffusion tensor imaging (DTI) is now able to quantitatively map axonal fiber connections (Mori 2006), and DTI-derived fiber tracts are well correlated with axon densities (Mori et al. 1999; Stieltjes et al. 2001). In this paper, we acquired in vivo DTI data in order to quantitatively map the axons connected to the cerebral cortices in humans, chimpanzees, and macaque monkeys and applied in-house software tools (Liu et al. 2007, 2008) to reconstruct geometric representations of these primate cortices from the DTI data. By applying a joint analysis that considers DTI-derived fiber connection patterns within a neuroanatomic context of cortical folds (Li et al. 2010), we are able to quantify the folding patterns and fiber connection properties within the same structural substrate of a local cortical surface patch. Therefore, we quantitatively characterized the relationship between axonal connection patterns and gyral and sulcal patterns in order to elucidate the intrinsic relationships between axonal wiring and cortical folding. Results indicated that a majority of axons were connected to the gyri in human, chimpanzee, and macaque monkey cortices. This finding was further replicated and validated via high–angular resolution diffusion imaging (HARDI; Tuch et al. 2002), multiple tractography approaches, and multiple cortical surface reconstruction methods.
Inspired by the finding that a majority of axonal fibers are connected to gyral regions, we posited that cortical folding is induced and/or regulated by “pushing” of wiring axons. We tested our hypothesis by applying macroscale neuroimaging and microscale bioimaging. In particular, in addition to DTI and HARDI of primate brains, we performed time-lapse confocal microscopic imaging of actin filament (axon marker) dynamics of developing Drosophila “thoracic ganglia” (a central nervous system [CNS] structure), and it was found that axon density correlated positively with the morphogenesis of convex shapes of the thoracic ganglia. In addition, we measured the Young’s modulus (a measure of the stiffness of a material; Chou and Pagano 1992) of convex and concave regions of the growing Drosophila thoracic ganglia by time-lapse atomic force microscopy (AFM) under the contact mode and found that the Young’s modulus in convex regions is approximately 10 times that in concave regions and rapidly increases during development. These biomechanical data provide further support to our axonal pushing hypothesis. This work opens up a new angle for future exploration of the molecular and cellular underpinnings of cortical folding and the interactions among different cortical folding mechanisms.
Materials and Methods
DTI of Human Brains
In vivo DTI data were acquired in 2 separate groups (n = 9 and n = 15) of healthy young adults at The University of Georgia (GE 3T Signa MRI system) under Institutional Review Board approval (The imaging parameters were provided in Supplementary Material). These 2 separate groups of healthy adults were used for reproducibility study. Axonal fibers were reconstructed via the streamlined tractography method (Mori et al. 1999; Stieltjes et al. 2001), and geometric surface representations of cerebral cortices were reconstructed from brain tissue maps derived from the segmentation of DTI data (Liu et al. 2007). The cortical surfaces were further parcellated into gyral and sulcal regions, and fiber connection patterns were classified according to the gyri or sulci they connected. Fiber densities on gyri and sulci along with the percentage of fiber connection patterns were quantified in the primate brains.
DTI of Chimpanzee and Macaque Monkey Brains
In vivo DTI and structural magnetic resonance imaging (MRI) data were acquired on chimpanzees and macaque monkeys (n = 36 and n = 25, respectively) at Emory University (Siemens 3T Trio scanner) with Institutional Animal Care and Use Committee approval (The imaging parameters were provided in Supplementary Material). Prior to scanning, the subjects were immobilized with ketamine injections and were subsequently anesthetized with an intravenous propofol drip following standard veterinary procedures used at Emory University’s Yerkes National Primate Research Center. The subjects remained sedated for the duration of the scans as well as the time needed for transport between their home cage and the scanner location. Both anatomical and diffusion MRI scans were performed with a human knee coil. Preprocessing steps were similar to those used in the processing of human brain data sets.
HARDI of Human Brains
Full-brain coverage high angular resolution diffusion imaging (HARDI) images were acquired from adult subjects (n = 5) using a Siemens 3T Trio MR Scanner at UNC Chapel Hill. Scanning parameters were as follows: repetition time = 12 400 ms, echo time = 116 ms, diffusion weighting b = 2000 s/mm2, 120 noncollinear directions, flip angle = 90°, matrix = 128 × 128, field of view = 256 × 256 mm2, 80 slices, slice thickness = 2 mm. The software package MEDINRIA (http://www-sop.inria.fr/asclepios/software/MedINRIA) was used for preprocessing and analysis of this HARDI data set.
Time-lapse Confocal Microscopic Imaging of Drosophila
Unlike the primate brain, the rapid growth rate of the Drosophila CNS provides the opportunity to monitor the correlation between axon accumulation and Drosophila thoracic growth in vivo and to dynamically measure the mechanical properties of Young’s modulus on the thoracic surface. We performed time-lapse confocal microscopic imaging of actin filament (axon marker, stained by rhodamine-conjugated phalloidin) dynamics of the developing thoracic ganglia within a time window from 72 h AED (after egg deposition) to AEM (after adult emergence).
AFM of Drosophila
The Young’s modulus of convex and concave regions of the growing Drosophila thoracic ganglia was measured by AFM under the contact mode. With the aid of an optical microscope, the AFM probe was located directly above the interested position to measure the difference of Young’s modulus in convex and concave regions and to measure the dynamics of Young’s modulus in convex regions.
Results
Axonal Fiber Terminations Concentrate on Gyri in Human Brain
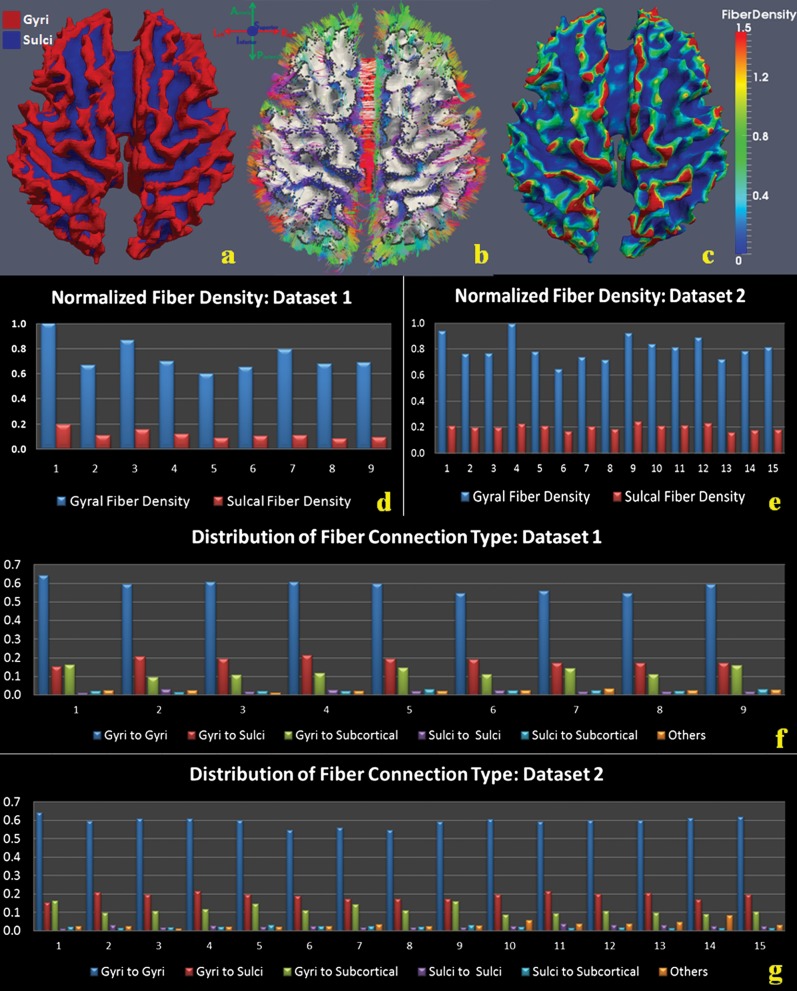
We analyzed 2 human brain DTI data sets (n = 15 and n = 9) and visualized the cortical surfaces and fiber connections. As demonstrated in Figure 1a,b, distributions of fiber ending points closely follow gyral folding patterns and concentrate on gyral regions (Fig. 1b). This observation is reproducible in all 24 cases of human brain DTI data we analyzed (additional cases shown in Supplementary Fig. 1). Quantitatively, we defined DTI-based axonal fiber density as the number of fibers per unit surface area and represented density through a color-coded scheme on the gyri and sulci (Fig. 1c). Fiber densities in gyral regions are much higher (red color) than those in sulcal regions (blue color). On average, in humans, the axonal fiber density in gyral regions is 5.2 times that in sulcal regions (Fig. 1d,e). Furthermore, we classified fiber connection patterns according to the type of regions they connect to (gyral, sulcal, or subcortical regions), yielding 6 patterns. The histograms of fiber connection patterns for the 24 subjects are presented in Figure 1f,g, which show that gyral–gyral connections are highly dominant. Quantitatively, the average percentages of gyral–gyral, gyral–sulcal, sulcal–sulcal, gyral–subcortical, and sulcal–subcortical connections are 61.2%, 19.2%, 2.9%, 11.1%, and 1.7%, respectively.
Figure 1.
Axonal fiber ends closely follow cortical gyral folding patterns, and gyral regions have significantly higher fiber density in human brains. (a) Segmentation of cortical surface into gyri (red) and sulci (blue). (b) Joint visualization of axonal fibers and cortical surface in the same DTI image space. Directions of axonal fibers are color coded by the bar on the top left. (c) Fiber density mapped on the cortical surface. Red and blue mean high and low fiber density, respectively. The color bar is on the right. (d) Differences of fiber density in gyral and sulcal regions in the first data set of 9 subjects. The horizontal axis is the index of subjects, and vertical axis represents normalized fiber density. (e) Differences of fiber density on gyral and sulcal regions in the second data set of 15 subjects. Annotations are the same as (d). (f) Histograms of fiber connection patterns for 9 cases in the first data set. Five types are shown here: gyri–gyri, sulci–sulci, gyri–sulci, gyri–subcortical, and sulci–subcortical. Fibers that are not in these 5 types, for example, subcortical–subcortical, are labeled as others. (g) Histograms of fiber connection patterns for 15 cases in the second data set.
Axonal Fiber Terminations Concentrate on Gyri in Chimpanzee and Macaque Brains
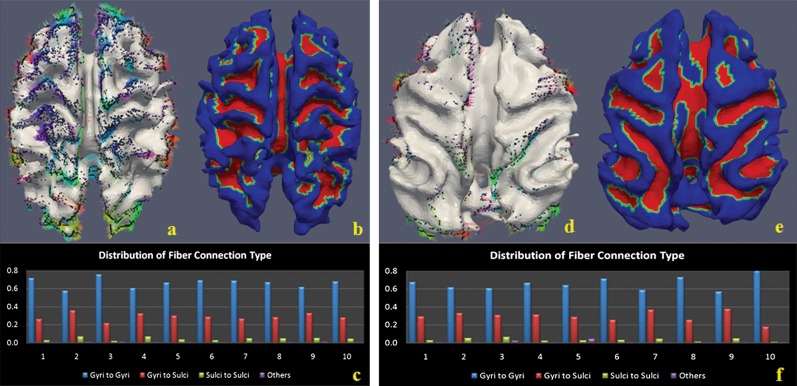
We performed DTI-based analysis of axonal connection patterns and cortical shapes in chimpanzee and macaque brains. Figures 2a–c and 2d–f show the results for chimpanzee and macaque brains, respectively. It is evident in Figure 2a,d that axonal fiber densities in gyral regions are much higher than those in sulcal regions, and this result was consistent in all 20 primate brains we studied (additional results in Supplementary Figs 2 and 3), replicating our findings in the human brain. Histograms of fiber connection patterns presented in Figure 2c,f show that gyral–gyral fibers are the most dominant. Quantitatively, the average percentages of gyral–gyral, gyral–sulcal, and sulcal–sulcal connections are 67.2%, 28.4%, and 3.8% in chimpanzee brains and 66.1%, 29.5%, and 0.9% in macaque brains, respectively. These results replicate our findings in Figure 1 in the human brain. In addition to primate cerebral cortex, we examined the cerebellum of the mouse brain using diffusion tensor microimaging data (45 micron per pixel isotropic; Zhang et al. 2003). Supplementary Figure 4 demonstrates that fiber end points concentrate in gyral regions, instead of sulcal regions, in the mouse cerebellum. This result suggests that the explanatory power of our finding and axonal pushing hypothesis is not limited to the cerebral cortex.
Figure 2.
Axonal fiber ends closely follow cortical gyral folding patterns, and gyral regions have significantly higher fiber density in chimpanzee and macaque brains. (a–c) chimpanzee brain; (d–f) macaque monkey brain. (a) Joint visualization of axonal fibers and cortical surface of chimpanzee brain in the same DTI image space. Colored dots are the intersection points between axonal fibers and cortical surface mesh. Color bar is the same as the one in Figure 1b. (b) Parcellation of cortical surface into gyri (red) and sulci (blue). (c) Histograms of fiber connection patterns in 10 chimpanzee brains. Four patterns are considered here. (d) Joint visualization of axonal fibers and cortical surface of monkey brain in the same DTI image space. It is evident that there are significantly less fibers in monkey brain in comparison with human and chimpanzee brains. (e) Parcellation of cortical surface into gyri (red) and sulci (blue). (f) Histograms of fiber connection patterns in 10 macaque monkey brains.
Reproducible Results via HARDI
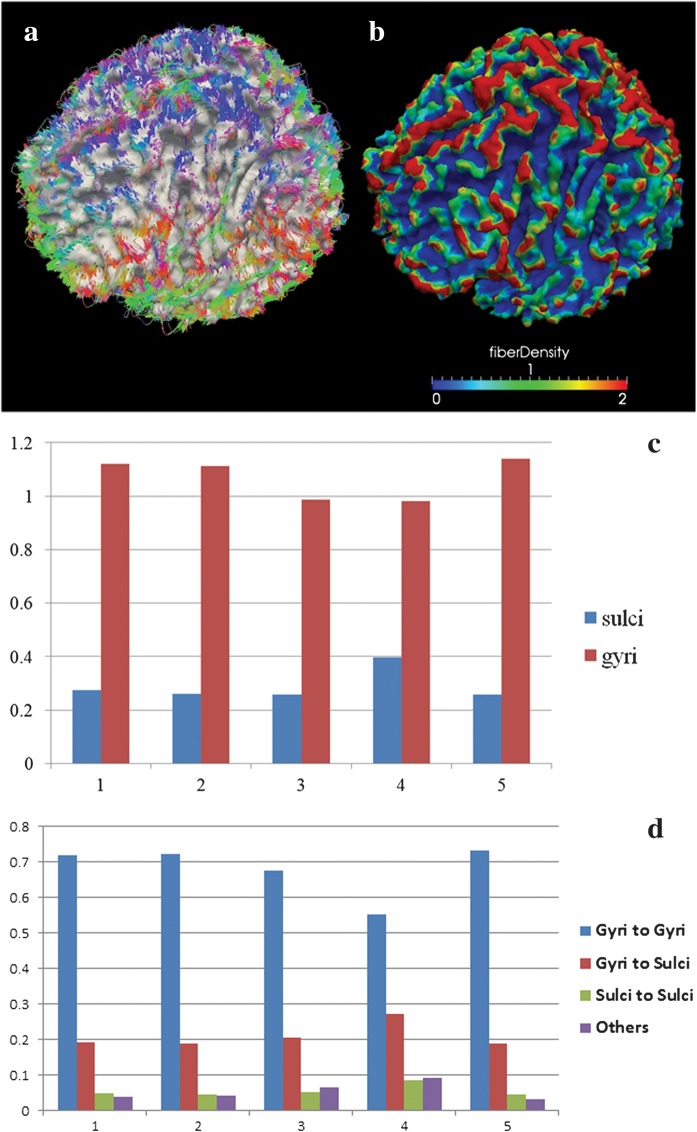
We performed similar cortical surface reconstruction and fiber density mapping for the HARDI data set. As shown in Figure 3a,b, the HARDI results, again, show that fiber densities in gyral regions are significantly higher than those in sulcal regions. Quantitatively, the average axonal fiber density in gyral regions is 3.8 times that in sulcal regions, as shown in Figure 3c. In particular, the average percentages of gyral–gyral, gyral–sulcal, and sulcal–sulcal connections are 68.1%, 20.9%, and 5.5%, respectively, as detailed in Figure 3d. These results obtained from HARDI data further replicate our conclusion that a significant majority of axonal fibers concentrate on gyri. Visualizations of tracked fibers and mapped fiber densities on cortical surfaces for an additional group of 4 subjects are shown in Supplementary Figure 5.
Figure 3.
Axonal fiber ends closely follow cortical gyral folding patterns, and gyral regions have significantly higher fiber density in HARDI data set. (a) Fibers derived from HARDI tractography. The MEDINRIA was used for HARDI tractography. The colors of fibers encode their directions. (b) The fiber density is mapped on the cortical surface. The color bar of fiber density is at the bottom. Red and blue stand for high and low fiber density, respectively. (c) Differences of fiber density in gyral and sulcal regions in the HARDI data set of 5 subjects. The horizontal axis is the index of subjects, and vertical axis represents normalized fiber density. (d) Histograms of fiber connection patterns in 5 human brain HARDI data sets.
So far, our quantitative analyses in Figures 1–3 and Supplementary Figures 1–5 using 2 separate human brain DTI data sets, 1 chimpanzee brain DTI data set, 1 macaque brain DTI data set, and 1 human brain HARDI data set, as well as a mouse brain diffusion tensor microimaging data set, have demonstrated the same finding: A dominant percentage of axonal fibers terminate in gyral regions in the mammalian brain. This finding derived from in vivo neuroimaging data will be further evaluated and validated in the following sections via comparisons of tractography approaches and comparisons of cortical surface reconstruction methods.
Comparison of DTI Tractography Approaches
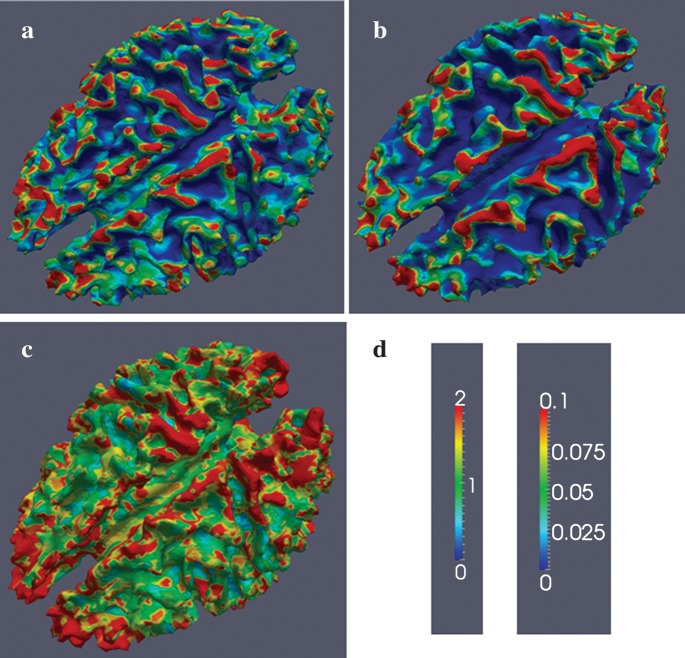
Streamline tractography (Mori et al. 1999; Stieltjes et al. 2001) and stochastic tractography (Behrens et al. 2003) are among the most established and rigorously validated tractography approaches in the DTI literature. In order to evaluate the reproducibility and sensitivity of our findings to different DTI tractography approaches, we analyzed the DTI data of 1 subject using 2 streamline tractography methods (DTIStudio: https://www.mristudio.org/ and MEDINRIA: http://www-sop.inria.fr/asclepios/software/MedINRIA/) and 1 stochastic tractography method (FMRIB Software Library: http://www.fmrib.ox.ac.uk/fsl/) and compared the results obtained. Specifically, the fiber densities measured via streamline tractography methods and structural connection strength measured via stochastic tractography were mapped onto the same cortical surface. As illustrated in Figure 4, the same conclusion can be drawn from the results obtained from these 3 tractography methods: A dominant percentage of axonal fibers terminate on gyral regions, as reported in the previous sections. Also, it can be clearly seen that the 3 tractography approaches display strong structural connections across similar gyral regions. These results demonstrate that our DTI-derived findings in Figures 1 and 2 are not dependent on the tractography approaches used. These results further indicate the reproducibility of our DTI-derived findings.
Figure 4.
Comparison of 3 tractography approaches. The fiber density is mapped onto the cortical surface. Red and blue represent high and low fiber density, respectively. (a) Streamline tractography result by the DTIStudio. (b) Streamline tractography result by the MEDINRIA. It is the same subject as in (a). (c) Stochastic tractography results by the FMRIB Software Library. The fiber connection strength is mapped onto the cortical surface. It is the same subject as in (a). (d) Color bars. The left and right ones are for (a–b) and (c), respectively.
Comparison of Cortical Surface Reconstruction Approaches
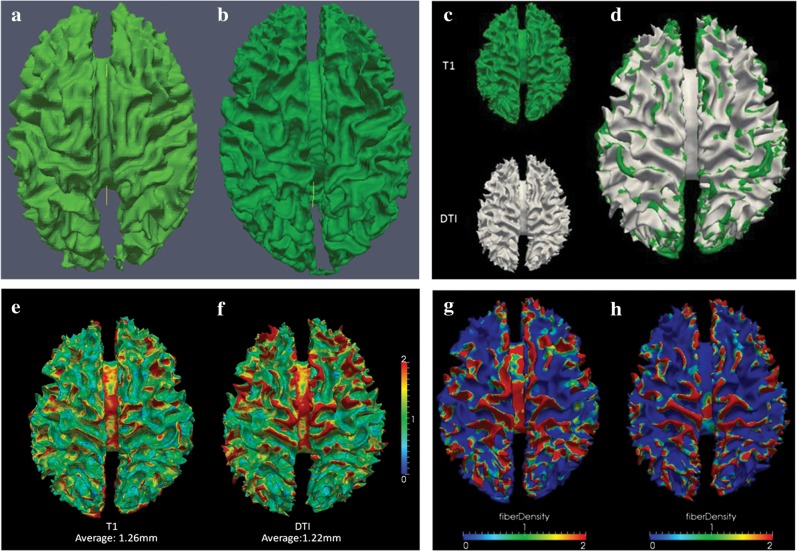
The cortical surfaces in the above sections were reconstructed from the relatively lower resolution DTI images, but not from the T1-weighted structural MRI images, in order to avoid the misalignment (Liu et al. 2007) in the registration of MRI and DTI images due to inherent geometric distortion of echo planar imaging sequences. Here, we performed a comparison study between the cortical surfaces reconstructed from DTI images and structural T1 MRI data. As shown in Figure 5a,b, the quality of the cortical surface from DTI images is acceptable, in comparison with that from structural MRI data. It should also be noted that certain shape details are missing in DTI-derived cortical surfaces due to the lower spatial resolution of DTI images (e.g., 2 mm isotropic) and there are noticeable differences between the geometric shapes in T1-weighted and DTI-reconstructed cortical surfaces. Therefore, we used the cortical surface reconstructed from DTI images.
Figure 5.
Comparison of cortical surface reconstruction approaches. (a) A cortical surface reconstructed from a human DTI image; (b) a cortical surface reconstructed from a structural T1 MRI image of the same subject. (c) Visualization of cortical surfaces reconstructed from T1 MRI image and DTI image, respectively; (d) visualization of overlaying 2 cortical surfaces together. It is evident that the 2 cortical surfaces are very close. (e) Visualization of surface distances from DTI surface to T1 surface. The average distance over all surface vertices is 1.26 mm; (f) visualization of surface distances from T1 surface to DTI surface. The average distance over all surface vertices is 1.22 mm. The color bar is on the right. (g) Fiber density mapped to the cortical surface from MRI image; (h) fiber density mapped to the cortical surface from DTI image of the same subject.
In addition, we performed analyses of the relationships between fiber densities and gyral/sulcal regions using a high-quality cortical surface reconstructed from the publicly available Johns Hopkins University Eve Atlas (Oishi et al. 2009). Because both structural MRI and DTI images have high resolution of 181 × 217 × 181/1 × 1 × 1 mm and the DTI data were B0 distortion–corrected (considered as benchmark data), the cortical surfaces reconstructed from MRI and DTI images are very similar, as visualized in the Figure 5c,d and quantified in the Figure 5e,f, respectively. The average distance between these 2 reconstructed cortical surfaces was only 1.24 mm. These results demonstrate that the cortical surface reconstructed from DTI image has comparable quality, in comparison with the cortical surface from T1 MRI image. Then, we performed fiber density mapping using both cortical surfaces and showed the results in Figure 5g,h. The fiber density mapping results using both cortical surfaces led to the same conclusion: Gyral regions have much higher fiber densities, which once again replicates our major result and conclusion in this paper—axonal fiber terminations concentrate on gyral regions in the mammalian brain.
Actin Dynamics Positively Correlate with Convex Drosophila Thoracic Ganglia Shape Formation
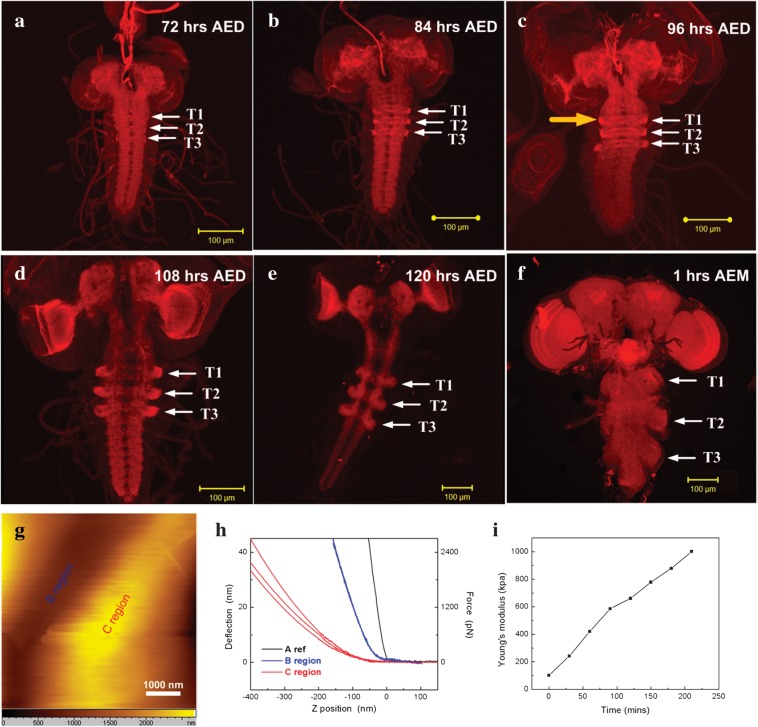
Since the mechanisms of axonal wiring are well preserved across species (Bagnard 2007), we also examined the axonal pushing hypothesis in the well-studied Drosophila. We performed time-lapse confocal microscopic imaging of actin filament dynamics in the developing Drosophila thoracic ganglia (a CNS structure) within a time window from 72 h AED to 1 h AEM. As shown in Figure 6a,f, actin dynamics positively correlated with convex shape formations on the thoracic ganglia, as highlighted by white arrows, and this finding was reproducible in other cases (Supplementary Figs 6 and 7). This “positive” correlation between axon accumulation and convex thoracic ganglia growth in Drosophila provides evidence supporting that axonal pushing might be a general mechanism of CNS morphogenesis.
Figure 6.
Positive correlation between axon accumulation and convex thoracic ganglia growth in Drosophila. (a–f) Drosophila CNS at various developmental stages. Actin filaments were stained by rhodamine-conjugated phalloidin in red. (a) 72 h AED; (b) 84 h AED; (c) 96 h AED; (d) 108 h AED; (e) 120 h AED; (f) 1 h AEM. White arrows point to the actin dynamics in the thoracic morphogenesis. T1: thoracic ganglia 1; T2: thoracic ganglia 2; T3: thoracic ganglia 3. Scale bar: 100 um. (g) The topographical image of thoracic ganglia tissue that shows concave and convex regions labeled as B region and C region, respectively. (h) Force curves measured in different thoracic ganglia regions. The solid gray line (A) with Young’s modulus of around 10 000 kPa was taken on rigid mica surface, which was used as a reference to calculate the indentation. The 3 blue lines with Young’s modulus of approximately 51 kPa were collected in the B region. The 3 blue curves were overlapped with each other due to their closeness. The 3 red lines with Young’s modulus of approximately 500 kPa were acquired in the C region. (i) Time-lapse AFM measurement of Young’s modulus on convex thoracic ganglia surface. The location of AFM probe on the thoracic ganglia tissue is illustrated by the orange arrow in (c). Black dots in (i) represent the average Young’s modulus in different time points. The time window is 210 min. It clearly shows the rapid increase of Young’s modulus during live Drosophila development.
Young’s Modulus in Convex Regions Is Significantly Higher Than That in Concave Regions and Increases Rapidly during Development
In order to further reveal the biological and biomechanical feasibilities of our axonal pushing hypothesis, we measured the Young’s modulus of convex and concave regions (Fig. 6g) of the growing Drosophila thoracic ganglia via AFM in the contact mode. Young’s modulus (details in Supplementary Fig. 8) in the convex and concave regions is shown in Figure 6h. The Young’s modulus in the convex thoracic ganglia region (500 kPa) is approximately 10 times that in the concave region (51 kPa). These results suggest that convex regions with dense axons are much stiffer than the concave regions. Additionally, we performed time-lapse AFM imaging to measure the dynamics of Young’s modulus (experimental details in Supplementary Figs 9 and 10) in a convex thoracic ganglia region. It is striking that Young’s modulus increases dramatically (from 100 to 1000 kPa) during a time window of 210 min (Fig. 6i), suggesting that axons become increasingly stiff. Also, the protruding areas of the actin filaments (indicated by the arrows in Fig. 6a) expanded 6 times within 12 h, within which time window the time series AFM measurements of Young’s modulus were performed. This result suggests that the degrees of axonal stiffness and actin accumulation follow similar temporal trajectories during development. Therefore, we hypothesize that growing axons push the growing tissue such that it has to expand in tangential directions, as illustrated in Supplementary Figure 11c,d. To support this premise from a biomechanical perspective, we performed a biomechanical simulation (more details in Supplementary Material) to demonstrate the feasibility of the axonal pushing hypothesis. The results in Supplementary Figure 12 show that the pushing force simulations produced more realistic-looking continuous gyral shapes, while the pulling force simulations led to broken unnatural gyral shapes. Quantitatively, the shape pattern histograms of simulated surfaces by the pushing force model were much more similar to those of real-world cortical surfaces.
Discussion and Conclusions
The results in Figures 1–5 and Supplementary Figures 1–5 demonstrated that a dominant percentage of axonal fibers are connected to gyral regions, relative to sulcal regions. This finding cannot be explained by the popular tension-based morphogenesis hypothesis (Van Essen 1997), which posits that cortical regions that are strongly interconnected are pulled toward one another, forming a gyral fold, as demonstrated in Supplementary Figure 11b. In order to fill this significant gap, we posit that cortical folding is induced and/or regulated by axonal pushing, as illustrated in Supplementary Figure 11c,d. In early stages of brain development, thalamocortical, callosal, and cortico-cortical axons grow under the guidance of signaling molecules (Rash and Grove 2006; Dennis et al. 2007), thus generating structural foundations for the resulting complex axonal networks (Dennis et al. 2007). These axons constantly “push” the cortical plate such that growing cortical layers (due to cell proliferation, migration, and growth) expand in tangential directions (Supplementary Fig. 11c). Because of the mechanical constraint imposed by the skull (Barron 1950; Richman et al. 1975; Nie et al. 2010), certain cortical regions must bend inward to form cortical sulci, and as a result, the cortical regions pushed by stiff axons form as the convex shapes of cortical gyri (illustrated in Supplementary Fig. 11d).
The above-mentioned axonal pushing mechanism of cortical folding is concordant with other neuroscience knowledge and brain imaging data. Developmental neuroscience suggests that thalamocortical, callosal, and cortico-cortical axonal fibers are developed in early stages of corticogenesis (Schwarts et al. 1991; Brown et al. 2002), and imaging studies (Levine and Barnes 1999; Batchelor et al. 2002) have shown that the precentral and postcentral gyri, as well as the central, precentral, and postcentral sulci (Thompson et al. 1996), are among the earliest developed cortical folds. The results in Figure 1b demonstrated that thalamocortical axons connecting to the primary motor and sensory cortices concentrate on the precentral and postcentral gyri, but “not” on the central, precentral, or postcentral sulci, as necessitated by a pulling force. In addition, most thalamocortical, callosal, and cortico-cortical axonal fibers developed early in the corticogenesis process (Schwarts et al. 1991; Brown et al. 2002) are connected to gyral regions (Figs 1–4 and Supplementary Figs 1–5), consistent with a pushing force hypothesis.
In summary, our axonal pushing hypothesis of cortical folding is consistent with macroscale diffusion MRI data in Figures 1–3 and is in agreement with microscale bioimaging in Drosophila CNS (Fig. 6 and Supplementary Figs 6–10). Our diffusion MRI data demonstrated that gyri have significantly higher axonal connections relative to sulci, a finding that was replicated in a range of primate species including humans, chimpanzees, and macaque monkeys via DTI and HARDI. Furthermore, Drosophila thoracic axon densities are correlated positively with the morphogenesis of its convex shapes, and the Young’s modulus in convex regions is around 10 times that in concave regions and it rapidly increases during neurodevelopment. Supported by these findings, the axonal pushing hypothesis offers a novel explanation into the intrinsic relationships between cortical folding and axonal wiring and a unified perspective on the relationships among cortical morphology, connection, and function.
Supplementary Material
Supplementary material and Figures 1–12 can be found at: http://www.cercor.oxfordjournals.org/
Funding
Northwestern Polytechnic University Foundation for Fundamental Research to J. Nie, L. Guo, and G. Li; National Institutes of Health (K01 EB 006878 and R01 HL087923-03S2 to T. Liu, PO1 AG026423 to L. Li and X. Hu); The University of Georgia start-up research funding to T. Liu; China Government Scholarship to K. Li, T. Zhang, and D. Zhang.
Supplementary Material
Acknowledgments
We would like to thank the anonymous reviewers for their constructive comments and suggestions that have helped to significantly improve this paper.
References
- Bagnard D. Axon growth and guidance. Adv Exp Med Biol. 2007;621 doi: 10.1007/978-0-387-76715-4_4. [DOI] [PubMed] [Google Scholar]
- Barron D. An experimental analysis of some factors involved in the development of the fissure pattern of the cerebral cortex. J Exp Zool. 1950;113:553–581. [Google Scholar]
- Batchelor PG, Smith ADC, Hill DLG, Hawkes DJ, Cox TCS. Measures of folding applied to the development of the human fetal brain. IEEE Trans Med Imaging. 2002;21(8):953–963. doi: 10.1109/TMI.2002.803108. [DOI] [PubMed] [Google Scholar]
- Behrens TE, Johansen-Berg H, Woolrich MW, Smith SM, Wheeler-Kingshott CA, Boulby PA, Barker GJ, Sillery EL, Sheehan K, Ciccarelli O, et al. Non-invasive mapping of connections between human thalamus and cortex using diffusion imaging. Nat Neurosci. 2003;6(7):750–757. doi: 10.1038/nn1075. [DOI] [PubMed] [Google Scholar]
- Brown M, Keynes R, Lumsden A. The developing brain. Oxford: Oxford University Press.; 2002. [Google Scholar]
- Chou PC, Pagano NJ. Elasticity: tensor, dyadic, and engineering approaches. New York: Dover.; 1992. [Google Scholar]
- Dennis DM, O'Leary DD, Chou S, Sahara S. Area patterning of the mammalian cortex. Neuron. 2007;56(2):252–269. doi: 10.1016/j.neuron.2007.10.010. [DOI] [PubMed] [Google Scholar]
- Koncina E, Roth L, Gonthier B, Bagnard D. Role of semaphorins during axon growth and guidance. Adv Exp Med Biol. 2007;621:50–64. doi: 10.1007/978-0-387-76715-4_4. [DOI] [PubMed] [Google Scholar]
- Levine D, Barnes PD. Cortical maturation in normal and abnormal fetuses as assessed with prenatal MR imaging. Radiology. 1999;210:751–758. doi: 10.1148/radiology.210.3.r99mr47751. [DOI] [PubMed] [Google Scholar]
- Li K, Guo L, Li G, Nie J, Faraco C, Cui G, Zhao Q, Miller SL, Liu T. Gyral folding pattern analysis via surface profiling. Neuroimage. 2010;52(4):1202–1214. doi: 10.1016/j.neuroimage.2010.04.263. [DOI] [PMC free article] [PubMed] [Google Scholar]
- Liu T, Li H, Wong K, Tarokh A, Guo L, Wong S. Brain tissue segmentation based on DTI data. Neuroimage. 2007;38(1):114–123. doi: 10.1016/j.neuroimage.2007.07.002. [DOI] [PMC free article] [PubMed] [Google Scholar]
- Liu T, Nie J, Tarokh A, Guo L, Wong S. Reconstruction of central cortical surface from brain MRI images: method and application. Neuroimage. 2008;40(3):991–1002. doi: 10.1016/j.neuroimage.2007.12.027. [DOI] [PMC free article] [PubMed] [Google Scholar]
- Mori S. Principles of diffusion tensor imaging and its applications to basic neuroscience research. Neuron. 2006;51(5):527–539. doi: 10.1016/j.neuron.2006.08.012. [DOI] [PubMed] [Google Scholar]
- Mori S, Crain BJ, Chacko VP, van Zijl PCM. Three dimensional tracking of axonal projections in the brain by magnetic resonance imaging. Ann Neurol. 1999;45:265–269. doi: 10.1002/1531-8249(199902)45:2<265::aid-ana21>3.0.co;2-3. [DOI] [PubMed] [Google Scholar]
- Nie J, Guo L, Li G, Faraco C, Miller LS, Liu T. A computational model of cerebral cortex folding. J Theor Biol. 2010;264(2):467–478. doi: 10.1016/j.jtbi.2010.02.002. [DOI] [PMC free article] [PubMed] [Google Scholar]
- Oishi K, Faria A, Jiang H, Li X, Akhter K, Zhang J, Hsu JT, Miller MI, van Zijl PC, Albert M, et al. Atlas-based whole brain white matter analysis using large deformation diffeomorphic metric mapping: application to normal elderly and Alzheimer's disease participants. Neuroimage. 2009;46(2):486–499. doi: 10.1016/j.neuroimage.2009.01.002. [DOI] [PMC free article] [PubMed] [Google Scholar]
- O’Leary DD. Do cortical areas emerge from a protocortex? Trends Neurosci. 1989;12:400–406. doi: 10.1016/0166-2236(89)90080-5. [DOI] [PubMed] [Google Scholar]
- Rakic P. Specification of cerebral cortical areas. Science. 1988;241:170–176. doi: 10.1126/science.3291116. [DOI] [PubMed] [Google Scholar]
- Rash BG, Grove EA. Area and layer patterning in the developing cerebral cortex. Curr Opin Neurobiol. 2006;16:25–34. doi: 10.1016/j.conb.2006.01.004. [DOI] [PubMed] [Google Scholar]
- Richman D, Stewart R, Hutchinson J, Caviness V. Mechanical model of brain convolutional development. Science. 1975;189:18–21. doi: 10.1126/science.1135626. [DOI] [PubMed] [Google Scholar]
- Schwarts ML, Rakic P, Goldman-Rakic PS. Early phenotype expression of cortical neurons: evidence that a subclass of migrating neurons have callosal axons. Proc Natl Acad Sci U S A. 1991;88:1354–1358. doi: 10.1073/pnas.88.4.1354. [DOI] [PMC free article] [PubMed] [Google Scholar]
- Stieltjes B, Kaufmann WE, van Zijl PC, Fredericksen K, Pearlson GD, Solaiyappan M, Mori S. Diffusion tensor imaging and axonal tracking in the human brainstem. Neuroimage. 2001;14(3):723–735. doi: 10.1006/nimg.2001.0861. [DOI] [PubMed] [Google Scholar]
- Sur M, Rubenstein JL. Patterning and plasticity of the cerebral cortex. Science. 2005;310:805–810. doi: 10.1126/science.1112070. [DOI] [PubMed] [Google Scholar]
- Thompson PM, Schwartz C, Lin RT, Khan AA, Toga AW. 3D statistical analysis of sulcal variability in the human brain. J Neurosci. 1996;16(13):4261–4274. doi: 10.1523/JNEUROSCI.16-13-04261.1996. [DOI] [PMC free article] [PubMed] [Google Scholar]
- Tuch DS, Reese TG, Wiegell MR, Makris N, Belliveau JW, Wedeen VJ. High angular resolution diffusion imaging reveals intravoxel white matter fiber heterogeneity. Magn Reson Med. 2002;48(4):577–582. doi: 10.1002/mrm.10268. [DOI] [PubMed] [Google Scholar]
- Van Essen DC. A tension-based theory of morphogenesis and compact wiring in the central nervous system. Nature. 1997;385:313–318. doi: 10.1038/385313a0. [DOI] [PubMed] [Google Scholar]
- Welker W. Why does cerebral cortex fissure and fold? A review of determinants of gyri and sulci. Cereb Cortex. 1990;8:3–136. [Google Scholar]
- Zhang J, Richards L, Yarowsky P, Huang H, van Zijl PCM, Mori S. Three-dimensional anatomical characterization of the developing mouse brain by diffusion tensor microimaging. Neuroimage. 2003;20(3):1639–1648. doi: 10.1016/s1053-8119(03)00410-5. [DOI] [PubMed] [Google Scholar]
Associated Data
This section collects any data citations, data availability statements, or supplementary materials included in this article.


