Abstract
Molecular imaging holds a pivotal role in medicine due to its ability to provide invaluable insight into disease mechanisms at molecular and cellular levels. To this end, various techniques have been developed for molecular imaging, each with its own advantages and disadvantages1–4. For example, fluorescence imaging achieves micrometre-scale resolution, but has low penetration depths and is mostly limited to exogenous agents. Here, we demonstrate molecular imaging of endogenous and exogenous chromophores using a novel form of spectroscopic optical coherence tomography. Our approach consists of using a wide spectral bandwidth laser source centred in the visible spectrum, thereby allowing facile assessment of haemoglobin oxygen levels, providing contrast from readily available absorbers, and enabling true-colour representation of samples. This approach provides high spectral fidelity while imaging at the micrometre scale in three dimensions. Molecular imaging true-colour spectroscopic optical coherence tomography (METRiCS OCT) has significant implications for many biomedical applications including ophthalmology, early cancer detection, and understanding fundamental disease mechanisms such as hypoxia and angiogenesis.
Spectroscopic optical coherence tomography (SOCT) combines the non-invasive, three-dimensional, high-resolution imaging capabilities of optical coherence tomography (OCT)5 with the rich source of knowledge available from spectroscopy by leveraging the wide spectral bandwidth of low-coherent light sources required for depth sectioning via the coherence gating process6. In fact, SOCT uses the same data acquired for conventional OCT imaging, but provides spectral information at each voxel of the sampled volume, revealing the wavelength-dependent attenuation of light traversing through the biological medium. To date, SOCT has shown the most utility when combined with the use of micro-spheres and nanoparticles in tissue phantoms7,8 and in excised breast tissue9 to provide contrast enhancement. Also, assessment of haemoglobin absorption, which is a compelling target for any biomedical imaging technique, has been investigated using SOCT with varying degrees of success10–12.
In this Letter, we present a new method for SOCT that includes two significant changes that provide unique advantages. First, the light source is chosen to occupy the visible spectrum. With a centre wavelength of 575 nm and a bandwidth of 240 nm, this light source enables molecular imaging of a wide range of absorbers, including haemoglobin and commercially available contrast agents (for example, nanoparticles, methylene blue and fluorescein). In addition, by using the visible region of the spectrum, much higher degrees of absorption from haemoglobin are observed than when using the spectral regions more commonly used in OCT and SOCT (typically ~800 nm and above). Consequently, our approach benefits from having high sensitivity to low concentrations and small changes of haemoglobin.
The second significant difference is in the signal processing approach used to obtain spatially resolved spectroscopic information. The main challenge when using SOCT is that a signal sampled in a single domain (in this case the frequency domain) has to be decomposed to a distribution that simultaneously contains information from both the original domain and the conjugate domain (temporal or spatial domain). To overcome this challenge, both linear and bilinear approaches have been used. In the linear approach, short-time Fourier-transforms (STFT) have been widely implemented. However, these suffer from a well-known trade-off in resolution between the spectral and spatial domains that significantly limits quantification7,13,14. On the other hand, bilinear distributions, including Cohen’s class functions such as the Wigner distribution, do not suffer from a resolution trade-off, but can cause significant artefacts in the processed signal that impair their use in SOCT14–16. Here, a novel bilinear approach is used, which we have termed the dual window (DW) processing method. In this approach, two STFTs are computed, one using a wide window (Δkw = 0.907 μm−1) and another using a narrow window (Δ kn = 0.061 μm−1), which are then multiplied on a point-by-point basis16. Mathematically, this approach has been shown to be equivalent to probing the Wigner distribution of the scattered field of the sample using two orthogonal windows that can independently tune the spectral and spatial resolution, as set by the window sizes. As a result, the DW distribution has high spatial resolution while providing superior spectral fidelity compared to the linear approach, yet avoids the artefacts associated with other bilinear approaches16. Note that the choice of window sizes is important; for example, if the narrow window is chosen to be a single pixel, and the wide window is chosen to span the entire sampled spectrum, then artefacts associated with the Margenau–Hill bilinear distribution (known as reflections in time) will pollute the information.
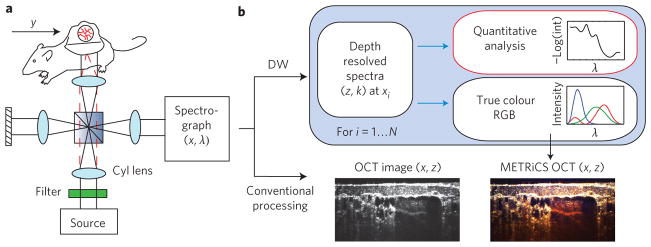
Here, we introduce molecular imaging true-colour spectroscopic optical coherence tomography (METRiCS OCT; Fig. 1) using data from a parallel Fourier domain OCT system (pfdOCT)17,18, and a super continuum laser (Fianium SC-450) as a light source. The parallel data acquisition allows sampling of up to 400 interferograms per acquisition (limited by the charge coupled device (CCD) and beam diameter), each with a lateral resolution of 6 μm (x-dimension). As with conventional spectral domain OCT processing, the data for each interferogram are recorded as a function of wavelength, resampled to a linear wavenumber array, and Fourier transformed to obtain a depth-resolved profile (z-dimension) of the scattered light with a depth resolution of 1.2 μm. The high depth resolution is achieved by using a broad spectral bandwidth, which also results in coarse spectral sampling due to the finite number of available pixels in the detector, setting the maximum penetration depth to 500 μm in air (360 μm in tissue). Three-dimensional data sets are acquired by translating the sample along the y-dimension using a motorized translational stage (resolution, 6 μm). The DW signal processing method is applied to each interferogram to compute the depth-resolved spectra. For image display of the spectroscopic data, the spectrum is divided into red, green and blue channels using the Commission Internationale d’Eclairage (CIE) colour functions, thereby providing a true-colour representation of the samples. For quantitative analysis, the full detailed spectrum is available for each voxel in the image.
Figure 1. Imaging system and processing for METRiCS OCT.
a, Light from a supercontinuum laser source is filtered and sent to a pfdOCT system. A cylindrical lens is used to deliver a line of illumination onto the sample. The scattered light from the sample and the reflected light from the reference arm are imaged onto the entrance slit of an imaging spectrograph. b, Processing method schematic. A one-dimensional Fourier transform of the resampled data (from wavelength to wavenumber) yields an OCT image (conventional processing). The DW method is applied to each interferogram, thus providing a spectrum for each point of the corresponding A-scan. The processed spectral information may be analysed quantitatively or used to assign red, green and blue channels for a true-colour representation of the samples. The procedure is repeated for each interferogram to obtain spatially resolved spectroscopic information throughout the sampled volume.
To demonstrate the capabilities of METRiCS OCT, images were acquired from an in vivo CD1 nu/nu normal mouse dorsal skin-fold window chamber model19. All animal experimental protocols were approved by the Institutional Animal Care and Use Committee of Duke University. For imaging of endogenous contrast, the mouse was anaesthetized and the window chamber was removed.
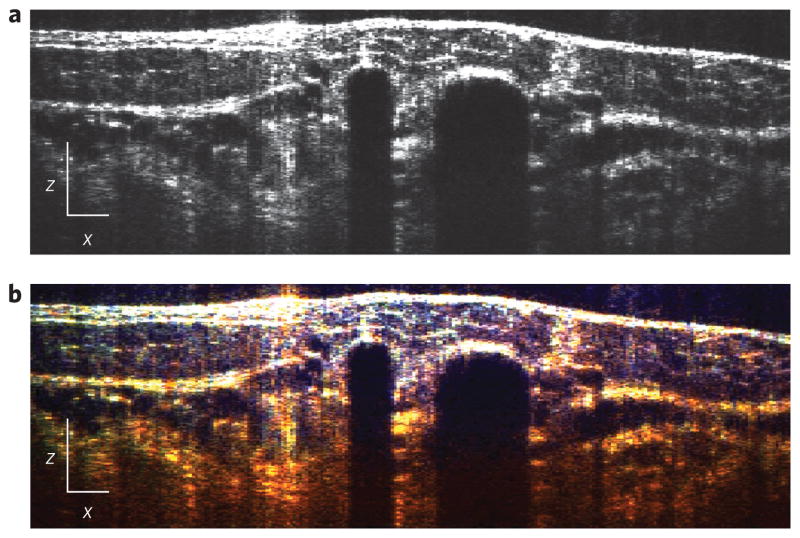
Conventional OCT imaging of the data revealed tissue structures as shown in Fig. 2a. In the case of the dorsal window20, several histological structures are evident, including the muscle layer, the lumen of blood vessels (including small capillaries) and the subcutaneous layer. However, functional information regarding the sample is not available in this format. With METRiCS OCT (Fig. 2b and Supplementary Video 1), the same structures are visualized with the addition of true-colour contrast, which provides access to a wealth of spectroscopic information that was previously unattainable. As expected, we observe that the muscle layer at the surface appears relatively colourless due to low concentrations of haemoglobin; however, once light traverses through the vasculature network beneath, a redshift is clearly observed due to the higher concentrations of haemoglobin there. Note that small colour variations are observed on the top layer due to scattering from muscle and fibrous structures. Also, with large blood vessels (>100 μm), most of the light is attenuated, thereby preventing detection of signals from below and thus creating a ‘shadow’ effect. However, in regions without apparent blood vessels, signals are obtained throughout the full penetration depth enabled by the system. To our knowledge, this is the first tomographic image to present micrometre-scale tomographic data from live tissues in true colour.
Figure 2. Tomographic (x–z ) images with endogenous contrast.
a,b, Conventional OCT (a) and METRiCS OCT (b) images, located below point (d) in the en face (x–y) image in Fig. 3a. White x and z scale bars, 100 μm.
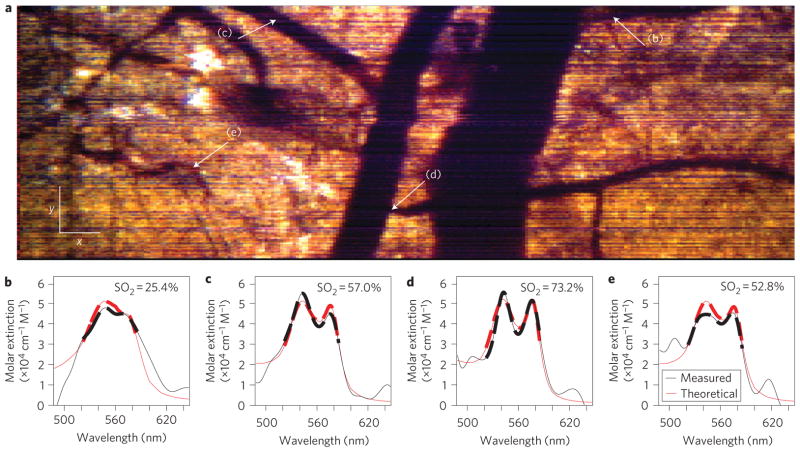
The full potential impact of this imaging method can be seen in the en face image presented in Fig. 3a. Here, several x–y planes are summed to incorporate vessels found at different depths. This image shows two major vessels, with the larger one on the right corresponding to a vein and the other to an artery. Several branching vessels can also be observed, together with the capillary plexus, which is more readily appreciable in the three-dimensional volume (Supplementary Video 1).
Figure 3. En face (x–y) image using endogenous contrast, and spectral profiles.
a, En face METRiCS OCT image with arrows indicating points where the spectra are quantified. White x and y scale bars, 100 μm. b–e, Spectral profiles from points (b)–(e) in a. Measured spectral profiles (black) are superposed with the theoretical haemoglobin molar extinction coefficients (red). The dashed portion of the curves outlines the region used to determine SO2 levels. All spectra were selected from depths immediately below each corresponding vessel.
An important feature of METRiCS OCT is the ability to quantitatively analyse spatially resolved spectra from voxels within the three-dimensional volume. Here, we select four points of interest to analyse; these points are found along a branching vessel from the vein (Fig. 3b), two from the artery (Fig. 3c,d) and from the capillary network (Fig. 3e). From these spectra, the oxygen saturation (SO2) can be determined using a simple linear analysis that restricts the bandwidth to a region where the oxy- and deoxy-haemoglobin extinction coefficients have zero correlation (520–585 nm)21. This allows for the measured spectral data to be inverted using an orthogonal linear system containing the known coefficients. As Fig. 3b–e shows, the measured spectra are well fit by this model and correspond to expected values for these tissue locations22. Further analysis also reveals relatively small variations of only a few percent in saturation from nearby points along individual vessels (Supplementary Fig. 1).
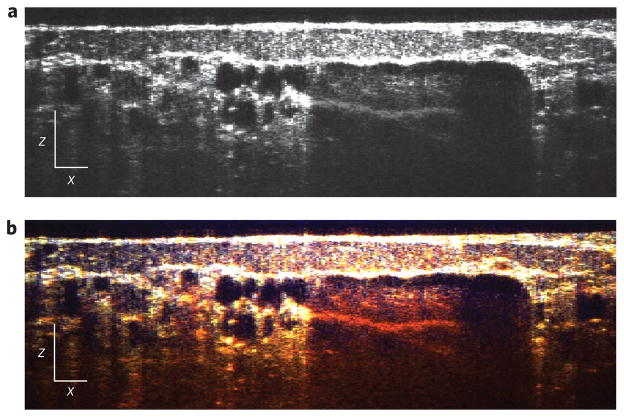
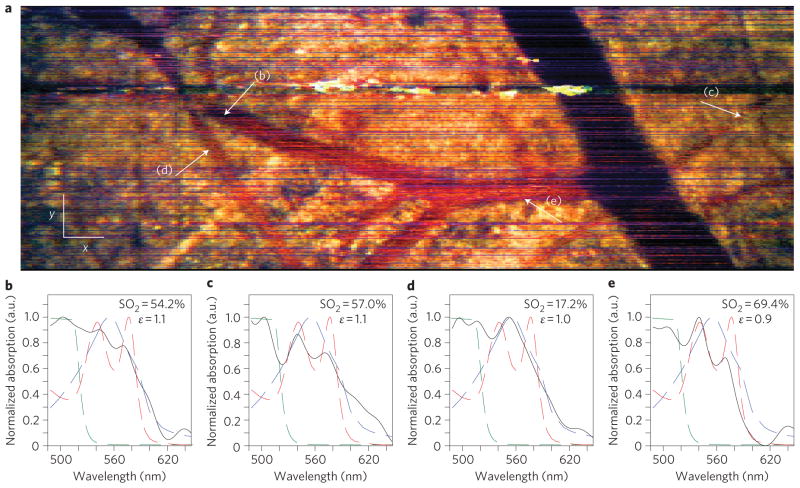
As a further demonstration of the utility of METRiCS OCT, we now present imaging using an exogenous contrast agent, an area that has seen limited success in OCT to date. Accordingly, 100 μl of sodium fluorescein (NaFS), diluted in sterile saline to 1% by weight, was introduced via a retro-orbital injection, an intravenous injection that serves as an alternative to a tail vein injection, with the agent introduced into the retrobulbar sinus (behind the globe of the eye). The resulting images (Figs 4 and 5) clearly indicate the presence of NaFS by a severe redshift in hue, which arises from stronger absorption at the lower wavelengths compared to that observed with endogenous contrast. Note that the injection results in the agent remaining confined to the vessels as it does not leak out appreciably. Surprisingly, the agent also shows a weak increase in scattering. As a result, vessels are now characterized by the red hue of NaFS in the en face image, but large vessels still exhibit a strong ‘shadow’. Next, spectra from four points of interest are selected (Fig. 5b–e). Here the contributions of the three absorbing species affect the shape of the localized spectra to varying degrees. Figure 5b–e shows that the presence of NaFS only contributes to the attenuation spectra in the lower wavelengths, so assessment of SO2 may still be accomplished as described above. Furthermore, the relative amount of absorption due to NaFS with respect to total haemoglobin (ε ≡ NaFS/Hb) is also computed. The results show that this ratio is relatively constant (~1), which is expected as both NaFS and haemoglobin are contained within the vessels and their relative contributions with respect to one another should not vary appreciably.
Figure 4. Tomographic (x–z ) images with exogenous contrast.
a,b, Conventional OCT (a) and METRiCS OCT (b) images, located above point (e) in the en face (x–y) image in Fig. 5a. White x and z scale bars, 100 μm.
Figure 5. En face (x–y) image using exogenous contrast, and spectral profiles.
a, En face METRiCS OCT image with arrows indicating points where the spectra are extracted. White x and y scale bars, 100 μm. b–e, Spectral profiles from points (b)–(e) in a. Measured spectral profiles (black) are superposed with the theoretical oxy- (dashed red) and deoxy- (dashed blue) haemoglobin normalized extinction coefficients, and normalized absorption of NaFS (dashed green). Also shown are the SO2 levels and the relative absorption of NaFS with respect to total haemoglobin (ε ≡ NaFS/Hb). All spectra were selected from depths immediately below each corresponding vessel.
As a final observation regarding these data, we comment on the apparent effects of detector saturation due to fluorescent light from the NaFS. This phenomenon is seen in the green areas of the en face image, and in the green streaks in the three-dimensional volume (Fig. 5 and Supplementary Video 2). The contrast agent (NaFS) absorbs light with maximum efficiency around 494 nm, producing the red hue of the vessels in the METRiCS OCT images. However, it also emits incoherent fluorescent light at a peak wavelength of 521 nm (green light). When this signal is particularly strong, green spots/streaks are seen due to detector saturation, which prohibits separation of the green incoherent signal.
Molecular imaging techniques are important to medicine for their ability to non-invasively monitor cellular morphology and functional processes. Here we have demonstrated true-colour, quantitative, tomographic, in vivo images of endogenous and exogenous contrast agents with micrometre-scale spatial resolution in three dimensions. The unique ability of METRiCS OCT to access the full visible spectrum from selected points within a sample volume not only enables quantitative analysis over a large bandwidth, but also provides an intuitive form of display by using the true colours of the samples. With further developments targeting applications that diagnose specific diseases, we expect that METRiCS OCT will have a significant impact on our understanding of tumour development (for example, angiogenesis and hypoxia), ophthalmologic pathologies (retinal microvasculature perfusion and oxygenation), early cancer detection, and delivery and monitoring of therapeutic agents.
Supplementary Material
Acknowledgments
This research was supported by a grant from the National Institutes of Health (NCI 1 R01 CA138594-01).
Footnotes
Author contributions
F.E.R. conducted the optical experiments and analysed the data. C.W. and G.G. procured the animal model and carried out animal protocols. F.E.R. and A.W. contributed to the genesis of the idea and wrote the paper.
The authors declare competing financial interests: details accompany the full-text HTML version of the paper at www.nature.com/naturephotonics.
Supplementary information accompanies this paper at www.nature.com/naturephotonics.
Reprints and permission information is available online at http://www.nature.com/reprints.
References
- 1.Ntziachristos V, Tung CH, Bremer C, Weissleder R. Fluorescence molecular tomography resolves protease activity in vivo. Nature Med. 2002;8:757–761. doi: 10.1038/nm729. [DOI] [PubMed] [Google Scholar]
- 2.Wang X, et al. Noninvasive laser-induced photoacoustic tomography for structural and functional in vivo imaging of the brain. Nature Biotechnol. 2003;21:803–806. doi: 10.1038/nbt839. [DOI] [PubMed] [Google Scholar]
- 3.Helmchen F, Denk W. Deep tissue two-photon microscopy. Nature Methods. 2005;2:932–940. doi: 10.1038/nmeth818. [DOI] [PubMed] [Google Scholar]
- 4.Boppart SA, Oldenburg AL, Xu C, Marks DL. Optical probes and techniques for molecular contrast enhancement in coherence imaging. J Biomed Opt. 2005;10:041208. doi: 10.1117/1.2008974. [DOI] [PubMed] [Google Scholar]
- 5.Huang D, et al. Optical coherence tomography. Science. 1991;254:1178–1181. doi: 10.1126/science.1957169. [DOI] [PMC free article] [PubMed] [Google Scholar]
- 6.Morgner U, et al. Spectroscopic optical coherence tomography. Opt Lett. 2000;25:111–113. doi: 10.1364/ol.25.000111. [DOI] [PubMed] [Google Scholar]
- 7.Yi J, Gong J, Li X. Analyzing absorption and scattering spectra of micro-scale structures with spectroscopic optical coherence tomography. Opt Express. 2009;17:13157–13167. doi: 10.1364/oe.17.013157. [DOI] [PubMed] [Google Scholar]
- 8.Cang H, et al. Gold nanocages as contrast agents for spectroscopic optical coherence tomography. Opt Lett. 2005;30:3048–3050. doi: 10.1364/ol.30.003048. [DOI] [PubMed] [Google Scholar]
- 9.Oldenburg AL, Hansen MN, Ralston TS, Wei A, Boppart SA. Imaging gold nanorods in excised human breast carcinoma by spectroscopic optical coherence tomography. J Mater Chem. 2009;19:6407–6411. doi: 10.1039/b823389f. [DOI] [PMC free article] [PubMed] [Google Scholar]
- 10.Faber DJ, Mik EG, Aalders MCG, van Leeuwen TG. Toward assessment of blood oxygen saturation by spectroscopic optical coherence tomography. Opt Lett. 2005;30:1015–1017. doi: 10.1364/ol.30.001015. [DOI] [PubMed] [Google Scholar]
- 11.Faber DJ, van Leeuwen TG. Are quantitative attenuation measurements of blood by optical coherence tomography feasible? Opt Lett. 2009;34:1435–1437. doi: 10.1364/ol.34.001435. [DOI] [PubMed] [Google Scholar]
- 12.Yi J, Li X. Estimation of oxygen saturation from erythrocytes by high-resolution spectroscopic optical coherence tomography. Opt Lett. 2010;35:2094–2096. doi: 10.1364/OL.35.002094. [DOI] [PubMed] [Google Scholar]
- 13.Graf RN, Wax A. Temporal coherence and time-frequency distributions in spectroscopic optical coherence tomography. J Opt Soc Am A. 2007;24:2186–2195. doi: 10.1364/josaa.24.002186. [DOI] [PMC free article] [PubMed] [Google Scholar]
- 14.Xu C, Kamalabadi F, Boppart SA. Comparative performance analysis of time–frequency distributions for spectroscopic optical coherence tomography. Appl Opt. 2005;44:1813–1822. doi: 10.1364/ao.44.001813. [DOI] [PubMed] [Google Scholar]
- 15.Cohen L. Time-frequency distributions—a review. Proc IEEE. 1989;77:941–981. [Google Scholar]
- 16.Robles F, Graf RN, Wax A. Dual window method for processing spectroscopic optical coherence tomography signals with simultaneously high spectral and temporal resolution. Opt Express. 2009;17:6799–6812. doi: 10.1364/oe.17.006799. [DOI] [PMC free article] [PubMed] [Google Scholar]
- 17.Grajciar B, Pircher M, Fercher AF, Leitgeb RA. Parallel Fourier domain optical coherence tomography for in vivo measurement of the human eye. Opt Express. 2005;13:1131–1137. doi: 10.1364/opex.13.001131. [DOI] [PubMed] [Google Scholar]
- 18.Graf RN, Brown WJ, Wax A. Parallel frequency-domain optical coherence tomography scatter-mode imaging of the hamster cheek pouch using a thermal light source. Opt Lett. 2009;33:1285–1287. doi: 10.1364/ol.33.001285. [DOI] [PMC free article] [PubMed] [Google Scholar]
- 19.Huang Q, et al. Noninvasive visualization of tumors in rodent dorsal skin window chambers. Nature Biotechnol. 1999;17:1033–1035. doi: 10.1038/13736. [DOI] [PubMed] [Google Scholar]
- 20.Koehl GE, Gaumann A, Geissler EK. Intravital microscopy of tumor angiogenesis and regression in the dorsal skin fold chamber: mechanistic insights and preclinical testing of therapeutic strategies. Clin Exp Metastasis. 2009;26:329–344. doi: 10.1007/s10585-008-9234-7. [DOI] [PubMed] [Google Scholar]
- 21.Robles FE, Chowdhury S, Wax A. Assessing hemoglobin concentration using spectroscopic optical coherence tomography for feasibility of tissue diagnostics. Biomed Opt Express. 2010;1:310–317. doi: 10.1364/boe.1.000310/. [DOI] [PMC free article] [PubMed] [Google Scholar]
- 22.Skala MC, Fontanella A, Lan L, Izatt JA, Dewhirst MW. Longitudinal optical imaging of tumor metabolism and hemodynamics. J Biomed Opt. 2010;15:011112. doi: 10.1117/1.3285584. [DOI] [PMC free article] [PubMed] [Google Scholar]
Associated Data
This section collects any data citations, data availability statements, or supplementary materials included in this article.


