Abstract
Background and Aim
The early diagnosis of biliary tract cancer (BTC) remains challenging and there are few effective therapies. We investigated whether the M2 isotype of pyruvate kinase (M2-PK), which serves as the key regulator of cellular energy metabolism in proliferating cells, could play a role in the diagnosis and therapy of BTC.
Methods
Plasma and bile M2-PK concentrations were measured by ELISA in 88 patients with BTC, 79 with benign biliary diseases and 17 healthy controls. M2-PK expression was sought in BTC tissue array by immunohistochemistry. The role of M2-PK in tumour growth, invasion and angiogenesis was evaluated in BTC cell lines by retrovirus-mediated M2-PK transfection and shRNA silencing techniques.
Results
Sensitivity (90.3%) and specificity (84.3%) of bile M2-PK for malignancy were significantly higher than those for plasma M2-PK and serum CA19-9. M2-PK expression was specific for cancer cells and correlated with microvessel density. M2-PK positivity was a significant independent prognostic factor by multivariable analysis. Transfection of M2-PK in a negatively expressed cell line (HuCCT-1cells) increased cell invasion whereas silencing in a M2-PK positive cell line (TFK cells) decreased tumour nodule formation and cellular invasion. A significant increase in endothelial tube formation was noted when supernatants from M2-PK transfected cells were added to an in vitro angiogenesis assay whereas supernatants from silenced cells negated tube formation.
Conclusions
Bile M2-PK is a novel tumour marker for BTC and correlates with tumour aggressiveness and poor outcome. shRNA mediated inhibition of M2-PK indicates the potential of M2-PK as a therapeutic target.
Keywords: pyruvate kinase M2, cholangiocarcinoma, invasion, angiogenesis, diagnosis
Introduction
Biliary tract cancer (BTC: cholangiocarcinoma and the less common cancer of the gallbladder) is one of the deadliest malignancies after pancreatic cancer, with similar incidence and mortality rates. Surgical resection provides the best hope of survival when diagnosed at an early stage, but of the 10–30% of cases where surgery is feasible, only a few patients survive beyond three years (1, 2). In most patients relief of biliary obstruction and palliative chemotherapy are the mainstays of therapy.
In patients presenting with biliary symptoms, the diagnosis is largely based on the clinical presentation of cholestasis, abdominal pain and weight loss, together with cross-sectional imaging studies, but it is often difficult to differentiate between BTC and benign stricturing conditions such as primary sclerosing cholangitis (PSC). Endobiliary procedures such as forcep biopsy, brush or aspiration cytology have high (95–100%) specificity but are invasive and have a sensitivity of only 40–70% (3). Liver biochemical abnormalities and the standard tumour markers including CA19-9 and carcinoembryonic antigen (CEA) are of limited value. Serum levels of CA19-9 are elevated in up to 50–85% of patients with BTC, but CA19-9 elevation can also occur in obstructive jaundice without malignancy. Other tumour markers such as DU-PAN-2, CA125 and RCAS1 have performed similarly or less well than CA19-9 and are not part of routine clinical practice (4). A reliable tumour marker which could discriminate between benign biliary disease and BTC would be a useful addition to the current diagnostic work up for BTC.
One such potential biomarker is the pyruvate kinase isoenzyme type M2 (M2-PK). Pyruvate kinase plays a vital role in the final step of glycolysis, which produces pyruvate and ATP from glucose degradation. The M2-PK is the characteristic pyruvate kinase isoenzyme of all proliferating cells including tumour cells. A unique feature of M2-PK is that this isoenzyme may appear in different conformations: a highly active tetrameric and a nearly inactive dimeric form. The dimeric form works as a dam to build-up the intermediary macromolecules upfront in the glycolytic pathway which are subsequently used as cell building blocks such fatty acids, amino acids and nucleic acids for cell proliferation. In tumours M2-PK was found to be mainly in the dimeric form and has therefore been termed “Tumour M2-PK” (5). Currently, the dimeric form could be detected by a specific antibody raised against it which does not react with the tetrameric form. M2-PK can be detected in different body fluids, such as plasma, stool and pleural fluid and may have a role in the diagnosis of solid tumours including lung, ovary, cervix, breast, kidney, gastrointestinal tumours and melanoma (6–10). However, as yet the role of M2-PK in bile as marker for BTC has not been investigated. In this study, for the quantification of the dimeric form of M2-PK in plasma and bile samples, a sandwich ELISA technique was used which is based on two monoclonal antibodies directed against the dimeric M2-PK. The antibody used for immunohistochemistry (clone DF4 ) was shown to discriminate between the dimeric and tetrameric forms of M2-PK and only stains the dimeric form. In Western blots, the antibody stains total M2-PK protein and reflects M2-PK expression.
In this study, we determined both plasma M2-PK (pM2-PK) and bile M2-PK(bM2-PK) in BTC and correlated the results with clinicopathological characteristics and patient prognosis. We also used a tissue array platform to determine the M2-PK expression pattern in BTC and correlated the results with clinicopathological parameters including neoangiogenesis. Finally, we performed a series of in vitro studies in BTC cell lines to characterize the role of M2-PK in cell proliferation, invasion and angiogenesis, and as a potential therapeutic target.
Materials and Methods
Patients
A total of 167 patients were included in this study: (i) patients with histologically/cytologically proven BTC (n = 88), and (ii) patients with benign biliary conditions (BBC, n = 79) including obstructive jaundice secondary to biliary stones or benign biliary strictures, sphincter of Oddi dysfunction, autoimmune pancreatitis and primary sclerosing cholangitis (PSC). Patient characteristics are mentioned in Table 1 (supplementary data). Seventeen healthy controls also donated blood samples for the study, however, data from healthy controls were not used in generating the ROC curve. Informed consent was obtained from all subjects for use of clinical material for research purposes and the protocol was approved by the Institute’s Ethical Committee.
Table 1.
Patient characteristics.
| Tumour type | |
| Cholangiocarcinoma | 82(93%) |
| Gallbladder cancer | 6(7%) |
| Tumour location | |
| Intrahepatic(peripheral) | 5(6%) |
| Perihilar (Klatskin) | 62(76%) |
| Extrahepatic(distal) | 15(18%) |
| Clinical T-stage | |
| T1 | 4(4%) |
| T2 | 20(23%) |
| T3 | 34(39%) |
| T4 | 27(31%) |
| Unknown | 3(3%) |
| Benign Biliary Conditions | |
| Choledocholithiasis | 17(22%) |
| Primary sclerosing cholangitis | 17(22%) |
| Benign biliary stricture | 13(16%) |
| Sphincter of Oddi dysfunction | 15(18%) |
| Miscellaneous* | 17(22%) |
Includes hepatopancreatobiliary inflammatory conditions including hepatitis of different causes with biliary stricture.
Measurement of M2-PK concentrations in EDTA-plasma and bile samples by ELISA
An enzyme-linked immunosorbent assay kit (kindly provided as a gift from ScheBo Biotech, Giessen, Germany) was used for measuring bM2-PK and pM2-PK. In brief, diluted samples were added to 96-well plates coated with anti-M2-PK antibody. After 60 min of incubation and several rinses, plates were incubated with a biotin-conjugated anti-M2-PK monoclonal antibody for 30 min. Bound M2-PK molecules were detected with a streptavidin-coupled horseradish peroxidase reaction and the plates were read at 450nm using a spectrophotometer. All samples were assayed in duplicate.
Immunohistochemistry of M2-PK and CD34
A commercially available tissue array (Stretton Scientific Limited, UK), comprising of 46 BTC samples and two normal biliary epithelial tissues in duplicate, was used for dual immunostaining to simultaneously localise M2-PK and microvessels. Immunostaining was done with a double staining kit according to the instructions provided with the kit (PicTrue kit, Invitrogen, UK). Sections were incubated simultaneously with anti-M2-PK antibody (anti-human M2-PK antibody, ScheBo Biotech UK Ltd) and anti-human CD34 antibody overnight at 4°C. Two distinct substrate/chromogen/enzyme systems were used: IgG-HRP produced brown colour (M2-PK) whereas IgG-AP with fast red produced red colour (blood vessels). M2-PK staining was evaluated according to a scoring formula and number of microvessel density (MVD) was counted as we described previously(11).
Cell lines
Four established human BTC cell lines; HuCCT, TFK, SKCHA and SG231 were used for this study (Purchased from Japan Health Sciences Foundation, Japan and DSMZ Scientifica, Germany). All cell lines were maintained in RPMI medium.
Transfection of M2-PK
For M2-PK transfection experiments, a lentivirus vector was used for stable transfection of full length M2-PK gene. The M2-PK gene incorporated into the pOTB7 plasmid was purchased from Gene Services Limited, Cambridge, UK. An expression vector was constructed with the pSIN vector (Gift from Yasuhiro Ikeda, Windeyer Institute) and the M2-PK gene driven by the SFFV promoter. Coexpression of eGFP was obtained by using an internal ribosomal entry site (IRES -Gift from Chris Boshoff, UCL). HuCCT cells were infected with different clones of M2-PK recombinant virus for stable transfection and monitored by GFP expression. The clone with the highest expression of M2-PK (HuCCT-CM92) was selected for subsequent analysis. A control virus without M2-PK but with GFP insert was used as a negative control (HuCCT-RIG2). Expression of M2-PK was checked by both Western blot and real-time PCR and the strongest clone was selected for further experiments.
Silencing of M2-PK by shRNA
For silencing M2-PK expression, we used a commercially available genome-wide plasmid based shRNA (SureSilencing shRNA, Superarray Bioscience Corporation, Suite, USA). According to the manufacturer, four distinct M2-PK specific shRNA targeting sequences were designed using a proprietary algorithm and cloned into the pGeneClip™ hMGFP vector (Promega) to generate SureSilencing™ shRNA plasmids. Transfection grade SureSilencing™ plasmids (0.8 mg) (four gene specific and one scramble) were delivered by using the transfection reagent SureFECT to approximately 80,000 TFK cells. Silencing was confirmed by both real-time PCR and Western blot. Among the four shRNA clones (B, G, R and Y), B did not inhibit M2-PK expression and was discarded. Cells transfected with the negative control plasmid were used as negative controls.
Western blot analysis
Approximately 20 μg of protein was run on precast gels and transferred onto polyvinylidene fluoride membranes (Amersham, Little Chalfont, UK). Following overnight blocking, the membrane was incubated with anti-human M2-PK antibody and then incubated with horseradish peroxidase–linked secondary antibody (Dako, Glostrup, Denmark). The antigen–antibody reaction was visualized using enhanced chemiluminescence. We used anti-β actin antibody (Sigma-Aldrich, St. Louis, MO, USA) as protein load control.
Quantitative RT-PCR (qRT-PCR) analysis
Total RNA was extracted using the RNeasy Mini Kit (Qiagen, Santa Clarita, CA) and reverse transcribed with the SuperScript III First-Strand Synthesis System (Invitrogen Ltd., Paisley UK). Amplification by qRT-PCR was performed using an ABI 7500real-time PCR machine following standard procedures. M2-PK gene specific primers (Superarray Bioscience Corporation, Suite, USA) were used for the qPCR reaction.
MTS assay
Cell proliferation rate was determined by a colorimetric MTS assay(Promega, Madison, USA). Approximately 3000cells were added to each well in duplicate and incubated for predetermined periods before adding 20μl of MTS Reagent to each well. Cells were incubated for another 3 hours and the optical density was measured at490 nm by means of spectrophotometry.
3D cell culture
A 3D cell culture system (AlgiMatrix, Invitrogen, UK) incorporating a bioscaffold of alginate inside the 96 well plate was used. M2-PK transfected, silenced and the control cell lines were seeded within the scaffolds (2.5×10⁴/well) and partial medium changes were done every 72 hr. At three weeks, cancer spheroids were counted from the surface and bottom of the plate in 10 randomly selected areas. Data were expressed as average number of spheroids per high power field (×400).
Cell migration assay
Tumour cell invasion was assayedin an invasion chamber (Cell Biolabs, Inc., San Diego, USA) with 8 μm porosity polycarbonate membrane. The insert coated with Matrigel matrix was placed in each well of a 24-well plate filled with 300 μl of warm medium (RPMI without FBS). The upper well contained suspension of tumour cells (0.5 × 10⁶ cell/ml medium). After incubation at 37°C for 24 hours, the cells on the upper surface were gently scrubbed and cells that had migrated through the filter were stained with almor blue. Migrated cells were extracted with 200 μl of extraction solution and quantified by a spectrophotometer at 560 OD. All assays were done in duplicate.
In vitro angiogenesis
24-well plates containing early stage co-cultures of human umbilical vascular endothelial cells (HUVEC) and matrix producing cells (TCS Angio Kit) were used. Conditioned media from cell lines at different cultivation time points were added to the culture plate in appropriate wells and were replaced with fresh conditioned media on the 4th and 7th day of cultivation. Recombinant vascular endothelial growth factor and suramin were used as positive and negative controls, respectively.
Statistical analyses
Differences were compared by t-test or Mann-Whitney U test as appropriate. For comparison of multiple groups, one-way ANOVA with Scheffe’s posthoc test was used. The Spearman test was used as a measurement of correlation between continuous variables. A cut off point for pM2-PK and bM2-PK was determined by using ROC analysis. Differences between categorical values were determined by Chi-square test with Yate’s correction. Survival was analyzed using the Kaplan-Meier method in combination with the log-rank test. Statistical significance was taken as p < 0.05 by SPSS software.
Results
M2-PK concentrations in bile and plasma
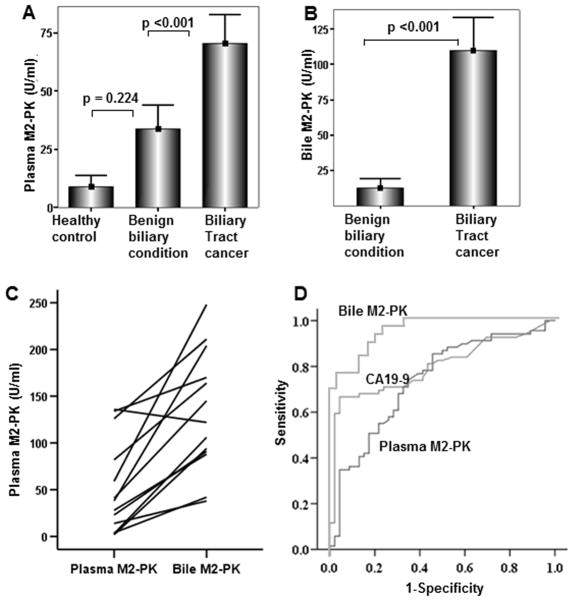
Comparison of pM2-PK concentrations revealed no difference between benign biliary conditions (BBC) and healthy controls (29.2 ± 35.9 vs. 8.9 ± 9.7 U/ml, mean ± SD, respectively, p = 0.22, ANOVA with Scheffe’s test) (Figure 1A). However, in patients with BTC, pM2-PK level was significantly higher than in those with BBC (70.2 ± 52.5 vs. 29.2 ± 35.9 U/ml respectively, p <0.001) (Figure 1A). bM2-PK concentration was 109.8 ± 63.6 U/ml in patients with BTC compared with 12.3 ± 18.8 U/ml in all non-cancerous conditions (p <0.001, t-test, Figure 1B), and only 4.1U/ml (range 1–17 U/ml) when three extreme values (45, 54, and 66 U/ml) in gallbladder bile samples from BBC patients collected at the time of cholecystectomy were excluded. In this cohort, the 17 patients with PSC had an average bM2-PK level of 15.2 U/ml which was non-significantly higher than in the whole Benign Biliary Diseases group (12.3 U/ml). A paired analysis between pM2-PK and bM2-PKvalues in patients with BTC revealed that bM2-PK levels were always higher when compared with the pM2-PK level except in one case (Figure 1C). ROC curves generated for bM2-PK showed 90.3% sensitivity and 84.3 % specificity with a cut-off value of 24.4 U/ml, whereas the sensitivity and specificity for pM2-PK was 71.0% and 69.9%, respectively, at a cut off value of 31.7 U/ml. The sensitivity and specificity for serum CA19-9 alone at a standard cut-off value of 37 U/ml were 69.4% and 78%, respectively (Figure 1D). When considered as continuous variables, there was a significant positive correlation between the CA19-9 and M2-PK levels (bM2-PK and Ca19-9, p = 0.004, r2 = 39.4 and, pM2-PK and Ca19-9, p = 0.000, r2 = 36.4, Spearman rank correlation test). When the data were dichotomised (positive/negative) according to the set cut-off points, although bM2-PK and pM2-PK had 68.75% and 62.6% concordance with the CA19-9, respectively, still in almost one third of cases they were discordant. When both M2-PK and CA19-9 status were taken into account, this did not improve the diagnostic sensitivity and specificity over the M2-PK alone status.
Figure 1.
Plasma (A) and bile (B) M2-PK levels of healthy controls, patients with benign biliary conditions and biliary tract cancer are shown. Pairwise comparison of the pM2-PK and bM2-PK values of each individual patient with biliary tract cancer(C). Comparison of ROC curves of pM2-PK and bM2-PK and CA19-9 is shown (D).
Relationship between M2-PK status and patient survival
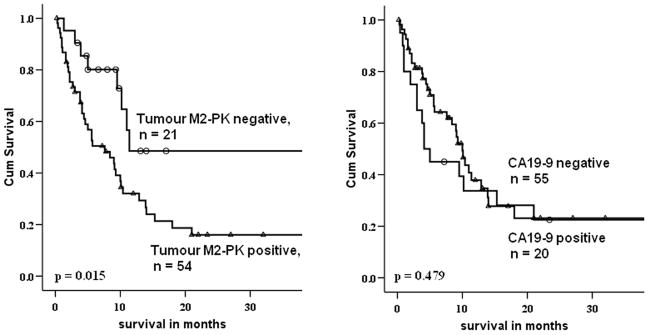
Using the above mentioned cut-off values, patients were dichotomised into high (bM2-PK > 24.4 U/ml; pM2-PK > 31.7 U/ml) and low (bM2-PK ≤ 24.4 U/ml and pM2-PK ≤ 31.7 U/ml) for M2-PK. A total of 75/88 (85%) patients with BTC had up-to-date follow-up and outcome data. The prevalence of M2-PK positivity was significantly (p = 0.039) higher in >65 yr patients and there was a trend towards increased positivity in patients with advanced tumour T-stage (p = 0.078)(Table 2, supplementary data). Patients with high pM2-PK levels had a shorter overall survival (12.1 ± 1.9 months) than patients with low M2-PK concentrations (28.8 ± 6.1 months) (p = 0.01, log rank test) whereas a significant correlation could not be attained when patients were stratified by CA19-9 positivity (p = 0.50) (Figure 2). Multivariable analysis showed that a combination of bM2-PK and pM2-PK became an independent prognostic predictor (p = 0.04, hazard ratio 2.483) when adjusted for tumour stage, CA19-9 positivity, bilirubin level and patients’ age. Besides M2-PK, patients’ age was the only independent predictor of survival (hazard ratio 2.038).
Table 2.
Patient characteristics stratified by M2-PK positivity
| Parameters | M2-PK negative (n=21) | M2-PK positive (n=54) | p-value |
|---|---|---|---|
| Patient’s age | |||
| Low(≤65) | 12(43) | 16(57) | 0.035 |
| High(>65) | 9(19) | 38(81) | |
| Gender | |||
| Male | 10(29) | 25(71) | 0.560 |
| Female | 11(27) | 29(73) | |
| Serum bilirubin(umol/L) | |||
| Low(≤20) | 7(44) | 9(56) | 0.104 |
| High(>20) | 14(24) | 45(76) | |
| CA19-9 level(U/ml) | |||
| Low(≤37) | 6(30) | 14(70) | 0.515 |
| High(>37) | 15(27) | 40(73) | |
| T-stage | |||
| T1 and T2 | 9(45) | 11(55) | 0.078 |
| T3 and T4 | 12(22) | 43(78) | |
| Tumour location | |||
| Intrahepatic(peripheral) | 1(20) | 4(80) | 0.896 |
| Perihilar(Klatskin) | 16(29) | 39(71) | |
| Extrahepatic (distal) | 3(33) | 6(67) | |
| Gallbladder cancer | 1(17) | 5(83) | |
Numbers in parenthesis indicate percentages
Figure 2.
Survival stratified by M2-PK (left) and Ca19-9 (right) are shown. Patients with high M2-PK had significantly worse overall survival than those with low M2-PK.
Tissue array: correlation between M2-PK and MVD
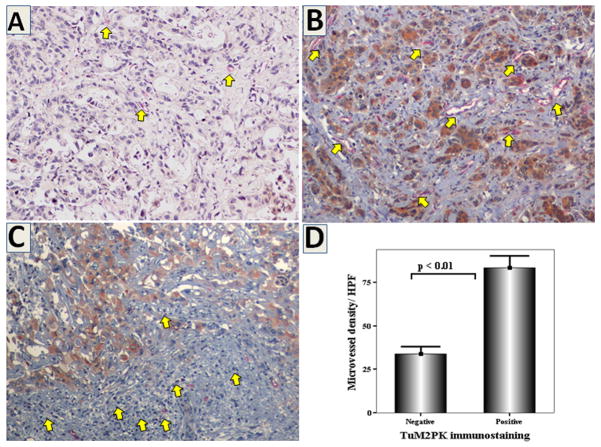
M2-PK expression was not detectable in normal biliary epithelium whereas in most of the cancers, it was detectable as cytoplasmic staining (Figure 3). Although variable amounts of infiltrating immune competent cells were detectable in the vicinity of tumour nests, most of these cells were negative for M2-PK. Out of 46 BTC cases, 17 (36%) had a score of ≤3 and were classified as negative for M2-PK. M2-PK positive tumours had significantly higher number of MVD when compared with M2-PK negative ones (mean ± SD; 83.2 ± 37.4 vs. 34.0 ± 17.3, respectively, p<0.01, r2 = 71.3, p <0.001, Spearman’s rank correlation test) (Figure 3). Tissue M2-PK positivity was correlated with patient/tumour characteristics data provided with the tissue array slides by Stretton Scientific Limited, UK. Lymph node metastasis was positive in 71% of patients with M2-PK positive tumours compared with 46% in those with negative tumours (p = 0.18, Chi-square test). Tumours with advanced stage (T3 & T4) had significantly higher positivity for M2-PK than those with lower stages (81% vs. 27%, p <0.01). The number of intratumoral infiltrating lymphocytes residing within the tumour nodules was counted in the five most densely populated areas under a high power objective (x 400) and the average used as the intratumoral lymphocyte count. There was a trend towards lower counts in M2-PK positive tumours when compared with the negative tumours (9.5 ± 6.6 vs. 14.3 ± 11.6, p = 0.191) (Table 3, supplementary data).
Figure 3.
Double immunohistochemistry for M2-PK (brown colour) and CD34 (red colour) in representative sections of BTC showing weak M2-PK expression with few blood vessels(A), strong M2-PK expression with numerous blood vessels (B, yellow arrows), and negative expression in peritumoral lymphocytes (C, arrows) (x200). Tumours with strong M2-PK expression were characterized by larger number of blood vessels (D).
Table 3.
Correlation of clinicopathological parameters with M2-PK expression in tissue array.
| Parameters | M2-PK | p-value | ||
|---|---|---|---|---|
| negative | positive | |||
| Gender | male | 8 | 20 | 0.124 |
| female | 9 | 9 | ||
| Age | 69.4 ± 9.2 | 67.2 ± 10.8 | 0.367 | |
| Tumour size | 4.6 ± 2.1 | 5.7 ± 2.6 | 0.279 | |
| Differentiation | ||||
| mild | 3 | 4 | 0.256 | |
| moderate | 6 | 19 | ||
| poor | 6 | 6 | ||
| unknown | 2 | 0 | ||
| Tumour location | non-hilar | 12 | 13 | 0.213 |
| hilar | 5 | 14 | ||
| unknown | 0 | 2 | ||
| Lymph node status | negative | 6 | 4 | 0.241 |
| positive | 5 | 10 | ||
| unknown | 6 | 15 | ||
| T-stage | 1& 2 | 11 | 4 | 0.001 |
| 3 & 4 | 6 | 25 | ||
| Microvessel density | 34.0 ± 17.3 | 83.2 ± 37.4 | 0.001 | |
| Number of Intratumoral lymphocytes | 9.5 ± 6.6 | 14.3 ± 11.6 | 0.191 | |
Correlation with cell proliferation and growth
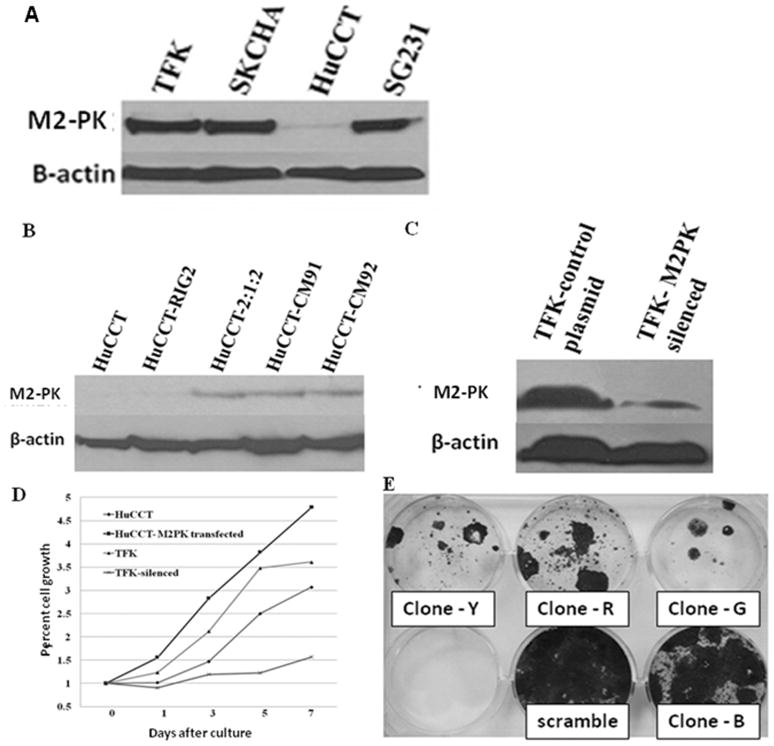
Strong M2-PK expression was noted in TFK, SKCHA and SG231 cells whereas HuCCT cells had very weak expression (Figure 4A). For our transfection experiments, we selected TFK and HUCCT as BTC cell lines with high and low M2-PK expression, respectively. Subsequently, we transfected HuCCT cells with a full length M2-PK gene in order to enhance M2-PK expression. For silencing of M2-PK expression in TFK cells, four different shRNA clones (G, R, Y and B), which are directed against four different locations of the PKM gene, were used. Changes in M2-PK expression both at protein (Figure 4B & C) and mRNA level (data not shown) were checked in all transfected cells. All clones of shRNA except clone B produced significant decrease in cell proliferation in TFK cells (Figure 4E).
Figure 4.
Strong M2-PK expression was noted in all cell lines except HuCCT(A). M2-PK western blot of HuCCT following transfection with (right 3 lanes) or without (2nd lane) full length M2-PK (B). M2-PK western blot of mock-treated TFK cells and TFK cells silenced with shRNAs (clones G, R and Y) (C). Cell proliferation rates of mock-treated HuCCT, M2-PK transfected HuCCT, mock-treated TFK and M2-PK silenced TFK cells (D). MTS assay showed increased cell proliferation in M2-PK transfected HuCCT cells and significant growth inhibition in M2-PK silenced cells (D). Anti-proliferative effect of different shRNA clones are shown; all clones except clone B had significant growth inhibition (E).
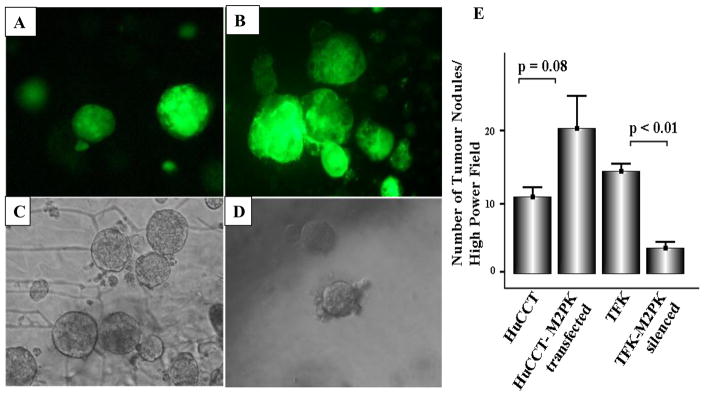
M2-PK transfection of the HuCCT cell line almost doubled cell proliferation, whereas silencing of M2-PK in the TFK cell line inhibited it by up to 70% of the controls on day 5 (Figure 4D). In M2-PK transfected HuCCT cells, there was a trend towards increased tumour nodule formation (p = 0.08, Figure 5A, B & E), whereas silencing of M2-PK significantly inhibited tumour nodule formation when compared with the mock-treated cells (p <0.01) (Figure 5C, D & E).
Figure 5.
3D spheroids formation of parental HuCCT (A), M2-PK-transfected HuCCT (B), parental TFK (C) and M2-PK-silenced TFK (D) in the AlgiMatrix 3D cell culture system. Mean number of spheroids/high power field is shown (E).
M2-PK and cellular invasion
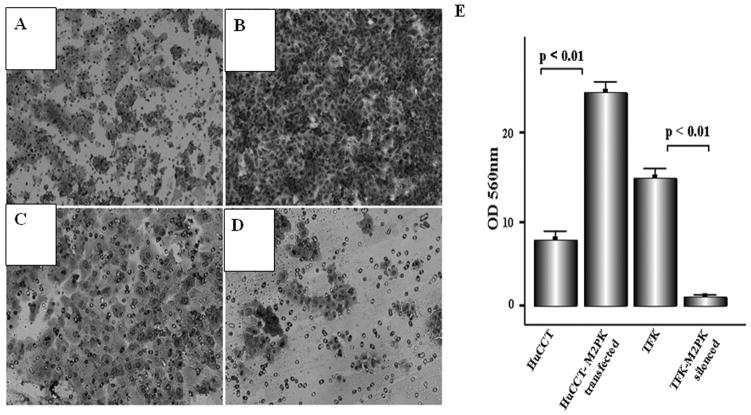
Representative photomicrographs demonstrate compact cellular growth and invasion on the under surface of the filter in transfected HuCCT cells (Figure 6A) whereas only a few scattered cells were noted after silencing M2-PK in TFK cells (Figure 6D). In HuCCT cells, M2-PK transfection induced a nearly three-fold increase in the motility and invasion of the cells (p<0.01) (Figure 6B). Silencing in TFK cells almost abolished the invasion through the matrigel reconstituted basement membrane (p<0.01, Figure 6E), indicating a crucial role of M2-PK in cellular motility and invasion.
Figure 6.
Invasive potential of wild-type HuCCT (A), M2-PK-transfected HuCCT (B), wild type TFK (C) and M2-PK-silenced TFK (D). Figures A-D show the cells which migrated through the membrane. (E) Bars represent the mean ± SD.
M2-PK in capillary formation
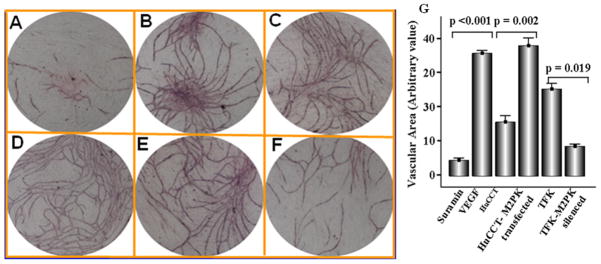
Incubation of HUVEC with physiological concentrationsof recombinant VEGF resulted in robust formation of capillary network at 7 days after initiation of the culture whereas suramin, an angiogenesis inhibitor, almost abolished angiogenesis (Figure 7A). A comparable angiogenic effect to that of VEGF was noted in wells supplemented with culture supernatant from M2-PK transfected HuCCT cells (Figure 7D), which was significantly (p = 0.002) higher in comparison to wild-type HuCCT cells (Figure 7C). Treatment with conditioned media from the M2-PK silenced cells was associated with a significant decrease capillary formation (p = 0.019, Figure 7F & G).
Figure 7.
Capillary formation in the presence of suramin (A), recombinant VEGF (B), cell culture supernatant of wild-type HuCCT (C), supernatant of M2-PK-transfected HuCCT (D), supernatant of wild-type TFK (E) and M2-PK silenced TFK (F). (G) Bars represent the mean ± SD.
Discussion
The results of this study provide evidence for the clinical significance and biological relevance of M2-PK in cell proliferation, growth, angiogenesis and invasion in BTC. We demonstrated that M2-PK in bile and plasma can be used as novel diagnostic and prognostic markers for BTC, opening up the potential for earlier diagnosis of BTC and for using M2-PK as a novel therapeutic target. pM2-PK levels were significantly higher in patients with BTC than in healthy controls (Figure 1A), consistent with a previous study (10). In our study, pM2-PK was higher in BBCs than in healthy controls but did not reach statistical significance (Figure 1A). In the bile of patients with BTC, M2-PK levels were 9-fold higher in comparison to patients with BBC including the PSC only group (Figure 1B), with a sensitivity and specificity of 90.3% and 84.3%, respectively (Figure 1D). When bM2-PK and pM2-PK values were compared, almost all patients with PSC with high plasma levels of M2-PK had low bM2-PK. Conversely, patients with BTC with low pM2-PK had high bM2-PK concentrations (Figure 1C), pointing to a high discriminating capacity of bM2-PK for BTC and BBC. In contrast to bM2-PK, the measurement of CA19-9 and CEA in bile did not confer any additional advantage over their corresponding plasma levels (12).
M2-PK values have also been reported to be raised in inflammatory conditions such as arthritis (13). The higher pM2-PK values in inflammatory conditions may be due to the systemic inflammatory response rather than local production of M2-PK. Indeed, in the present study, M2-PK was rarely expressed by the infiltrating lymphocytes in BTC sections. Accordingly, Oehler et al (14)showed that M2-PK is expressed by neutrophils but not by lymphocytes, which may explain a higher level of circulatory M2-PK in inflammatory conditions.
The treatment of BTC remains a daunting challenge for clinicians. To date, decision making regarding the type and extent of therapy in BTC relies predominantly on cross-sectional imaging and biliary brushings. The results of this study indicate that M2-PK could be a useful prognostic marker in BTC. Indeed, M2-PK became an independent prognostic marker when analyzed with other conventional prognosticators in BTC. Similarly, in melanoma patients high M2-PK levels identified a group of patients with poorer survival (7). The poor outcome of tumours with high M2-PK content could be attributed to tumour progression and aggressive phenotype. In the present study, M2-PK expression in tissue array was significantly high in advanced tumour stages.
M2-PK expressed by the immune competent cells in the tumour milieu may also play a role in the aggressive phenotype of the tumour. Indeed, very recently Zhang et al (15) showed that suppressor of cytokine signaling 3 specifically binds to M2-PK in dendritic cells causing dendritic cell dysfunction. Impaired antigen presentation by the dysfunctional dendritic cells and a lack of production of tumour-specific lymphocytes were correlated with ineffective tumour vaccination in lung carcinoma. Whether a similar phenomenon is responsible for immune tolerance and aggressiveness of BTC warrants further investigation.
In the four BTC cell lines studied, we found high M2-PK expression in all cell lines except in HuCCT. Similarly, in our tissue array study, high M2-PK expression (score >3) was noted in 64% of the BTC samples whereas the normal biliary epithelial cells were all negative. These findings are in agreement with a recently published article describing M2-PK as the second highest differentially expressed gene in intrahepatic cholangiocarcinoma (16). To address the exact role of M2-PK in cellular proliferation, invasion and angiogenesis, we used TFK cells as a representative cell line with high M2-PK expression and used shRNA to silence M2-PK. Silencing of M2-PK in TFK cells by shRNA was accompanied by pronounced inhibition of cell proliferation (>70% on day 5 of culture). Conversely, M2-PK transfection of HuCCT cells causing high M2-PK expression increased cell proliferation by up to 50 % on the third cultivation day.
Silencing of M2-PK inhibited tumour growth significantly in 3D cell culture assay with almost 80% inhibition of growth of tumour nodules whereas transfection in HuCCT cells increased the tumour growth with enhanced sprouting of daughter nodules in the 3D cell culture assay. In keeping with these findings, we showed previously that co-transfection of oncogenic gag-A-Raf and wild type M2-PK doubled colony formation in NIH 3T3 cells (17). Very recently, Christofk et al (18, 19) showed that in almost 90% of instances, the M2 isoform expressing tumour cells successfully produced tumours in mice, compared to < 50% when cells expressing the M1 isoform were used. Only recently, the clinical relevance of M2-PK in tumour development has been shown in patients with Bloom syndrome, where presence of missense mutations of M2-PK resulted in early development of multiple tumours (20).
In the present study, transfection of M2-PK into HuCCT cells significantly increased the cellular invasion whereas silencing of M2-PK almost negated cell invasion. Similarly, a stepwise increase of pM2-PK concentrations from limited to extensive metastatic diseases was noted in pancreatic carcinoma (21). Interestingly, a differential proteome analysis on two hepatocellular carcinoma cell lines with high and low metastatic potentials showed that M2-PK was one of the six highly expressed proteins in the metastatic cells (22)
Angiogenesis is a hallmark of tumour aggressiveness. So far the role of M2-PK in tumour angiogenesis has not been investigated. In our study, we found a significant correlation between M2-PK expression and the number of MVD. In the in vitro angiogenesis study conditioned media from the M2-PK transfected cells significantly increased the number of nascent vessels whereas those from the silenced cell line almost abolished angiogenesis to the same level as seen with suramin (an angiogenesis inhibitor). Although any direct correlation between M2-PK and angiogenesis is yet to be established, Duan et al (23) showed recently that M2-PK promotes angiogenesis by binding to tumour endothelial marker-8, a cell membrane protein predominantly expressed in tumour endothelium. M2-PK may also contribute to tumour angiogenesis in a paracrine fashion by mast cell degranulation and release of angiogenic factors (24). Interestingly, Terada et al (25) showed that the density of mast cells was significantly higher in BTC than in normal liver and hepatocellular carcinoma.
Results of the shRNA based treatment raise the possibility of designing highly effective anti-tumour treatment by targeting M2-PK, either alone or in combination with chemotherapeutic agents shown to be effective in this condition. Very recently, a selective small molecule inhibitor which inhibits cell proliferation has been described (26). Moreover, synergistic anti-tumour effect by small molecule inhibitor raised against the M2-PK along with other anti-cancer agents such as cisplatin or gefitinib has also been reported (27). As such M2-PK inhibitory strategy would be a potential therapeutic target in BTC.
Acknowledgments
Grants & Support: This study was supported in part by National Institute of Health (NIH) grant PO1CA84203, MRC grant(G0801588) and Charitable Research Fund East and North Herts NHS Trust. The work was undertaken at UCLH/UCL, which receives a proportion of funding from the Department of Health’s National Institute for Health Research (NIHR) Biomedical Research Centres funding scheme. The lead Author (DKD) is a Jason Boas Research Fellow and this work has been partly funded by the Jason Boas Charitable fund.
The authors are grateful to Ms Anja Döring of ScheBo Biotech AG, Germany for her excellent technical support for setting up the M2-PK ELISA measurement.
Abbreviations used in this paper
- BBC
benign biliary conditions
- BTC
biliary tract cancer
- MVD
microvessel density
- M2-PK
pyruvate kinase isoenzyme type M2
- PSC
primary sclerosing cholangitis
References
- 1.West J, Wood H, Logan RF, Quinn M, Aithal GP. Trends in the incidence of primary liver and biliary tract cancers in England and Wales 1971–2001. Br J Cancer. 2006;94:1751–8.2. doi: 10.1038/sj.bjc.6603127. [DOI] [PMC free article] [PubMed] [Google Scholar]
- 3.Charatcharoenwitthaya P, Enders FB, Halling KC, Lindor KD. Utility of serum tumor markers, imaging, and biliary cytology for detecting cholangiocarcinoma in primary sclerosing cholangitis. Hepatology. 2008;48:1106–17. doi: 10.1002/hep.22441. [DOI] [PubMed] [Google Scholar]
- 4.Nehls O, Gregor M, Klump B. Serum and bile markers for cholangiocarcinoma. Semin Liver Dis. 2004;24:139–54. doi: 10.1055/s-2004-828891. [DOI] [PubMed] [Google Scholar]
- 5.Mazurek S. Pyruvate kinase type M2: A key regulator of the metabolic budget system in tumor cells. Int J Biochem Cell Biol. 2011;43:969–80. doi: 10.1016/j.biocel.2010.02.005. [DOI] [PubMed] [Google Scholar]
- 6.Kaura B, Bagga R, Patel FD. Evaluation of the Pyruvate Kinase isoenzyme tumor (Tu M2-PK) as a tumor marker for cervical carcinoma. J Obstet Gynaecol Res. 2004;30:193–6. doi: 10.1111/j.1447-0756.2004.00187.x. [DOI] [PubMed] [Google Scholar]
- 7.Ugurel S, Bell N, Sucker A, Zimpfer A, Rittgen W, Schadendorf D. Tumor type M2 pyruvate kinase (TuM2-PK) as a novel plasma tumor marker in melanoma. Int J Cancer. 2005;117:825–30. doi: 10.1002/ijc.21073. [DOI] [PubMed] [Google Scholar]
- 8.Hathurusinghe HR, Goonetilleke KS, Siriwardena AK. Current status of tumor M2 pyruvate kinase (Tumour M2-PK) as a biomarker of gastrointestinal malignancy. Ann Surg Oncol. 2007;14:2714–20. doi: 10.1245/s10434-007-9481-x. [DOI] [PubMed] [Google Scholar]
- 9.Elia S, Massoud R, Guggino G, et al. Tumor type M2-pyruvate-kinase levels in pleural fluid versus plasma in cancer patients: a further tool to define the need for invasive procedures. Eur J Cardiothorac Surg. 2008;33:723–7. doi: 10.1016/j.ejcts.2008.01.014. [DOI] [PubMed] [Google Scholar]
- 10.Li YG, Zhang N. Clinical significance of serum tumour M2-PK and CA19-9 detection in the diagnosis of cholangiocarcinoma. Dig Liver Dis. 2009;41:605–8. doi: 10.1016/j.dld.2008.11.010. [DOI] [PubMed] [Google Scholar]
- 11.Dhar DK, Wang TC, Tabara H, et al. Expression of trefoil factor family members correlates with patient prognosis and neoangiogenesis. Clin Cancer Res. 2005;11:6472–8. doi: 10.1158/1078-0432.CCR-05-0671. [DOI] [PubMed] [Google Scholar]
- 12.Ohshio G, Manabe T, Watanabe Y, et al. Comparative studies of DU-PAN-2, carcinoembryonic antigen, and CA19-9 in the serum and bile of patients with pancreatic and biliary tract diseases: evaluation of the influence of obstructive jaundice. Am J Gastroenterol. 1990;85:1370–6. [PubMed] [Google Scholar]
- 13.Oremek GM, Müller R, Sapoutzis N, et al. Pyruvate kinase type tumor M2 plasma levels in patients afflicted with rheumatic diseases. Anticancer Res. 2003 Mar-Apr;23(2A):1131–4. [PubMed] [Google Scholar]
- 14.Oehler R, Weingartmann G, Manhart N, et al. Polytrauma induces increased expression of pyruvate kinase in neutrophils. Blood. 2000;95:1086–92. [PubMed] [Google Scholar]
- 15.Zhang Z, Liu Q, Che Y, et al. Antigen presentation by dendritic cells in tumors is disrupted by altered metabolism that involves pyruvate kinase M2 and its interaction with SOCS3. Cancer Res. 2010;70:89–98. doi: 10.1158/0008-5472.CAN-09-2970. [DOI] [PubMed] [Google Scholar]
- 16.Hass HG, Nehls O, Jobst J, Frilling A, Vogel U, Kaiser S. Identification of osteopontin as the most consistently over-expressed gene in intrahepatic cholangiocarcinoma: detection by oligonucleotide microarray and real-time PCR analysis. World J Gastroenterol. 2008;14:2501–10. doi: 10.3748/wjg.14.2501. [DOI] [PMC free article] [PubMed] [Google Scholar]
- 17.Le Mellay V, Houben R, Troppmair J, et al. Regulation of glycolysis by Raf protein serine/threonine kinases. Adv Enzyme Regul. 2002;42:317–32. doi: 10.1016/s0065-2571(01)00036-x. [DOI] [PubMed] [Google Scholar]
- 18.Christofk HR, Vander Heiden MG, Harris MH, et al. The M2 splice isoform of pyruvate kinase is important for cancer metabolism and tumour growth. Nature. 2008;452:230–3. doi: 10.1038/nature06734. [DOI] [PubMed] [Google Scholar]
- 19.Christofk HR, Vander Heiden MG, Wu N, Asara JM, Cantley LC. Pyruvate kinase M2 is a phosphotyrosine-binding protein. Nature. 2008;452:181–6. doi: 10.1038/nature06667. [DOI] [PubMed] [Google Scholar]
- 20.Akhtar K, Gupta V, Koul A, Alam N, Bhat R, Bamezai RN. Differential behavior of missense mutations in the intersubunit contact domain of the human pyruvate kinase M2 isozyme. J Biol Chem. 2009;284:11971–81. doi: 10.1074/jbc.M808761200. [DOI] [PMC free article] [PubMed] [Google Scholar]
- 21.Cerwenka H, Aigner R, Bacher H, et al. TUM2-PK (pyruvate kinase type tumor M2), CA19-9 and CEA in patients with benign, malignant and metastasizing pancreatic lesions. Anticancer Res. 1999;19:849–51. [PubMed] [Google Scholar]
- 22.Ding SJ, Li Y, Shao XX, et al. Proteome analysis of hepatocellular carcinoma cell strains, MHCC97-H and MHCC97-L, with different metastasis potentials. Proteomics. 2004;4:982–94. doi: 10.1002/pmic.200300653. [DOI] [PubMed] [Google Scholar]
- 23.Duan HF, Hu XW, Chen JL, et al. Antitumor activities of TEM8-Fc: an engineered antibody-like molecule targeting tumor endothelial marker 8. J Natl Cancer Inst. 2007;99:1551–5. doi: 10.1093/jnci/djm132. [DOI] [PubMed] [Google Scholar]
- 24.Ryu H, Walker JK, Kim S, et al. Regulation of M2-type pyruvate kinase mediated by the high-affinity IgE receptors is required for mast cell degranulation. Br J Pharmacol. 2008;154:1035–46. doi: 10.1038/bjp.2008.148. [DOI] [PMC free article] [PubMed] [Google Scholar]
- 25.Terada T, Matsunaga Y. Increased mast cells in hepatocellular carcinoma and intrahepatic cholangiocarcinoma. J Hepatol. 2000;33:961–6. doi: 10.1016/s0168-8278(00)80129-4. [DOI] [PubMed] [Google Scholar]
- 26.Vander Heiden MG, Christofk HR, Schuman E, et al. Identification of small molecule inhibitors of pyruvate kinase M2. Biochem Pharmacol. 2010;79:1118–24. doi: 10.1016/j.bcp.2009.12.003. [DOI] [PMC free article] [PubMed] [Google Scholar]
- 27.Guo W, Zhang Y, Chen T, et al. Efficacy of RNAi targeting of pyruvate kinase M2 combined with cisplatin in a lung cancer model. J Cancer Res Clin Oncol. 2010 Mar 25; doi: 10.1007/s00432-010-0860-5. [DOI] [PubMed] [Google Scholar]


