Abstract
The mammalian genome is compacted to fit within the confines of the cell nucleus. DNA is wrapped around nucleosomes, forming the classic ‘beads-on-a-string’ 10-nm chromatin fibre. Ten-nanometre chromatin fibres are thought to condense into 30-nm fibres. This structural reorganization is widely assumed to correspond to transitions between active and repressed chromatin, thereby representing a chief regulatory event. Here, by combining electron spectroscopic imaging with tomography, three-dimensional images are generated, revealing that both open and closed chromatin domains in mouse somatic cells comprise 10-nm fibres. These findings indicate that the 30-nm chromatin model does not reflect the true regulatory structure in vivo.
Keywords: chromatin fibre, nuclear organization, electron tomography
Introduction
Prevailing models of genome organization describe the 30-nm fibre as the default bulk chromatin conformation within the mammalian nucleus [1, 2, 3]. According to these models, the 30-nm fibre is formed by either coiling 10-nm fibres into a solenoid [4, 5] or folding 10-nm fibres into a zig–zag conformation [6]. The 30-nm chromatin fibre model has prevailed from experiments using cell-free conditions, and from cells where nuclei are disrupted or chromatin extracted [2, 3, 7], but little direct evidence exists for an in situ 30-nm fibre, with the exception of a few specialized non-mammalian cell types [8, 9, 10, 11]. A definitive understanding of higher-order chromatin structure in situ has remained elusive, mainly due to the limitations of direct imaging technologies. For instance, conventional transmission electron microscopy requires contrast-enhancing agents, which obscure the high-resolution detail of individual chromatin fibres and cannot be reliably used to distinguish chromatin from surrounding protein complexes. Cryo electron microscopy (cryoEM) overcomes some limitations of conventional TEM, retaining chromatin in a hydrated environment. Recent studies by cryoEM methods have been used to address the chromatin fibre configuration in metaphase chromosomes, and have provided high-resolution images of extracted chromatin. The cryoEM approach has not yet addressed the question of the chromatin fibre configuration in intact interphase cells, primarily due to the relatively low contrast of chromatin in situ in interphase nuclei. Electron spectroscopic imaging (ESI) on the other hand provides quantitative, high-contrast images of chromatin fibres in situ with high spatial resolution, without the use of contrast agents. Both ESI and conventional transmission electron microscopy, however, suffer from the same complication in that three-dimensional (3D) information is projected onto a single image plane. As a result, several, often overlapping, chromatin fibres cannot be resolved. By combining ESI [12, 13, 14] with electron tomography [15, 16], this serious limitation can be overcome, and has allowed us to resolve even overlapping fibres in compact chromatin domains at the nuclear envelope of cultured mouse embryonic fibroblasts (MEFs) [17].
Results and Discussion
The mouse genome provides a unique opportunity to assess the higher-order chromatin organization of closed chromatin domains. The main satellite pericentromeric repeat sequences from multiple chromosomes cluster to form large, easily recognized, cytologically compact chromocentres. These chromocentres are thought to comprise higher-order chromatin fibre assemblies, including 30-nm fibres [18], and are enriched in the definitive marks of constitutive heterochromatin, such as H3K9me3 and H4K20me3 [19].
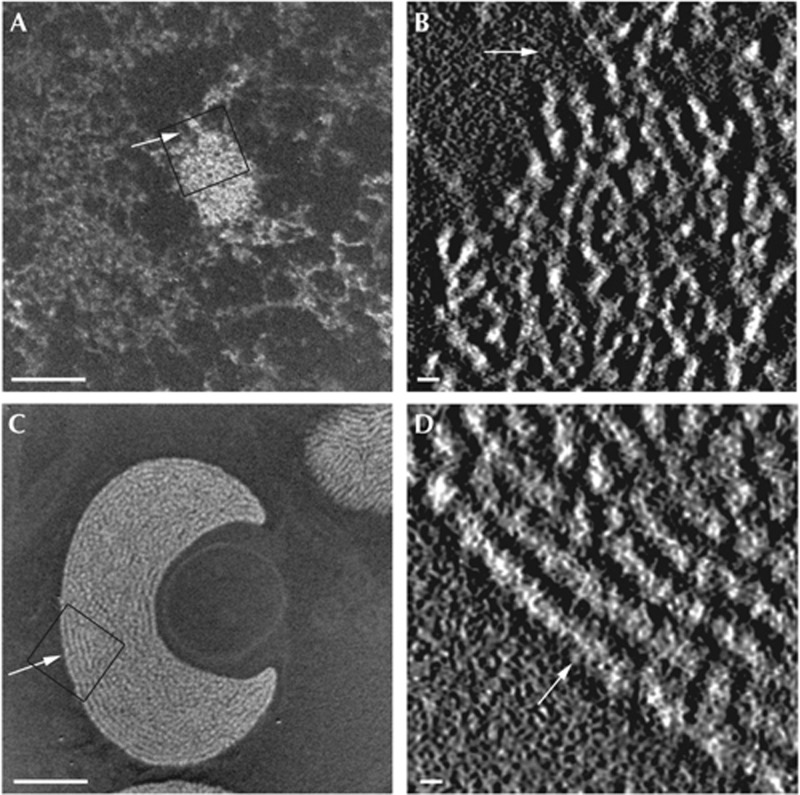
After tomographic reconstruction of MEFs, we observed 10-nm chromatin fibres not only in open domains, but, surprisingly, also in closed heterochromatin chromocentres, identified by constitutive heterochromatin-associated histone marks (Fig 1A,B; supplementary movie S1 online; supplementary Fig S1A–C online). Even more surprising was the distinct absence of 30-nm fibres in these heterochromatin domains. To confirm that our fixation, embedding or tomographic reconstruction procedure was not responsible for generating any dimensional distortions, we applied the identical protocol to analyse the chromatin configuration of Patiria miniata (starfish) sperm. Previous studies have detected in situ higher-order chromatin structures within these nuclei [11, 20]. As expected, we observed primarily so-called 30-nm chromatin fibres in the mature sperm nuclei both by ESI and by ESI tomography (Fig 1C,D). In real space, measurements of fibre diameter ranged from 20 to 30 nm, consistent with both X-ray scattering measurements [21] and conventional TEM [6]. As the 30-nm fibre and high-order chromatin assemblies of starfish sperm are clearly discernable using ESI tomography, we rejected the possibility that the 10-nm chromatin fibres observed in MEF nuclei were simply due to specimen preparation artefacts. We considered the remote possibility that chemical fixation might have disrupted the 30-nm into 10-nm chromatin fibres in mouse cells under culture conditions. This was unlikely as the same fixation and embedding procedures were used to visualize starfish sperm nuclei, where 30 nm chromatin was observed (Fig 1C,D) [20]. Nevertheless, we examined the 3D structure of chromocentres in specimens that were cryo-fixed by high-pressure freezing followed by freeze substitution and resin embedding. Ten-nanometre chromatin fibres also exclusively comprised both the chromocentre domains and the surrounding chromatin in the cryo-fixed MEFs (supplementary Fig S1D,E online).
Figure 1.
ESI-tomographic analysis reveals the MEF nucleus is populated exclusively by 10-nm chromatin fibres and is able to detect both 10- and 30-nm chromatin fibres in situ. (A) An ESI phosphorus map of a MEF nucleus, chromatin fibres (white on black background), where all the chromatin fibres are projected onto a single image plane, and (B) central plane of the tomogram generated from this nucleus of an enlarged region of the chromocentre shown in A (box). (C) Phosphorus map and (D) central plane through the tomogram of an entire starfish sperm nuclei. The arrow illustrates rotation between the phosphorus map and the tomogram. Thirty-nanometre chromatin fibres in the field (box) are oriented parallel to the plane of the section. Scale bar, 500 nm in (A,C), and 30 nm in (B,D). ESI, electron spectroscopic imaging; MEF, mouse embryonic fibroblast.
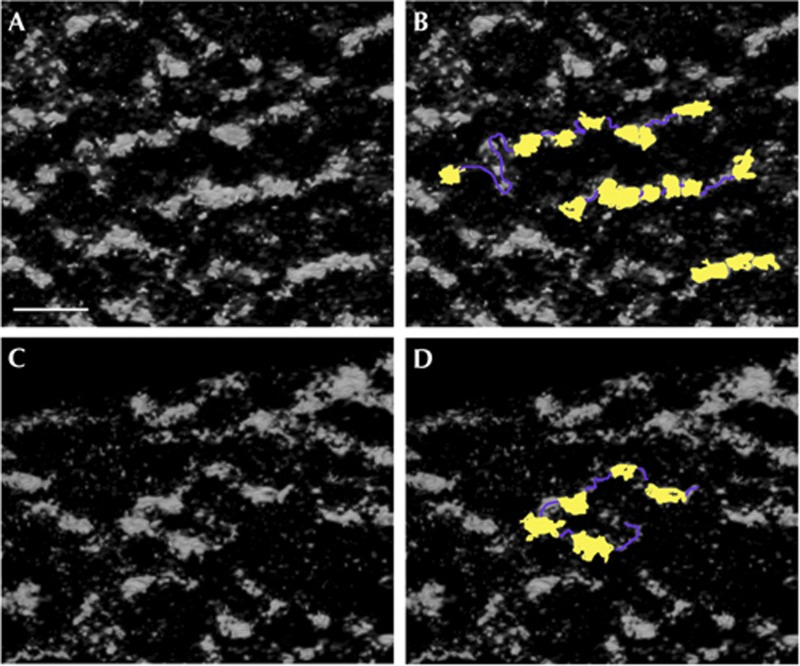
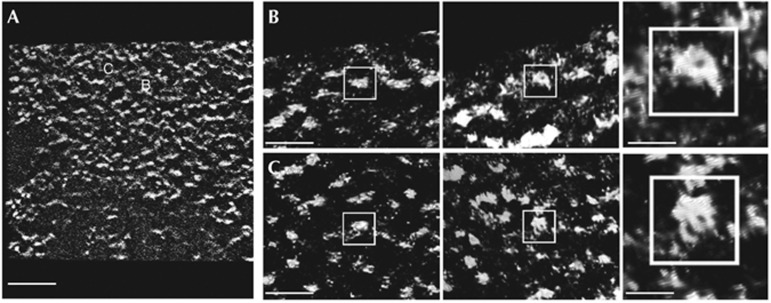
To confirm that the fibres observed within the MEF nuclei were in fact 10-nm nucleosome fibres, we acquired higher-magnification data sets where individual nucleosomes and intervening linker DNA could now be resolved (Fig 2; supplementary Movie S2 online). Fibres within the densely packed chromocentre domains were often highly bent and folded (supplementary Fig S2 online). The resolution of these data sets was even sufficient to detect the gyres of phosphorus-rich DNA fibres confined to the perimeter of the phosphorus-poor protein-rich core histone octamer; rotation of high-resolution tomograms revealed both side views and en face views of individual nucleosomes (Fig 3; supplementary Movie S3 online).
Figure 2.
Ten-nanometre nucleosomal chromatin fibres in a mouse embryonic fibroblast chromocentre are visualized using ESI tomography in situ. Tomographic slices of phosphorus maps in (A,C) showing strings of nucleosomes, with cartoon representations in (B,D); nucleosomes are false coloured yellow and intervening linker DNA purple. Scale bar, 50 nm in all panels. ESI, electron spectroscopic imaging.
Figure 3.
Nucleosome, both side and en face views, are resolved using ESI tomography, enabling visualization within a MEF chromocentre in situ. (A) Central slice of the MEF chromocentre tomogram rendered with Chimera (chromatin in white on black background). (B,C) Two examples of nucleosome structures visualized with phosphorus map reconstructions showing side views (left) and en face views (middle) and digitally zoomed (right) of individual nucleosomes. Scale bar, 100 nm in (A), 34 nm in (B) and 12 nm in high-magnification insets (right panels). ESI, electron spectroscopic imaging; MEF, mouse embryonic fibroblast.
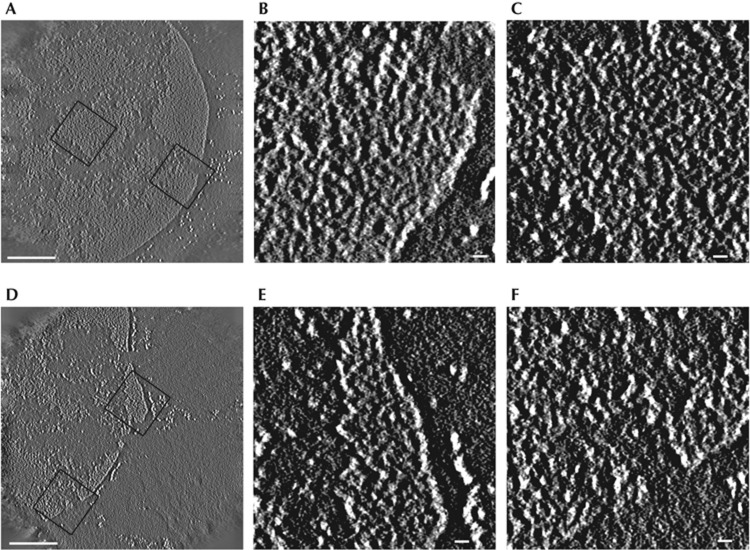
We then asked whether the genomic organization of MEFs, comprising entirely 10-nm chromatin fibres, was a nuclear morphology artefact of in vitro cell culture. Hence, we analysed a variety of mouse tissues by ESI and selected both spleen lymphocytes and liver cells for tomographic analysis. In contrast to MEFs, lymphocytes have an exceptionally high representation of compact chromatin domains throughout the nucleus. We thus expected that this cell type would provide the best opportunity for observing 30-nm and higher-order chromatin fibre structures, assuming that such fibres are required for forming compact chromatin domains. After tomographic reconstruction, we observed that these densely packed, chromatin domains were exclusively configured as 10-nm chromatin fibres (Fig 4A–C; supplementary Fig S2 online). In addition to lymphocyte cells, we performed tomographic analysis of the liver tissue cells, where both dispersed and compact chromatin domains are well represented [22] (Fig 4D–F). Measurements from tomographic reconstructions once again show that both the open and closed domains of the liver cell nuclei comprise 10-nm chromatin fibres.
Figure 4.
Chromatin fibres in mouse tissues comprise exclusively 10-nm chromatin fibres. (A) Central plane of the tomogram of a spleen lymphocyte nucleus where individual chromatin fibres can now be resolved using ESI tomography. Enlarged regions (boxes) are shown in (B,C), revealing the 10-nm chromatin fibres that populate these highly compact domains prevalent in spleen lymphocytes. (D) Central slice of phosphorus map tomogram (white on black background) of a liver nucleus from mouse tissue; both open and closed chromatin domains populate these nuclei in this tissue type. The chromatin fibres within the open and closed domains are distinguishable and found to be 10 nm, enlarged regions (boxes) in (E,F). Scale bar, 0.5 μm in panels (A,D) and 30 nm in panels (B,C,E,F). ESI, electron spectroscopic imaging.
Despite the fact that the bulk genome is organized into 10-nm chromatin fibres, distinctive domains of compact, biochemically marked, heterochromatin and more open domains are evident, pronounced in the MEF cells (Fig 1B). However, what ultimately dictates how these domains are formed or maintained remains to be determined. The fibres within the more compact heterochromatin regions are more densely packaged and folded (supplementary Fig S2 online), indicating a role for factors that modulate fibre–fibre distances and fibre bending, two parameters that would establish the local domains of compaction.
The absence of 30-nm chromatin fibres in somatic cells, although surprising, is consistent with recent studies by both the Dekker laboratory [23, 24] and Eltsov et al [25, 26]. In a whole-genome analysis using three-C molecular biology methodologies, the Dekker group found that yeast chromatin is best modelled by a 10-nm chromatin fibre, and using the high-C technique they found that both open and closed domains of a lymphocyte cell line were best modelled by a single chromatin fibre type rather than a hierarchy of fibre types [24]. In addition, cryoEM images of cryo-preserved mitotic chromosomes obtained by Eltsov et al [25] revealed only 10-nm chromatin fibres. These findings have been recently substantiated by small-angle X-ray scattering analysis of human mitotic chromosomes [26]. A formal possibility raised by the authors is that the 10-nm chromatin fibres populating the mitotic chromosome could have arisen from ‘polymer melting’, in which similar frequencies of inter-fibre and intra-fibre contacts could disrupt the 30-nm fibre conformation. Our demonstration of only 10-nm chromatin fibres in chromatin domains of widely differing densities argues against the ‘polymer melt’ explanation.
In the spleen lymphocytes, where we observed the highest levels of compact chromatin, we also observed the most pronounced fibre bending (Fig 4C) and a very regular spacing between 10-nm chromatin fibres (Fig 4C). We thus applied a Fourier analysis, enabling the calculation of both chromatin fibre size in three dimensions and potentially the distance between fibres if a regular spacing were sufficiently represented to be detected in Fourier space. The Fourier analysis confirmed the image analysis, showing a frequency peak correlating to 10.2-nm chromatin fibres in these very densely packaged domains. Remarkably, we observed a strong peak in the Fourier spectrum correlating to 39 nm. Re-examining the real space images confirmed that this 39-nm peak corresponds to a fibre–fibre spacing that is far greater than the single fibre diameter (supplementary Fig S3 online). We speculate that this very regular spacing of 10-nm chromatin fibres within these domains gave rise to the 30-nm spacing measurements revealed by low-angle X-ray scattering experiments of intact nuclei [21]. We also observed a 20-nm Fourier transform peak and a very strong 43-nm peak. Comparing the Fourier transform with real space measurements (described earlier), we conclude that in the starfish sperm the fibre–fibre spacing is ∼20 nm.
The primary role of the histone octamer is to compact DNA into the cell nucleus. This is accomplished by balancing the negative charge of the DNA and by decreasing the effective length of the genome [8]. The conventional model of chromatin is that higher-order fibres, such as the 30-nm chromatin fibre, augment the required shortening function of the nucleosome itself. Alternatively, frequent folding or bending of the 10-nm nucleosomal fibre could accomplish the same thing. Our data support the latter. The interconversion of 10- to 30-nm chromatin fibres does not represent a principal gene-regulatory mechanism, and is not required for regulation. However, the protein factors, which regulate transitions between 10- and 30-nm chromatin studied with in vitro model systems [27, 28], are probably the same factors responsible for modulating the nucleosome repeat length, the degree of folding or bending of 10-nm chromatin fibres, and the spacing between them. Future studies will address this question.
Methods
Cell culture and tissue preparation. Patiria miniata testis and mouse tissues were isolated and fixed overnight in 2% glutaraldehyde. Primary embryonic fibroblasts (MEFs) were isolated from 15.5-day mouse embryos and cultured in standard conditions and processed as previously described for correlative LM/ESI [29] using a rabbit H3K9me3 antibody. In fixation control experiments, immortalized MEFs were high-pressure frozen in liquid nitrogen (Leica) and infiltrated with resin by freeze substitution (Leica). Samples were embedded in Quetol or LRwhite as previously described [13]. Seventy-nanometre sections (Leica ultramicrotome) were coated with 3-nm carbon films to improve sample stability. Ten-nanometre gold particles were used as fiducials for tomographic reconstructions.
Data acquisition and analysis. SerialEM [16] was used to acquire the high-magnification phosphorus tilt series over a tilt range of ±60°. ESI image pairs were collected at 120 and 155 eV every 2° using a Tecnai20 transmission electron microscope operated at 200 kV, equipped with a GATAN imaging filter. Image stacks were aligned using IMOD [30], and processed into phosphorus ratio maps using IMOD [30], SPARX [31] and ImageJ. The SIRT algorithm (IMOD implementation) was used to generate [7, 15] 3D maps from the aligned image series. Chimera [32] was used to render 3D images and generate perspective maps and movies
Combined zero tilt images using ESI were acquired at 120 and 155 eV, and 385 and 415 eV to generate the phosphorus and nitrogen ratio maps, respectively. ESI images were processed using Adobe Photoshop 7.0 as previously described [13]. Phosphorus maps were overlaid onto the normalized nitrogen maps to represent chromatin (coloured yellow) and protein-rich structures (coloured blue). The resolution of these images ranged from 1.3 to 2.56 nm per pixel depending on the magnification
Chromatin fibres were measured in three dimensions using ImageJ and digital micrograph. The connectivity of nucleosomal fibres was confirmed by tumbling 3D phosphorus maps of the 70-nm sections with the phosphorus electron density displayed in Chimera
Fourier transform analysis was carried out by summing the power spectra of overlapping subareas of the most compact chromatin regions in a central 13-nm tomographic slice from each tomogram. RNA-containing structures were avoided in the analysis. The edges of individual fibres were identified by Canny edge detection (ImageJ) and their power spectra were then rotationally averaged using SPARX to yield a one-dimensional trace. The spectra were normalized by integral area and averaged to give a single representative profile of reciprocal distances.
Supplementary information is available at EMBO reports online (http://www.emboreports.org).
Supplementary Material
Acknowledgments
We thank P. Singh for antibodies, W. Errington, L. Rapkin, R. Ching, R. Temkin and D. Holmyard for intellectual and technical contributions. This work was supported by funds from the Canadian Institutes of Health Research to D.P.B.-J. (MOP-111153) and to J.E. (MOP-111065 and IG1-102956). D.P.B.-J. also holds an operating grant from the Natural Sciences and Engineering Research Council for this work.
Author contributions: D.P.B.-J., J.E., E.F., M.S. and U.D. conceived and designed the experiments. E.F., U.D., R.L., K.A. and M.H. prepared the samples. E.F., M.S. and R.L. acquired the tomographic data. M.S., E.F. and D.P.B.-J. processed and analysed these data. D.P.B.-J. holds the Canada Research Chair in Molecular and Cellular Imaging.
Footnotes
The authors declare that they have no conflict of interest.
References
- Belmont AS, Bruce K (1994) Visualization of G1 chromosomes: a folded, twisted, supercoiled chromonema model of interphase chromatid structure. J Cell Biol 127: 287–302 [DOI] [PMC free article] [PubMed] [Google Scholar]
- Finch JT, Klug A (1976) Solenoidal model for superstructure in chromatin. Proc Natl Acad Sci USA 73: 1897–1901 [DOI] [PMC free article] [PubMed] [Google Scholar]
- Gilbert N, Boyle S, Fiegler H, Woodfine K, Carter NP, Bickmore WA (2004) Chromatin architecture of the human genome: gene-rich domains are enriched in open chromatin fibers. Cell 118: 555–566 [DOI] [PubMed] [Google Scholar]
- Kruithof M, Chien FT, Routh A, Logie C, Rhodes D, van Noort J (2009) Single-molecule force spectroscopy reveals a highly compliant helical folding for the 30-nm chromatin fiber. Nat Struct Mol Biol 16: 534–540 [DOI] [PubMed] [Google Scholar]
- Robinson PJ, Fairall L, Huynh VA, Rhodes D (2006) EM measurements define the dimensions of the ‘30-nm’ chromatin fiber: evidence for a compact, interdigitated structure. Proc Natl Acad Sci USA 103: 6506–6511 [DOI] [PMC free article] [PubMed] [Google Scholar]
- Horowitz RA, Agard DA, Sedat JW, Woodcock CL (1994) The three-dimensional architecture of chromatin in situ: electron tomography reveals fibers composed of a continuously variable zig-zag nucleosomal ribbon. J Cell Biol 125: 1–10 [DOI] [PMC free article] [PubMed] [Google Scholar]
- Naughton C, Sproul D, Hamilton C, Gilbert N (2010) Analysis of active and inactive X chromosome architecture reveals the independent organization of 30 nm and large-scale chromatin structures. Mol Cell 40: 397–409 [DOI] [PMC free article] [PubMed] [Google Scholar]
- Fussner E, Ching RW, Bazett-Jones DP (2011) Living without 30nm chromatin fibers. Trends Biochem Sci 36: 1–6 [DOI] [PubMed] [Google Scholar]
- Maeshima K, Hihara S, Eltsov M (2010) Chromatin structure: does the 30-nm fibre exist in vivo? Curr Opin Cell Biol 22: 291–297 [DOI] [PubMed] [Google Scholar]
- Tremethick DJ (2007) Higher-order structures of chromatin: the elusive 30 nm fiber. Cell 128: 651–654 [DOI] [PubMed] [Google Scholar]
- Woodcock CL (1994) Chromatin fibers observed in situ in frozen hydrated sections. Native fiber diameter is not correlated with nucleosome repeat length. J Cell Biol 125: 11–19 [DOI] [PMC free article] [PubMed] [Google Scholar]
- Ahmed K, Dehghani H, Rugg-Gunn P, Fussner E, Rossant J, Bazett-Jones DP (2010) Global chromatin architecture reflects pluripotency and lineage commitment in the early mouse embryo. PLoS One 5: e10531. [DOI] [PMC free article] [PubMed] [Google Scholar]
- Ahmed K, Li R, Bazett-Jones DP (2009) Electron spectroscopic imaging of the nuclear landscape. Methods Mol Biol 464: 415–423 [DOI] [PubMed] [Google Scholar]
- Bazett-Jones DP, Ottensmeyer FP (1981) Phosphorus distribution in the nucleosome. Science 211: 169–170 [DOI] [PubMed] [Google Scholar]
- Aronova MA, Kim YC, Harmon R, Sousa AA, Zhang G, Leapman RD (2007) Three-dimensional elemental mapping of phosphorus by quantitative electron spectroscopic tomography (QuEST). J Struct Biol 160: 35–48 [DOI] [PMC free article] [PubMed] [Google Scholar]
- Mastronarde DN (2005) Automated electron microscope tomography using robust prediction of specimen movements. J Struct Biol 152: 36–51 [DOI] [PubMed] [Google Scholar]
- Fussner E, Ahmed K, Dehghani H, Strauss M, Bazett-Jones DP (2010) Changes in chromatin fiber density as a marker for pluripotency. Cold Spring Harb Symp Quant Biol 75: 245–249 [DOI] [PubMed] [Google Scholar]
- Rego A, Sinclair PB, Tao W, Kireev I, Belmont AS (2008) The facultative heterochromatin of the inactive X chromosome has a distinctive condensed ultrastructure. J Cell Sci 121: 1119–1127 [DOI] [PubMed] [Google Scholar]
- Guenatri M, Bailly D, Maison C, Almouzni G (2004) Mouse centric and pericentric satellite repeats form distinct functional heterochromatin. J Cell Biol 166: 493–505 [DOI] [PMC free article] [PubMed] [Google Scholar]
- Bazett-Jones DP (1992) Electron spectroscopic imaging of chromatin and other nucleoprotein complexes. Electron Microsc Rev 5: 37–58 [DOI] [PubMed] [Google Scholar]
- Langmore JP, Paulson JR (1983) Low angle x-ray diffraction studies of chromatin structure in vivo and in isolated nuclei and metaphase chromosomes. J Cell Biol 96: 1120–1131 [DOI] [PMC free article] [PubMed] [Google Scholar]
- Rapkin LM, Anchel DR, Li R, Bazett-Jones DP (2012) A view of the chromatin landscape. Micron 43: 150–158 [DOI] [PubMed] [Google Scholar]
- Dekker J (2008) Mapping in vivo chromatin interactions in yeast suggests an extended chromatin fiber with regional variation in compaction. J Biol Chem 283: 34532–34540 [DOI] [PMC free article] [PubMed] [Google Scholar]
- Lieberman-Aiden E et al. (2009) Comprehensive mapping of long-range interactions reveals folding principles of the human genome. Science 326: 289–293 [DOI] [PMC free article] [PubMed] [Google Scholar]
- Eltsov M, Maclellan KM, Maeshima K, Frangakis AS, Dubochet J (2008) Analysis of cryo-electron microscopy images does not support the existence of 30-nm chromatin fibers in mitotic chromosomes in situ. Proc Natl Acad Sci USA 105: 19732–19737 [DOI] [PMC free article] [PubMed] [Google Scholar]
- Nishino Y et al. (2012) Human mitotic chromosomes consist predominantly of irregularly folded nucleosome fibres without a 30-nm chromatin structure. EMBO J 31: 1644–1653 [DOI] [PMC free article] [PubMed] [Google Scholar]
- Kan PY, Caterino TL, Hayes JJ (2009) The H4 tail domain participates in intra- and internucleosome interactions with protein and DNA during folding and oligomerization of nucleosome arrays. Mol Cell Biol 29: 538–546 [DOI] [PMC free article] [PubMed] [Google Scholar]
- McBryant SJ, Lu X, Hansen JC (2010) Multifunctionality of the linker histones: an emerging role for protein-protein interactions. Cell Res 20: 519–528 [DOI] [PMC free article] [PubMed] [Google Scholar]
- Dellaire G, Nisman R, Bazett-Jones DP (2004) Correlative light and electron spectroscopic imaging of chromatin in situ. Methods Enzymol 375: 456–478 [DOI] [PubMed] [Google Scholar]
- Kremer JR, Mastronarde DN, McIntosh JR (1996) Computer visualization of three-dimensional image data using IMOD. J Struct Biol 116: 71–76 [DOI] [PubMed] [Google Scholar]
- Hohn M, Tang G, Goodyear G, Baldwin PR, Huang Z, Penczek PA, Yang C, Glaeser RM, Adams PD, Ludtke SJ (2007) SPARX, a new environment for cryo-EM image processing. J Struct Biol 157: 47–55 [DOI] [PubMed] [Google Scholar]
- Pettersen EF, Goddard TD, Huang CC, Couch GS, Greenblatt DM, Meng EC, Ferrin TE (2004) UCSF Chimera--a visualization system for exploratory research and analysis. J Comput Chem 25: 1605–1612 [DOI] [PubMed] [Google Scholar]
Associated Data
This section collects any data citations, data availability statements, or supplementary materials included in this article.


