

Abstract
Forming place-reward associations critically depends on the integrity of the hippocampal–ventral striatal system. The ventral striatum (VS) receives a strong hippocampal input conveying spatial-contextual information, but it is unclear how this structure integrates this information to invigorate reward-directed behavior. Neuronal ensembles in rat hippocampus (HC) and VS were simultaneously recorded during a conditioning task in which navigation depended on path integration. In contrast to HC, ventral striatal neurons showed low spatial selectivity, but rather coded behavioral task phases toward reaching goal sites. Outcome-predicting cues induced a remapping of firing patterns in the HC, consistent with its role in episodic memory. VS remapped in conjunction with the HC, indicating that remapping can take place in multiple brain regions engaged in the same task. Subsets of ventral striatal neurons showed a “flip” from high activity when cue lights were illuminated to low activity in intertrial intervals, or vice versa. The cues induced an increase in spatial information transmission and sparsity in both structures. These effects were paralleled by an enhanced temporal specificity of ensemble coding and a more accurate reconstruction of the animal's position from population firing patterns. Altogether, the results reveal strong differences in spatial processing between hippocampal area CA1 and VS, but indicate similarities in how discrete cues impact on this processing.
Introduction
The hippocampal–ventral striatal projection is believed to mediate spatial information gaining control over behavior. Hippocampal neurons show spatially selective firing patterns that may collectively code a spatial map of the environment (O'Keefe and Dostrovsky, 1971; O'Keefe and Nadel, 1978; Wilson and McNaughton, 1993). In addition to coding spatial aspects of the environment, hippocampal firing patterns are sensitive to a number of other features such as the animal's state, static cues, task context, and attentional processes (Muller and Kubie, 1987; Markus et al., 1995; Leutgeb et al., 2005; Fenton et al., 2010). The ventral striatum (VS) appears to use hippocampal inputs to regulate approach or avoidance responses to locations associated with reward or punishment (Annett et al., 1989; Sutherland and Rodriguez, 1989; Ito et al., 2008). In addition, the VS is essential for hippocampus (HC)-dependent contextual conditioning and context-dependent reinstatement of drug taking (Riedel et al., 1997; Fuchs et al., 2004; Ito et al., 2008). Other limbic cortical structures, such as the basolateral amygdala (BLA), medial prefrontal cortex (mPFC), and midline thalamic nuclei project to ventral striatal subregions that also receive convergent hippocampal inputs (Pennartz et al., 1994; Mulder et al., 1998; Voorn et al., 2004). The BLA, for example, likely conveys information about discrete stimuli associated with valuable outcomes to enable the VS to mediate invigorating effects of Pavlovian cues over behavior (Aggleton et al., 1981; Everitt et al., 1989; Seamans and Phillips, 1994; Ito et al., 2006, 2008).
Despite our greater understanding of this system, it is not yet clear how neural ensembles in the VS incorporate spatial information to respond to motivationally relevant cues and contexts. As the first main aim of our study was to assess the spatial dependence of VS neurons, we probed their task-related coding properties while rats performed an appetitive conditioning task requiring path-integration (Ito et al., 2006). These properties were compared with simultaneously recorded hippocampal CA1 neurons. Whereas hippocampal neurons were predicted to show clear “place fields” in the rotationally symmetric task environment, the VS was expected to show weaker spatial selectivity due to the influence of converging inputs at the cellular level, although previous studies have suggested spatially selective firing patterns in VS (Lavoie and Mizumori, 1994; Shibata et al., 2001; Mulder et al., 2005).
In episodic memory formation, the HC has been hypothesized to function as a “memory separator” because environment- or behavior-induced firing rate modulation (remapping) creates distinct spatial maps for different episodic events or environments. This feature allows for the coding and storage of a large number of similar experiences with only minimal interference (Leutgeb et al., 2005). This hypothesis implies the prediction that remapped representations are projected to target areas of HC such as neocortex and the VS, but it is unknown how coding in these areas is changed during hippocampal remapping. As a second main aim, we examined this question by assessing the influence of temporally discrete, reward-predicting cues on HC and VS coding.
Materials and Methods
Subjects, surgery, recordings, and histology
Seven male Wistar rats (300–450 g) were housed in an environmentally regulated facility and maintained on a reversed 12 h light-dark cycle (lights off at 7:00 A.M.). Behavioral testing and recordings were performed in the animal's active period. Rats were maintained at 85–95% of their free-feeding body weight by restricted food intake. Water was available ad libitum. All experimental procedures were in accordance with the National guidelines on the conduct of animal experiments. Three rats were chronically implanted with a multitetrode microdrive for the recording of spike trains of individual neurons and local field potentials from dorsal hippocampal area CA1 and VS simultaneously (cf. Lansink et al., 2007). A bundle of five tetrodes was directed to area CA1 (4.0 mm posterior and 2.5 mm lateral to bregma) and a bundle of seven tetrodes to VS (1.8 mm anterior and 1.4 mm lateral to bregma). Reference electrodes were advanced to the corpus callosum overlying the HC and to the hippocampal fissure. A skull screw inserted in the contralateral parietal bone was connected to ground. Animals were allowed to recover ∼1 week before recordings commenced.
The final position of each tetrode was marked with a small electrically induced lesion (25 μA, 10 s) before rats were transcardially perfused with a 0.9% NaCl solution, followed by 4% paraformaldehyde in PBS (0.1 m; pH 7.4). Coronal sections (40 μm) of HC and VS were cut on a Vibratome and Nissl stained. Recording locations were reconstructed using the tetrode endpoints and the track records of adjustments along the dorsoventral axis. Hippocampal recording sites were verified to be in the CA1 region (Fig. 1). Of the VS recordings, 78% were from the core, whereas 22% were shell recordings. VS recordings were pooled because no gross differences in number of recorded units, firing rate, or presence of behavioral correlates were observed between the subregions.
Figure 1.

Histological verification of recording sites in the HC and VS. Tetrode endpoints in the HC (A) and VS (B) are represented by black dots. B, Colored panels in the ventral striatal graphs indicate per rat the estimated area where recordings were taken based on tetrode tracks visible in the brain sections and daily records of downward tetrode advancement. Units were recorded from both the ventral striatal core (∼78%) and shell (∼22%) area. Note that ensembles from individual sessions could contain both core and shell units. Numbers indicate distance from bregma on the anterior–posterior axis in millimeters. Graphs adapted from Paxinos and Watson (1986).
Behavioral apparatus and procedures
Experimental sessions took place in a custom-built, Y-shaped apparatus consisting of three identical chambers situated around an equilateral triangle in the center (Fig. 2). The walls of the apparatus (42.5 cm high) as well as the central platform were constructed of antistatic plastic whereas the flooring of the chambers consisted of a rod grid positioned over a tray containing regular bedding material. Rims of 5 cm were placed on the floor along the walls under a 45° angle to prevent extensive contact between the rat's head stage and wall surface. Individual chambers were separated from the central platform through partial walls, which left a passageway of 10 cm between the compartments and by a small doorstep (height: 2 cm).
Figure 2.

Cue and context conditioning in the Y-maze. A, The maze consisted of three identical chambers situated around a triangular platform and each chamber contained three cue lights with a reward well underneath. In the cue-conditioning sessions a nose-poke response into the well associated with a light resulted in reward delivery (middle, magenta well). In context-conditioning sessions, reward probability after a correct response to a cue light depended on the location of the chamber (middle and right; 75 and 25% probability, respectively). B, Average percentage of correct nose pokes to cues across behavioral sessions (n = 7 rats; P = probe session; gray: SEM). C, Mean percentage (±SEM) of nose pokes during ITIs indicates a preference for the highly rewarded chamber during context but not cue-conditioning sessions. Place preference was confirmed in a context-conditioning test (CX). A probe session (P) indicated that the place preference was not aligned to uncontrolled environmental cues (*MWU, p < 0.005). Results for recorded rats (n = 3) were similar to the entire group shown above. Mean percentage of ITI nose pokes in 75% chamber vs 25% chambers: cue sessions: 32.5 ± 1.4 vs 33.7 ± 0.7; context sessions: 55.4 ± 2.1 vs 22.3 ± 1.1; CX test: 37.9 ± 3.6 vs 31.1 ± 1.8; probe test: 56.5 ± 1.4 vs 21.8 ± 0.7%.
The interior of the three chambers was identical and comprised for each wall a cue light with a fluid well located underneath (i.e., three light-well combinations per chamber, nine in total). Each well was equipped with an infrared light beam to detect nose pokes and was supplied with sucrose solution by a separate gravity-driven system controlled by a solenoid valve. Opening and closing of the valve was accompanied by a weak sound, muted by the fluid and valve construction. All fluid-delivery systems were calibrated before each behavioral session to ensure that equal amounts of solution were dispensed at each valve opening within and between systems. The chambers also contained a house light and three parallel infrared photobeams.
The Y-maze was placed on a rotatable platform in a square enclosure of black curtains (side 2 m) within a small room, which was dimly lit by a red light. The Y-maze apparatus was computer controlled, preventing human interference while the rat was running the task, and was interfaced with the recording system to ensure synchronized time stamping of behavioral events and neuronal activity patterns. The data-acquisition system and experimenters were situated in an adjacent room, which prevented these sources of noise from interfering with rat behavior. To remove possible odor traces the apparatus was wiped with ethanol (70%) and the bedding below the floor grids of the chambers was cleaned after each session. Before each session, the maze was rotated 120° or 240° such that the chambers interchanged position in space but the Y shape stayed consistent with respect to geometrical coordinates.
Pretraining and habituation.
Rats were pretrained in a singular conditioning chamber to spontaneously poke their nose in a fluid well for a sucrose solution reward (15%, 50 μl), ensuring a robust instrumental response in the experimental phase. This separate conditioning chamber shared dimensions and most other features with the individual chambers of the Y-maze, but it had black and white striped walls and contained only one cue light and associated fluid well. A session consisted of 30 nose poke–reward pairings that were separated by a mandatory visit to the distant side of the chamber. Over the course of 10–12 sessions, the poke duration required to earn a reward was progressively increased from 150 to 1000 ms. Before the first day of conditioning animals were habituated to the Y-maze by a 20 min free exploration period.
Y-maze behavioral paradigm.
The behavioral paradigm started with a phase of cue conditioning in which rats learned that a nose-poke response in a reward port underneath a lit cue light resulted in the delivery of a sucrose solution reward. This phase was followed by context-conditioning sessions in which the probability of receiving a reward following a cued nose poke response was dependent on the spatial location of chamber containing the illuminated cue light. Two behavioral tests were performed at the conclusion of the paradigm. A context-conditioning test was performed to assess the rat's memory for the reward contingencies across chambers and a probe test was inserted to investigate whether the rat's navigation was based on an association between the rat's internal directional system (i.e., path navigation system) and controlled cues provided during an orientation procedure before the sessions. The different task components (i.e., cue and context conditioning, context test, and probe test) were designed to provide behavioral measures to ensure that the task was based on spatial-contextual information, and required the use of path integration and that performance was not confounded by uncontrolled external cues. A detailed description of the paradigm components is provided below.
Orientation procedure.
Each Y-maze session started with a period of 3 min in which the rat was allowed to orient itself on the maze environment. During this period, it was placed on a pedestal from which it could oversee the Y-maze and its curtained enclosure. A polarizing reference light located in the corner of the enclosure was the main source of illumination and brightly colored cue cards were exposed providing additional distal cues to the rat. After 3 min, the rat was transferred to the Y-maze and allowed to explore this for another 30 s before the reference light was switched off and the distal cues were removed. From this moment on there were no external local or distal environmental cues available that would allow the rat to determine its own position relative to the maze environment. The experimenter then left the room and observed the rat from an adjacent room. This orientation procedure was followed rigidly to establish a stable association between the external visual environment and the internal path-integration system of the rat, which would serve to set an appropriate spatial reference frame on subsequent visits. Because the polarizing light and the cue cards were available only during the orientation period and not during the task, rats were required to base their navigation during the session on their path integration system. Previous behavioral studies have indicated that such an orientation procedure was necessary for rats to develop a place preference in a very similar behavioral task with a probabilistic reward schedule across chambers set in a rotationally symmetric Y-maze (Ito et al., 2006, 2008). Furthermore, these studies showed that this task setup requires a functional hippocampal–ventral striatal circuitry because bilateral lesions of the dorsal HC or disconnection lesions between the dorsal HC and the nucleus accumbens shell impaired place preference development. At the neuronal level it has been shown that established hippocampal place fields could be maintained and preserved on the basis of path integration alone, even in the absence of external (visual) cues (cf. McNaughton et al., 1996).
Cue conditioning.
During cue-conditioning sessions rats learned the association between a discrete cue, i.e., illuminated cue light, and reward availability. All sessions consisted of 135 trials initiated by cue light presentation. Nose-poke responses into the fluid well underneath an illuminated cue light were rewarded with sucrose solution (15%; 70 μl) when the nose poke lasted at least 500 ms and occurred within 15 s after cue onset. Responses to other ports in this period were neither rewarded nor punished. Cue lights were dimmed after a random interval between 1 and 4 s after reward delivery or when the maximum response time of 15 s had elapsed, following which an intertrial interval (ITI; randomly selected between 10 and 20 s) started. The ITI duration doubled when the rat failed to cross the photobeam located between its current compartment and the central triangular area. Cue lights were lit in a pseudorandom pattern: within a block of nine cue presentations, each of the lights would be selected once. The order of cue presentations, however, was randomized separately for each block. Rats were trained on this cue-conditioning task phase until they reached a criterion of 90% correct responses in the first 90 trials in three consecutive sessions.
Context conditioning.
Subsequently, rats ran five sessions of 135 trials each in the context-conditioning phase where the probability of reward following a nose poke depended on the chamber's spatial position. In contrast to cue-conditioning sessions, reward probability was 75% for one of the chambers, the location of which was different for each rat, whereas the other two chambers yielded reward in only 25% of the trials. Reward was pseudorandomly distributed across correctly performed trials: one of four (25%) or three of four (75%) trials were rewarded within a block of four trials at a given port. Reward size was increased to 120 μl sucrose solution (15%) to keep the total available reward amount constant relative to cue conditioning. Regardless of whether a nose poke was rewarded or not, the sound of an opening and closing solenoid valve was presented every trial. All other parameters were identical to the cue-conditioning phase.
Context-conditioning test.
Following the fifth context-conditioning session, rats were tested for their preference for a particular chamber in a context-conditioning test, in which rats explored the Y-maze for 15 min in the absence of cues and rewards. The degree of conditioned place preference was assessed by comparing the number of photobeam breaks and fluid pokes occurring in each chamber during the first 5 min of the test. Because no cues and rewards are provided, a place preference is based on the memory for the association between location and reward probability formed in the previous days of conditioning.
Probe test.
A probe test examined whether behavior was guided by experimenter-controlled cues presented during the orientation period (i.e., reference light and cue cards on curtain walls) and path-integration information instead of uncontrolled cues (e.g., potential noises from the hallway adjacent to the testing room). In the probe test, the Y-maze, reference light, and distal cues were all rotated 90° before the rat entered the recording environment. Except for the different alignment of the Y-maze including distal cues to the geometrical coordinates of the room, the probe test was a regular context-conditioning session.
Validation of behavioral paradigm
Figure 2 presents data from a behavioral study (n = 4 rats) and from three rats that were implanted with tetrode arrays for recording of neural activity; these data were similar and therefore pooled. The main goal of this study was to validate that the paradigm, modified after Ito et al. (2006, 2008) resulted in navigation and conditioned place preference based on path integration, which relates to our first main aim to test the spatial dependence of VS neurons. The second goal was to validate the use of lights as discrete cues segregated from context-conditioning effects.
Rats used 4–14 (mean ± SEM 7.3 ± 1.3) cue-conditioning sessions to reach a criterion performance of >90% correct nose-poke responses to cued reward ports in three consecutive sessions (Fig. 2B). In subsequent context-conditioning sessions, in which reward probability was dependent on the spatial location of the chamber, rats maintained a high response level. Rats developed a preference for the chamber location that was paired with 75% probability as indicated by a higher number of ITI “checking” nose pokes in that chamber compared with the other two chambers [Mann–Whitney U test (MWU), p < 0.005; Fig. 2C]. This difference was absent in cue-conditioning sessions, indicating that the rats did not have a preexisting bias for a particular chamber. Rats confirmed their place preference in a separate context-conditioning test. In this test, where rats explored the Y-maze without cue and reward presentations, the number of nose pokes executed in the 75% rewarded chamber was higher than in the 25% chambers (MWU, p < 0.005).
A probe session in which Y-maze and room cues were rotated 90° showed that the place preference was expressed under control of the reference light and cue cards that were presented to the rat in the orientation period before each session. In this probe session, the rat's place preference corotated with the altered orientation of the Y-maze and the distal cues. Had the behavior of the rats been guided by uncontrolled external cues, a 90° misalignment of the Y shape and room cues would have disrupted the learned association between the maze and any uncontrolled cues, and would therefore have interfered with place preference.
In conclusion, these behavioral results show that rats were able to distinguish different chamber locations of the Y-maze, and that their behavior could not be ascribed to guidance by external cues, but was instead based on path integration (cf. Ito et al., 2006). In addition, the lights above the nine reward ports proved to be effective conditioning cues. Our main results will concern the spatial coding of VS neurons, as based on path integration, regardless of task phase. However, we did find a difference in sparsity of spatial firing patterns in the HC between cue and context-conditioning sessions (Table 1).
Table 1.
Properties of hippocampal and ventral striatal unit firing in the spatial domain
| HC | VS | |
|---|---|---|
| Neurons analyzed | 194 | 195 |
| Mean firing rate | 0.7 ± 0.1 Hz | 0.5 ± 0.1 Hz |
| Raw firing area | 928.6 ± 453.1 cm2** | 1150.1 ± 73.1 cm2** |
| Neurons exhibiting firing fields* | 148 | 60 |
| Total number of firing fields | 206 | 149 |
| Mean firing field size* | 445.2 ± 22.4 cm2 | 343.0 ± 21.8 cm2 |
| Mean peak firing rate* | 12.2 ± 0.6 Hz | 6.2 ± 0.4 Hz |
| Mean spatial information per spike* | 2.4 ± 0.1 bits/spike | 1.2 ± 0.1 bits/spike |
| Mean sparsity cue conditioning* | 87.2 ± 1.2%† | 81.1 ± 1.9 |
| Mean sparsity context conditioning* | 88.6 ± 1.2%† | 77.5 ± 2.2 |
| n | % | n | % | |
|---|---|---|---|---|
| Spatial firing classification | ||||
| Total | 148 | 100 | 142 | 100 |
| Categories HC | ||||
| Central triangle | 25 | 16.9 | — | — |
| Single Y-maze chamber | 46 | 31.1 | — | — |
| Near reward ports | 65 | 43.9 | — | — |
| Combination | 12 | 8.1 | — | — |
| Categories VS | ||||
| Entire Y-maze | — | — | 39 | 27.5 |
| Central portion Y-maze | — | — | 81 | 57.0 |
| Near reward ports | — | — | 22 | 15.5 |
Mean firing rate includes all putative principal cells that fired at least 50 spikes in the behavioral testing phase. Raw firing area indicates the cumulative area of spatial bins in which the neuron emitted at least one spike. Mean firing field size was computed for the entire Y-maze; in case a neuron exhibited multiple firing fields, only the largest field was included. Because of different spatial firing patterns, hippocampal and ventral striatal fields were classified in different categories. For instance, the category central triangle was only documented for HC because VS firing patterns invariably spilled over to chamber centers. For VS, central portion Y-maze includes firing on the triangle and the centers of the chambers.
*For comparison between areas, measures for spatial selectivity are included for both hippocampal and ventral striatal units despite the low spatial selectivity of ventral striatal firing. Parameters from mean firing rate to mean sparsity context conditioning tested significantly different between HC and VS.
**MWU p < 0.05; all others p < 0.001.
†Difference between cue and context sessions in HC: MWU p < 0.01.
Acquisition of behavioral and neural data
Neuronal activity and behavioral video tracking data were recorded using a 64-channel Cheetah data acquisition system (Neuralynx). Waveforms were saved in 1 ms windows each time the voltage signal exceeded a manually preset threshold (32 kHz; gain: 1000–5000×; filter settings: 600–6000 Hz). Local field potentials were sampled continuously at a rate of 1690 Hz (gain 500; filter settings 1–475 Hz). Light-emitting diodes on the rat's head stage allowed tracking of its position, which was conducted at 60 frames/s with a resolution of 0.4 cm/pixel.
Data analysis
Spike sorting.
Putative spike events were grouped on the basis of multiple waveform properties including peak amplitude, energy, and principal components using off-line automated and manual clustering software (MClust). MClust facilitates manual selection of clusters by allowing users to limit cluster membership based on boundaries drawn on 2D plots of the waveform features. Clusters of events that did not show a clear characteristic spike waveform, which did not separate from the noise or other clusters or showed >0.1% of spike-intervals within a 2 ms period in their interspike interval histograms were discarded. In addition, all clusters that exhibited <50 spikes in the behavioral period were not taken into account.
Putative interneurons were distinguished from putative principal cells in both structures by means of average firing rate (>8 Hz) and waveform characteristics such as low peak-to-valley width and valley shape. Putative interneurons were excluded from analysis unless noted otherwise, which resulted in the exclusion of two hippocampal units and three ventral striatal units.
The grand total of putative principal cells that were taken into analysis was 194 for HC and 195 for VS. The mean firing rate of the hippocampal neurons ranged from 0.01 to 5.8 Hz with a mean ± SEM of 0.7 ± 0.1 Hz (Table 1). These results are in line with previous work indicating that spatially selective CA1 pyramidal cells fire at 4–8 Hz when the rat walks through the place field, and that most cells fire at 0.01–0.5 Hz or stop discharging altogether at other locations (Buzsáki, 1989). The average firing rate is influenced toward lower values here also because cells that did not express a firing rate correlate were included. Ventral striatal average firing rates ranged from 0.01 to 6.1 Hz with an average ± SEM of 0.5 ± 0.1 Hz (Table 1). These values are comparable to what we have reported before (Lansink et al., 2010) but may seem to be on the lower end of the range of mean firing rate values reported in ventral striatal literature. This difference may be explained by the fact that units recorded on tetrodes can be isolated with greater detail compared with units recorded with single electrodes because of the simultaneous use of four leads to segregate waveform features (Gray et al., 1995). This method reduces the chance that spikes belonging to two neurons are erroneously considered to belong to one unit, which negatively influences the mean firing rate per unit (Lansink et al., 2007). An alternative explanation is that the distances that the rat has to travel in the Y-maze were relatively large and the ITIs were relatively long compared with previous studies using operant chambers. Thus, compared with operant chambers, there may be much more time in which the neuron is inactive in the Y-maze even if it expresses a task correlate.
The instantaneous firing rate used in Figures 3 and 4 was computed by binning spikes in intervals that matched the video-tracking resolution (60 Hz; dt = 0.0167 s). The data were convolved with a one-sided exponential kernel to let spikes add if they were close in time (kernel window 0.5 s, decay 0.1 s).
Figure 3.

Hippocampal neurons: spatial firing distributions and firing rate responses associated with reward port approach. A–O, Each blue panel shows the color-coded local instantaneous firing rate of a single neuron (scale, see bottom row), superimposed on the occupancy map of the rat (black). Maximal firing rate within the place field is noted in the lower right corner. P, Q, PETHs and rasters show firing rate responses of two cells aligned to nose pokes (t = 0; green line) into each of nine reward ports. Rows (A–C) designate chambers whereas columns indicate port location relative to chamber entrance (1, back wall; 2, left wall; 3, right wall). Cyan dots, cue onset; red triangles, reward delivery. Each row represents an individual trial, with the first trial plotted at the bottom. Statistical evaluation of the responses to individual reward ports was performed in the time window of [−2,0] s relative to nose pokes. Neurons (A–Q) were from different sessions.
Figure 4.
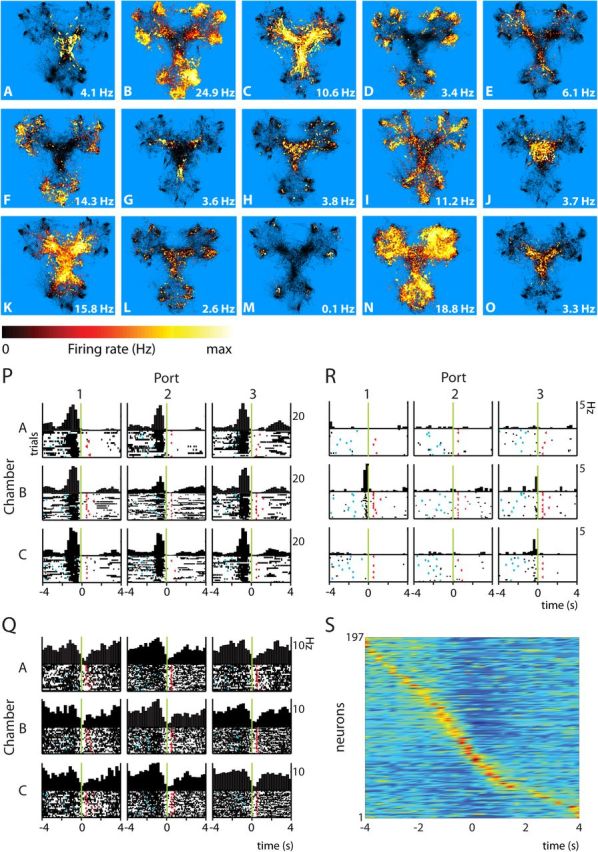
Ventral striatal neurons: spatial firing distributions and firing-rate responses associated with reward port approach. Figure follows conventions of Figure 3. A–O, Firing patterns of ventral striatal neurons were mostly rotationally symmetric and the densest firing was either found in the center of the Y-maze (A, C, J, K, O), or close to or at rewards ports (D, F, M). (P, Q, PETHs and rasters display single ventral striatal neurons that respond before or at arrival with a firing rate increase (P) or decrease (Q) to all ports. R, Neuron exhibiting responses to a few spatially unrelated ports. Neurons (A–R) were from different sessions. S, Composite histogram of the average firing pattern of all ventral striatal unit recordings, including two putative interneurons, aligned to nose-poke onset (t = 0; each row represents one neuron; color represents firing rate normalized on the cell's maximum, with maxima in red). Responses to multiple ports by a single neuron were lumped. The graph emphasizes the temporal spreading of single neuron responses in VS in relation to arrival at the goal site and associated behaviors.
Identification of spatial fields.
To characterize spatial firing fields of individual neurons, the Y-maze surface was divided into bins of 3.2 × 3.2 cm. The occupancy of a bin was derived by dividing the number of position samples per bin by the sampling rate of the video tracker system (60 frames/s). The average firing rate of a neuron at a given spatial bin was calculated as the spike count in that bin divided by occupancy time. A firing field qualified when nine or more adjacent bins showed an average firing rate greater than in 75% of the bins that contained spikes and where the occupancy of each bin was longer than 250 ms.
Spatial information and sparsity.
The spatial information of each unit's firing pattern was calculated following the method of Skaggs et al. (1993) as follows:
 |
where I is the spatial information contained in the firing field of the unit of interest, λ is the unit's average firing rate across all bins, λi is the mean firing rate in spatial bin i, and pi is the probability of the animal occupying bin i.
Spatial firing sparsity was calculated with the following equation adapted from Vinje and Gallant (2000) as follows:
 |
where S is the sparsity of the firing field of interest, and as above, λi is the mean firing rate of bin i, and pi is the probability of the animal occupying bin i.
Measure of rotational symmetry in spatial firing patterns.
Firing rate map correlations were calculated by vectorizing each occupancy-normalized rate map, and computing the Pearson's correlation coefficient across spatial bins. To quantify the rotational symmetry of rate maps across the three Y-maze chambers, the (X,Y) position samples in each chamber were rotated such that all chambers overlapped in the same region of space. Then, the spikes generated at times when the animal was in each chamber were mapped to the rotated chamber location, and the rotated rate map was calculated for each chamber using the same binning and occupancy-normalization procedures as used for the identification of spatial firing fields. The partial correlation coefficient between the rate map bins for each chamber pair was then computed by partialling out the behavioral occupancy of each chamber. This was accomplished first by regressing the rate map within each chamber against the occupancy within that chamber, then calculating the Pearson correlation of the residuals from each chamber's regressed rate map with the following equation:
 |
where ρa,b is the Pearson's correlation coefficient for rate maps a and b, λi,a is the mean firing rate of rate map a in spatial bin i, λi,b is the mean firing rate of rate map b in spatial bin i, λa is rate map a's average firing rate across all bins, λb is rate map b's average firing rate across all bins, and N is the total number of spatial bins.
Reconstruction of the animal's position from ensemble activity.
To gauge the accuracy of spatial information content in neural ensembles, population activity was used to reconstruct the animal's position. To this end, a Bayesian technique was used assuming independent, inhomogeneous, Poisson-distributed spiking (Zhang et al., 1998). A tautological regime was used to calculate the time-dependent reconstruction error, in which the whole-session spatial firing fields were used to reconstruct the animal's position throughout the session. The error, or Euclidean distance between the animal's actual and reconstructed position, was calculated for each 50 ms time bin.
Identification of firing correlates to task elements.
Perievent time histograms (PETHs) were constructed for each cue–reward port combination and neuronal firing was aligned with four task elements; i.e., cue light onset, nose poke in a reward port (for Cue On and ITI responses), valve opening (with or without reward delivery), and nose retraction from the port at the end of a trial. Firing rate responses were assessed within a 1 s time window related to the event using a bin resolution of 250 ms, except for nose poke-related responses, which were assessed over a 2 s period before a beam break. Responses to cue light onset were also analyzed using a bin size of 50 ms in the time period of [0,0.25] s relative to cue light onset.
Each response was tested for significance with two methods and had to satisfy the statistical requirements of both methods to qualify as a neuronal correlate of a task event. The bootstrap procedure tests the significance of the average firing rate within a given time bin and the comparison to ITI bins tested the trial-by-trial variability of the response relative to baseline firing. This double requirement prevented an unusually strong response in a single trial from being classified as a false positive overall response.
Bootstrap procedure.
The bootstrapping procedure was used for the comparison of a particular response within each time bin to the distribution of possible unit responses had the event occurred at times chosen at random. For a given unit, a sampling of responses was taken from 500 ms before and after each of 10,000 randomly timed “events,” chosen uniformly throughout the session (bin size 250 ms). Then, the rasters from these random events were repeatedly subsampled 10,000 times in groups of random events equal in number to the actual events measured for a given neural response, and the average firing rate in each of the four time bins was calculated for each subsample. An empirical distribution was constructed from these 10,000 subsamples and then compared with the observed firing rate. Both empirical confidence intervals and parametric confidence intervals (i.e., based on mean and SD) were calculated based on a Bonferroni-corrected base α value of p = 0.05 (accounting for the number of bins NPETH to be tested in the PETH). A significant positive bootstrap response in a given bin had to have a firing rate ranking in a percentile of greater than α/NPETH *100% and cumulative probability of occurrence lower than α/NPETH given a normal approximation of the bootstrapped data.
Comparison to intertrial test bins.
The second test that had to be satisfied for significance was to compare the spike counts in the four or eight bins (bin size 250 ms) comprising the event period to a sample of 12 separate control bins taken either from the ITI period preceding the trial or from a random sample across the session, depending on whether it was possible to match events to specific ITI intervals preceding the same trial (Lansink et al., 2009). For events matched to specific ITI intervals (i.e., cue presentations, cued nose pokes, valve openings, and nose retractions from reward port), a bin was considered to have a significant response when a two-tailed Wilcoxon matched-pairs signed rank test (WMPSR) indicated significance with respect to all of the 12 control bins (p < 0.05; cf. Cromwell and Schultz, 2003; van Duuren et al., 2007). For events that could not be matched to specific ITIs (i.e., ITI nose-pokes), a bin was considered to be a significantly different response when a two-tailed MWU indicated significance with respect to each of the 12 randomly sampled control bins (p < 0.05). An event-related response comprised one or more bins that were significantly different from control bins.
On cells where a significant response was found to an event, differences between significant responses to events at different reward ports were examined more closely. Specific temporal regions of interest with respect to the behavioral event were defined by the significant bins (WMPSR). The significance in this region of interest (ROI) across events, ports, or chambers was then assessed with a Kruskal–Wallis test (p < 0.05) followed by a post hoc MWU (p < 0.05), thus comparing bins at equivalent time point in the other conditions. Similarly, the ROIs for the Cue On and ITI phases were compared using an MWU (p < 0.05).
Results
We investigated HC and VS neural ensemble coding in a behavioral task where navigation in an environment, and discrimination of its components, was based on path integration and was not confounded by external sensory cues. Rats were trained to associate discrete cues and contexts with reward availability in a Y-shaped environment in which three sensorily identical chambers each contained three cue lights with a reward port underneath (Fig. 2; see Materials and Methods). To investigate whether neural activity patterns in the hippocampal–ventral striatal circuitry are set in an spatial framework, we recorded the activity of neuronal ensembles in HC and VS simultaneously in three rats during a total of nine cue-conditioning sessions and eight context-conditioning sessions using multichannel, tetrode techniques (Wilson and McNaughton, 1993; Lansink et al., 2007). Neuronal responses between the two conditioning tasks were generally similar and therefore pooled unless otherwise noted. Because navigation in the Y-maze is based on path integration, the hippocampal representational system for space is predicted to form one map spanning the entire Y-maze, consisting of firing fields that are unique to specific locations on the maze. Thus spatial coding is defined here by the occurrence of unique and consistent firing of neurons to specific subspaces of the environment, despite the absence of explicit cues distinguishing these subspaces. In contrast, VS firing patterns are expected to be less spatially selective because spatial information may be integrated with inputs from other brain areas reaching overlapping subpopulations of neurons.
Single unit coding in hippocampus
In a total of 194 hippocampal cells, three main categories of location-specific firing fields (i.e., place fields) could be distinguished. The first group of cells showed activity at the center of the Y-maze; firing fields mainly covered the triangular platform, sometimes including the transition areas between the platform and the three chambers (16.9%; Table 1; Fig. 3A,E,I). Another group exhibited firing fields covering most of one individual chamber (31.1%; Fig. 3C,G,N), and did not show firing patterns tuned specifically to one or more reward ports. The third group showed abnormally small firing fields located near specific reward ports in one or more chambers (43.9%; Fig. 3B,F,H,J,L,O). None of these neurons displayed firing fields at similar locations in each of the chambers, despite the fact that the chambers were identical. Similar firing fields found in two of three chambers were rarely encountered (8/65). The remaining cells exhibited firing fields that were combinations of the three main groups, thus showing multiple firing fields usually located in two chambers (8.1%; Fig. 3D).
When the coding of hippocampal cells was correlated to task events using PETHs, the large majority of firing rate increases was found to be time locked to the rat's approach of the reward ports, including nose insertion in the fluid well (273 of 291 responses, 93.8%; Table 2). Only few responses were observed in relation to other task components such as cue onset (0.7%), valve opening (1.7%), or nose retraction from the ports (3.8%). Consistent with the coding of place fields of various sizes scattered across the Y-maze, firing rate responses in the port approach phase generally occurred for one (Fig. 3P) or a few individual port-cue locations. In some cases a triple response pattern was found with a firing increase associated to each reward port in one chamber (Fig. 3Q).
Table 2.
Hippocampal and ventral striatal firing rate responses in the temporal domain
| HC |
VS |
|||||
|---|---|---|---|---|---|---|
| Units | Responses | Resp/Unit | Units | Responses | Resp/Unit | |
| Number of recorded units | 194 | 195 | ||||
| All events | 142 | 332 | 2.3 ± 0.1* | 67 | 312 | 4.7 ± 0.5* |
| Firing rate increases | 138 | 291 | 2.1 ± 0.1* | 58 | 246 | 4.2 ± 0.5* |
| Firing rate decreases | 21 | 41 | 2.0 ± 0.3 | 20 | 66 | 3.3 ± 0.6 |
| Onset cue light | 2 | 2 | 1.0 | 12 | 42 | 3.5 ± 0.6 |
| Firing rate increase | 2 | 2 | 1.0 | 11 | 40 | 3.6 ± 0.7 |
| Firing rate decrease | — | — | 1 | 2 | 2.0 | |
| Approach of reward port | 141 | 314 | 2.2 ± 0.1* | 63 | 246 | 3.9 ± 0.2* |
| Firing rate increase | 137 | 273 | 2.0 ± 0.1* | 54 | 183 | 3.4 ± 0.2* |
| Firing rate decrease | 21 | 41 | 2.0 ± 0.3 | 19 | 63 | 3.3 ± 0.3 |
| Valve opening | 5 | 5 | 1.0 | 9 | 20 | 2.2 ± 0.6 |
| Firing rate increase | 5 | 5 | 1.0 | 8 | 19 | 2.4 ± 0.7 |
| Firing rate decrease | — | — | 1 | 1 | 1.0 | |
| Nose retraction from port | 10 | 11 | 1.1 ± 0.0 | 3 | 4 | 1.3 ± 0.3 |
| Firing rate increase | 10 | 11 | 1.1 ± 0.0 | 3 | 4 | 1.3 ± 0.3 |
| Firing rate decrease | — | — | — | |||
Overview of the number of significant behavioral correlates observed in HC and VS populations. Note that neurons could exhibit a response (Resp) to more than one of the tested events. VS units showed significantly more responses per unit than HC cells;
*MWU p < 0.01.
When comparing cue- and context-conditioning sessions, hippocampal firing patterns differed in that the firing in the context sessions was sparser than in the cue sessions (Table 1). A function of this greater sparsity may lie in the possibility that, during context sessions, animals will discriminate better between compartments because of different reward contingencies, which is supported by a greater spatial selectivity of hippocampal coding.
Thus, most hippocampal cells generated firing patterns unique for specific locations in the Y-maze, indicating that path-integration cues were sufficient to collectively create a spatial map spanning the entire maze, instead of creating “micro”-maps that applied to separate but sensorily identical maze regions. Remarkably, despite the lack of distinguishing visual beacons small fields were found centered at specific reward ports.
Single unit coding in ventral striatum
In sharp contrast to the local selectivity of hippocampal activity, VS units (n = 195) showed spatial firing fields that generally covered large areas of the Y-maze. These units could be classified by contrasting the firing activity near the reward ports versus activity at or close to the central areas of the maze (i.e., triangle and central area of the chambers; Fig. 4; Table 1). More than half of the cells emitted spikes in these central portions (57.0%; Fig. 4A,C,J,K,O). Another substantial portion of cells fired specifically at, or near reward ports (15.5%; Fig. 4D,F,M). A last subgroup comprised cells that fired throughout the entire Y-maze but fired differentially between the center portions of the maze and the rim where the reward ports were located (Fig. 4B,I). Independent of this classification, Table 1 provides the same measures of spatial specificity as applied to hippocampal units.
Ventral striatal firing patterns were mostly rotationally symmetric, and therefore the information that they convey is unlikely “allocentric” in nature. In this context the term allocentric refers to types of spatial representation that are not directly based on the animals' own current viewpoint but are fixed to some subspace of the environment, so that the same maze location approached from different directions will be uniquely and consistently coded, as found for hippocampal neurons (McNaughton et al., 2006; O'Keefe, 2006). In VS, we tested the alternative possibility that firing patterns were related to specific task events and associated behaviors (Fig. 4P–S; Fig. 5). A great majority of striatal firing rate responses occurred during the approach and/or nose poke phase (78.8%; Table 2), and changes were mostly firing rate increases (74.4%). A substantial part of VS units responded to all or at least most of the nine reward ports (>5 responses 27.5%; Fig. 4P,Q). In contrast to hippocampal cells, only one striatal unit showed a triple response pattern to all ports located in the same chamber. No unit showed a response at the same port location in each of the chambers (e.g., left hand with respect to chamber entry). Some units responded to only one port-chamber combination across the whole maze (27.5%), although often rate changes were observed at other ports but failed to reach statistical significance. Overall, ventral striatal units exhibited more responses per unit to individual port-chamber combinations than hippocampal units, thus showing a stronger generalization across goal sites (Table 2). We did not observe differences in VS spatial or temporal firing patterns between cue and context sessions.
Figure 5.

Ventral striatal firing-rate responses associated with cue light onset. PETHs and raster diagrams show examples of four ventral striatal neurons that increased their firing rate in relation to illumination of cue lights (t = 0, green line; bin size 50 ms). Graphs represent pooled responses to multiple ports: upper left: all ports in one chamber (n = 3); upper right: symmetrically similar port locations pooled across chambers (n = 3); lower graphs: all nine ports combined. Plotting conventions are according to Figures 3 and 4. Statistical evaluation was performed in the time window of [0,250] ms following cue onset. Orange triangles indicate nose pokes in any reward port.
In addition to the dominant occurrence of approach-related firing rate responses, smaller shares of VS firing responses related to cue onset (13.5%), valve opening (6.4%), or nose retraction from a port (1.3%). At the time of cue onset the rats could be at any location within the Y-maze and be engaged in different behaviors. We assessed cue onset-related firing responses also on a finer grained time scale (bin size 50 ms, event window [0,250 ms] relative to cue onset) to test whether these neural correlates were robust in view of behavioral variability (Fig. 5). Under these conditions 11 neurons showed a total of 16 firing rate increments occurring generally with a latency of 75–100 ms after cue illumination. These responses reached statistical significance when approaches to individual ports were pooled across chambers, ports, or both. Thus, a subset of ventral striatal neurons responds in close temporal relation to cue light onset largely regardless of the rat's position and ongoing behavior in the maze. In contrast, none of the hippocampal units exhibited a cue-related firing rate response at this time scale.
Together, whereas hippocampal units showed firing patterns unique to specific locations and showed symmetry breaking consistent with allocentric coding, striatal responses often generalized across reward-related behaviors and events throughout the Y-maze, “tessellating” the task sequence without marked spatial selectivity.
Quantification of rotational symmetry of spatial firing fields
To quantitatively compare the degree of spatial symmetry between HC and VS populations, we computed partial correlations between the firing patterns of each cell across the three chambers. The quantity rab|occ represents the partial correlation coefficient for a neuron's spatial firing in chamber A and B, corrected for the correlation between the rat's occupancy patterns in each chamber. Figure 6A shows the cumulative distributions of the averaged rotational correlations for all chamber pairs for all HC and VS cells. Spatial firing was more correlated across chambers, and thus more “isotropic” for VS than hippocampal units (VS: mean ± SEM r = +0.09 ± 0.01, HC: r = +0.02 ± 0.01; p < 1.10−5, Kolmogorov–Smirnov test). Note, however, that even the VS population contained a minority of cells showing low correlation coefficients (Fig. 6B, VS2), although these cells usually generated a low number of spikes.
Figure 6.
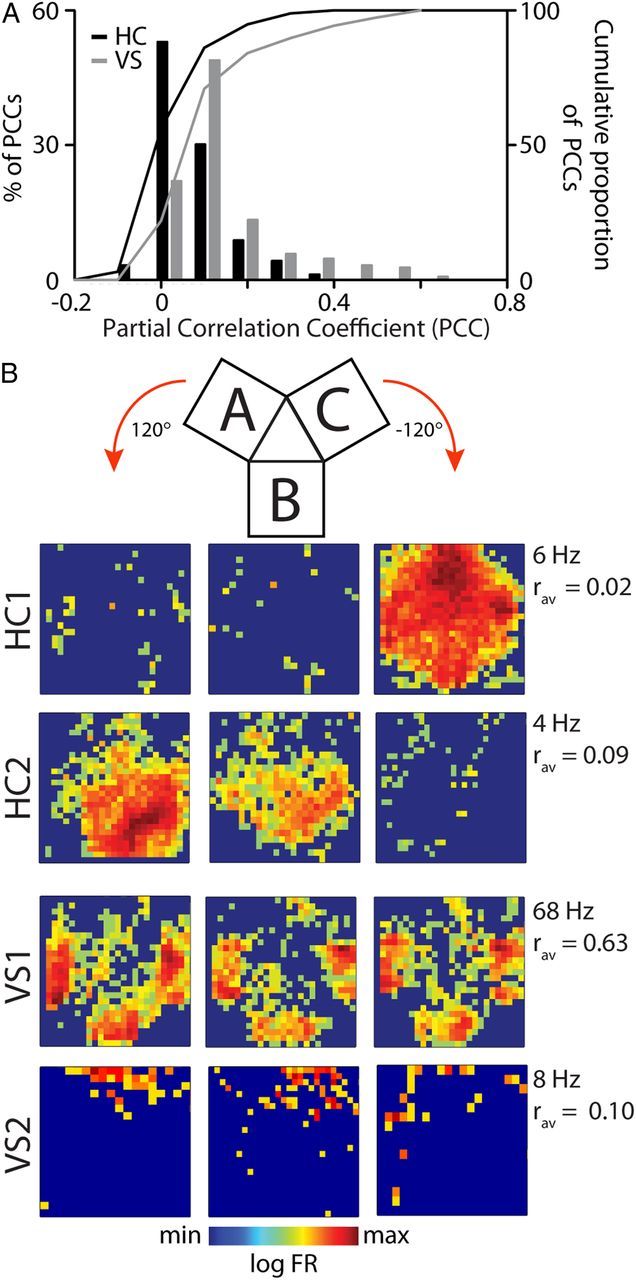
Ventral striatal units show larger rotational symmetry than hippocampal units. A, Spatial symmetry of single neuron firing patterns was defined as the average of partial correlation coefficients across the three pairs of chambers (A-B, A-C, B-C). The ventral striatal distribution of coefficients and the cumulative distribution (gray bars and line, respectively) were significantly shifted toward higher values than for HC (black bars and line). B, Spatial symmetry of individual neurons, two from HC (top, HC1 and HC2) and two from VS (bottom, VS1 and VS2). Firing rate is color coded and chambers were aligned with the side that connects to the center triangle shown on top. Rotational symmetry (Rav) is low for HC1 showing one distinct place field and for HC2 exhibiting place fields in two chambers. Striatal units generally showed similar firing patterns across the three chambers (VS1), although occasionally neurons with low symmetry were found (VS2), attributable at least in part to low spike counts.
Cue-evoked behavior modulates hippocampal and ventral striatal firing patterns
Our second main question was if and how HC and VS ensemble firing patterns are influenced by time-limited, reward-predicting cues. Cued trials were intermitted by ITIs in which rats often checked uncued ports for reward availability. This setting allowed us to contrast firing patterns exhibited during virtually identical behaviors that were driven by different motivational states.
The first important difference between the hippocampal rate maps computed for periods in which a cue light was illuminated (Cue On) versus ITIs was that many spatial firing patterns were modulated by one task phase, i.e., a neuron was highly active at a specific location during one task phase (e.g., Cue On), but less active when the rat visited the same location in the other phase (e.g., ITI; Fig. 7A,B). The number of task-phase unique place fields in HC was much lower in Cue On periods than during ITIs indicating that the overall spatial coding in Cue On periods was sparser than in ITIs (Table 3; WMPSR, p < 1.10−8). Also the size of firing fields expressed in Cue On periods was smaller than during ITIs (MWU p < 1.10−6). A similar difference in field size was found when only units with significant firing fields in both phases were taken into account (Fig. 7B). A third difference was that peak firing rates in rate maps were higher for Cue On periods than for ITIs (MWU p < 0.02). Correspondingly, during the Cue On period the spatial information conveyed per hippocampal spike and the sparsity were significantly higher compared with ITIs (WMPSR, Information: p < 0.005; Sparsity: p < 1.10−4, Table 3).
Figure 7.

Reward-predictive cues modulate firing patterns of hippocampal neurons. Rate and occupancy maps (A) and PETHs (B) of a representative hippocampal neuron reveal spatial and temporal compression of the firing pattern and an increased peak firing rate during Cue On versus ITI periods. Firing rates are color coded and superimposed on the representation of the trajectory of the rat (black). Maximal firing rate is noted in the lower left corner of the rate maps. Occupancy maps indicate that the rat explored the entire Y-maze in Cue On and ITI periods. PETH plot conventions as in Figure 3. C, Place field size during Cue On periods plotted against field size during ITIs of all neurons that showed significant location-specific firing in both periods.
Table 3.
Firing patterns of HC and VS in Cue On and intertrial intervals
| ALL | Cue On | % | ITI | % | Statistics | |
|---|---|---|---|---|---|---|
| HC | ||||||
| Spatial domain | ||||||
| Total number of place fields | 206 | 100 | 100 | |||
| Trial-phase unique place fields | 109 | 52.9* | 173 | 84.0* | *p < 1.10−8 | |
| Place field size (cm) | 209.5 ± 11.4 | 347.7 ± 16.6 | p < 1.10−6 MWU | |||
| Peak firing rate (Hz) | 16.0 ± 0.7 | 13.8 ± 0.8 | p < 0.02 | |||
| Spatial information (bits) | 3.5 ± 0.2 | 2.9 ± 0.2 | p < 0.005 | |||
| Sparsity | 91.0 ± 0.7% | 88.9 ± 0.9% | p < 1.10−4 | |||
| Temporal domain | ||||||
| Total number of responses, FR increase | 273 | 100 | 100 | |||
| Trial-phase unique responses, FR increase | 50 | 18.3* | 119 | 43.6* | *p < 1.10−7 | |
| VS | ||||||
| Spatial domain | ||||||
| Spatial information (bits) | 4.1 ± 0.3 | 2.8 ± 0.2 | p < 1.10−8 | |||
| Sparsity | 88.1 ± 1.1% | 81.1 ± 1.4% | p < 1.10−20 | |||
| Temporal domain | ||||||
| Total number of responses, FR increase | 183 | 100 | 100 | |||
| Trial- phase unique responses, FR increase | 47* | 25.7 | 67* | 36.6 | *p < 0.03 | |
| Total number of responses, FR decrease | 63 | 100 | 100 | |||
| Trial-phase unique responses, FR decrease | 21 | 33.3 | 23 | 36.5 | n.s. |
*Task-phase unique place fields and responses were statistically evaluated as the number of fields/responses in the respective period divided by the overall number of fields/responses. The peak firing rate and the response duration in the temporal domain were statistically tested per unit using the difference between Cue On and ITI responses at the port where the responses were maximal for either of the two phases. Because of the low spatial selectivity of VS firing patterns, measures of place fields and Cue On versus ITI differences are not reported in this table except for in spatial information and sparsity. FR, firing rate. Cue On versus ITI: WMPSR unless noted otherwise.
When PETHs were used to study the temporal dimension of cue effects, hippocampal responses related to port approach and arrival also showed task-phase unique responses in specific periods, with fewer unique responses in Cue On periods compared with ITIs. To test for response differences between the two phases, we compared peak firing rates and the interpolated response width at half-maximal firing rate. As on the rate maps, the responses in the Cue On phase showed a higher peak firing rate, and also a shorter duration compared with ITIs (difference in peak firing rate Cue On minus ITI: 2.3 ± 0.6 Hz, WMPSR p < 0.001; difference in response duration Cue On minus ITI: 0.1 ± 0.1 s, p < 0.01). Thus, the specificity and dynamics of hippocampal firing patterns strongly depend on whether the behavior is goal directed and task engaged versus exploratory and spontaneous.
Also firing patterns of VS neurons were influenced by reward-predictive cues. Consistent with hippocampal firing, many VS units showed firing rate increases observed during either the Cue On periods or ITIs (Fig. 8). Fewer neurons showed unique response patterns for the Cue On phase than for the ITIs, confirming a sparser ensemble code for stimulus-triggered than spontaneous behaviors. Remarkably, a subset of cells showed a “flip” between having a strong response before ITI “checking” nose pokes in a reward port toward showing weaker or no response in the Cue On period, indicating that such firing rate increments do not simply correlate with reward expectancy (cf. Schultz et al., 1992; Roitman et al., 2005; van der Meer and Redish, 2009; Pennartz et al., 2011). Peak firing rate and response duration were not significantly different between task phases. Firing rate decrements during port approaches and nose pokes were specific for the Cue On or ITI periods in nearly equal numbers. Similar to HC, the spatial information and sparsity were significantly higher in VS during Cue On periods versus ITIs (WMPSR, Information: p < 1.10−8; Sparsity: p < 1.10−20).
Figure 8.

Reward-predictive cues modulate ventral striatal firing patterns. Firing responses of a ventral striatal neuron associated with nose poking (t = 0: onset) are clearly expressed during Cue On periods but not during the same behavior in ITIs. A, Rate and occupancy maps. B, PETHs. Plot conventions as in Figure 3 and 7.
Our analyses in the temporal and spatial domain reveal hippocampal and ventral striatal firing rate changes between phases that are similar to the phenomenon of rate remapping (Leutgeb et al., 2005). This is also apparent in the place field analysis as a strong difference in spatial information and sparsity of responses in both structures during the Cue On versus ITI phases of the task. Firing rate differences between the phases were often large, to the point that a firing response in one of the phases was absent or did not reach statistical significance. In only a very few cases, the Cue On versus ITI phase showed single-cell firing peaks at different locations (HC: four neurons; VS: one neuron), suggesting that the cue-induced reorganization of ensemble activity was generally not the consequence of a global remapping between task phases.
Reward-site associated neural responses correlate weakly with running speed
Rats generally approached a reward site faster with the cue light on compared with ITIs, and hippocampal unit activity is somewhat sensitive to velocity (McNaughton et al., 1983). To test whether cue effects on firing patterns may be confounded by differences in running speed, we performed a bootstrap analysis, comparing trials with similar speeds for approaches to ports in Cue On and ITI conditions: 59 of 262 (22.5%) hippocampal responses showed a significant correlation between firing rate difference (Cue On vs ITI; p < 0.05) and the difference in approach velocity. The prevalence of correlations with running speed was also low in the VS: 15 of 175 (8.6%) responses. Thus, velocity-matched analysis demonstrated that velocity correlations explained only a small percentage of the difference in VS responses. To control for the possibility that the observed differences between Cue On and ITI parameters resulted from a difference in the rat's locomotor velocity between the task phases, we excluded the significantly velocity-correlated units from the data-set and recomputed all mentioned statistics. This manipulation did not disrupt the significance of our results.
We also tested whether the approach-related firing rate responses may be confounded by firing in periods in which the rat's velocity was 0 or low; i.e., when it was waiting at the reward site or pausing otherwise. During immobility, firing patterns in HC and VS are influenced by sharp wave-ripple complexes (Buzsáki, 1986; Pennartz et al., 2004; Lansink et al., 2008). To examine whether patterns of task correlates were greatly affected by such inputs, we reassessed the firing rate responses after excluding approaches in which the average velocity was lower than the median velocity computed over the entire session from the PETHs. As expected, a substantial share of trials was lost when studying the ITI approaches (−20.5 ± 1.1%) whereas the Cue On approaches were less affected (−3.7 ± 0.6%). Exclusion of the low-velocity trials resulted in a loss of 18 of 212 (8.5%) of the hippocampal ITI responses and 2 of 143 (1.4%) of the Cue On responses. For the VS, the loss of responses was 22 of 128 (17.2%) for the ITI responses and 9 of 108 (8.3%) for the Cue On responses. Thus, firing related to immobile or slow-moving periods may account at most for a small share of the approach-related hippocampal and ventral striatal firing patterns. It should be noted that some net loss of correlates is expected because of loss of statistical power when a substantial number of trials is removed. Statistically significant differences between Cue On and ITI trial phase unique responses in the HC and VS were not affected when the correlates that were lost with speed filter application were excluded from analysis.
Enhanced accuracy of position reconstruction during goal directed behaviors
To test whether the increased information and enhanced sparsity of individual firing fields during the Cue On period are paralleled by a higher accuracy in population coding, we used Bayesian statistical inference to reconstruct the animal's position given the ensemble activity of neurons in each structure. This approach can also be applied to VS ensembles essentially lacking spatial selectivity, because in general different task components were performed at specific maze locations. The average error in reconstructing the rat's position, z-scored across the entire session, was compared between Cue On and ITI reward port approaches. Reconstruction error on Cue On approaches was below average and significantly below ITI errors for both HC (Fig. 9A) and VS (Fig. 9B) ensembles during time segments starting ∼1 s before the nose poke (WMPSR, p < 0.05 for each of >10 consecutive 250 ms bins). This result demonstrates that reward-predicting cues have a sharpening effect on both hippocampal and ventral striatal population coding of position.
Figure 9.

Position reconstruction is more accurate during cue-induced behavioral states. The position of rats was reconstructed using ensemble activity during reward port approach (t = 0: nose-poke onset) to compare the accuracy of population coding between Cue On periods and ITIs. Note that here and in Figure 10 putative interneurons were included but the results were nearly identical when they were not taken into account. The z-scored reconstruction error was significantly smaller in Cue On periods versus ITIs for both HC (A) and VS (B) up to ∼1 s before the nose poke (bin size = 250 ms; gray background: WMPSR, p < 0.05) indicating a higher accuracy for cued, goal-directed versus uncued, spontaneous behaviors.
Increased temporal specificity for ensemble coding of goal-directed behaviors
The temporally compacting effect of cues on hippocampal unit responses may not only be expressed at the single cell level, but may also enhance the temporal specificity of population coding for cued port approaches. To test this, we constructed population vectors of neuronal perievent responses for all reward port approaches under Cue On and ITI conditions. We next computed the correlation between population vectors for each time point during the approach, producing a correlation matrix displaying the similarity between the ensemble patterns for each moment in time with all other moments in time surrounding a fluid-poke event (Fig. 10A,B). During Cue On periods, the temporal correlations between the moment-to-moment HC population vectors increased within a short time window preceding nose-poke onset (500 ms, WMPSR p < 0.05) during Cue On periods compared with ITIs, in agreement with the enhanced temporal compactness observed in single units. To further compare the temporal specificity of ensemble coding during Cue On periods with ITIs, the sparsity of the temporal correlations for each point in time was calculated. Hippocampal ensemble firing patterns during Cue On approaches were significantly more sparse than during ITI approaches (WMPSR, p < 0.05). This sparser temporal code was not accompanied by a general difference between Cue On and ITI periods in the population's overall firing rate in advance of nose poke onset (Fig. 10, left). The population effect was in agreement with the cue-induced enhanced compactness observed in HC single units. Also, the VS demonstrated an enhanced population vector consistency during Cue On and an early, albeit less pronounced, difference in sparsity between Cue On and ITI approaches (WMPSR, p < 0.05; Fig. 10, right).
Figure 10.

Cued, goal-directed behaviors increase the temporal specificity of population coding. A, Hippocampal ensemble activity around nose-poke onset (t = 0) was correlated with ensemble firing at every other moment in this task phase (i.e., population vectors at different moments were cross-correlated). This was done for approaches during the Cue On period (top, left) and ITIs (bottom, left). Color scale represents strength of population vector correlation. Sparsity (top, right panel) of regions boxed on the left side is shown for 2 s before and after nose poke for Cue On (blue, FPcue) and ITI periods (red, FPITI). The sparsity of vector correlations during cued approach was stronger than for ITIs (gray shading, p < 0.05 WMPSR). The difference in correlations between Cue On and ITI periods is shown in the center plot. There were small but significant differences in average population firing rate (AvgDFR; gray shading; bottom, right; p < 0.05 WMPSR). B, Same as A but now for VS ensembles (Cue On: top right; ITIs: bottom right). There were small but significant differences in sparsity (gray; p < 0.05 WMPSR). There was no significant difference in the population average firing rate during approach (bottom, left).
Discussion
In the Y-maze task, in which navigation depended on path integration rather than on intra- or extra-maze cues, HC and VS firing patterns markedly differed in the degree of spatial “isotropy.” Whereas most VS neurons showed rotationally symmetric spatial spike density distributions, hippocampal firing fields generally broke symmetry and were characterized as place fields (Fig. 6). This difference was also expressed in the temporal domain, where striatal neurons generally responded during a distinct task phase specified by particular actions, such as approach to reward sites. These temporal and spatial responses were usually homogeneous across different chambers and reward ports. In contrast, hippocampal units displayed more specificity in firing patterns, correlating with approach behavior in only one chamber, or even merely toward a specific reward port (Fig. 3). The onset of reward-predictive cues caused a remapping of firing responses in both HC and VS, as expressed by firing patterns that were predominantly present in either Cue On of ITI periods, in addition to responses shared between these periods. Furthermore, cue presence enhanced HC peak firing rates and induced a compression of place fields and temporal firing patterns at the hippocampal single cell level (Fig. 7B). This was also expressed as an improvement in spatial reconstruction (Fig. 9) and as a tighter band of temporal specificity when population vectors were correlated across time in relation to nose-poke onset (Fig. 10).
Limited spatial selectivity of ventral striatal firing patterns
There was a clear dissociation between HC and VS firing patterns in that hippocampal cell firing generally broke the spatial symmetry of the Y-maze whereas VS cells often behaved isotropically. This dissociation may be related to other strong inputs the VS receives from afferent structures such as the BLA, mPFC, and midline thalamic nuclei. The BLA is thought to convey information about the value of discrete cues (Aggleton et al., 1981; Everitt et al., 1989; Seamans and Phillips, 1994; Ito et al., 2006, 2008), whereas mPFC has been implied in coding task rules, attentional set, and actions predictive of outcomes (Balleine and Dickinson, 1998; Birrell and Brown, 2000; Wallis et al., 2001). It is important to recall that the VS is innervated not only by the dorsal HC but also strongly by efferents from the ventral HC, where place fields have been reported to be larger than in the dorsal CA1 (Kjelstrup et al., 2008), that and in addition to CA1, much of the hippocampal output reaches the VS via the subiculum, where generalization over different environments may take place (Groenewegen et al., 1987; Sharp, 1997). The lack of predominant spatial coding in VS poses the question of why several previous single-unit studies did observe location selectivity for firing patterns in this structure (Lavoie and Mizumori, 1994; Shibata et al., 2001; Mulder et al., 2005). First, distinct from our path navigation-based paradigm, rats in other studies navigated in an environment that contained discrete proximal or distal visual landmarks. It is important to distinguish whether spatial specificity of firing patterns in these studies may have been induced by discrete environmental stimuli, or was truly based on path integration. Whereas path integration functions are associated with HC and connected structures such as medial entorhinal cortex (O'Keefe and Nadel, 1978; McNaughton et al., 1996; Hafting et al., 2005), discrete stimuli may control motivated behavior via the BLA-VS core pathway (Everitt et al., 1989; Cardinal et al., 2002; Ito et al., 2008). Because the probe sessions indicated that the rats based their navigation not on extra-maze cues but on path integration, the context-conditioning sessions were therefore eminently suited to have observed spatially selective VS firing patterns had they existed. However, these sessions, consistent with cue-conditioning sessions, did not yield clear VS “place fields.” Second, differences in observed spatial selectivity of VS firing patterns could be explained by topographic recording locations in the VS, but we consider this possibility unlikely. Although recent inactivation studies showed a more pronounced involvement of the VS shell than core in tasks involving contextual conditioning and context-induced reinstatement of drug-seeking behavior (Riedel et al., 1997; Fuchs et al., 2004; Ito et al., 2008), the current and previous studies typically made mixed shell-core recordings. Moreover, our subset of shell recordings showed a comparable number of isotropic firing patterns to those exhibited in the entire dataset. Overall, the difference in spatial selectivity of firing patterns between current and previous studies is most parsimoniously explained by the inclusion of discrete landmarks in previous studies. Limited spatial selectivity was also found for striatal neurons that were mostly recorded in dorsal regions, which may be less surprising considering the absence of hippocampal inputs outside the ventromedial striatum (Berke et al., 2009; Pennartz et al., 2011).
Effects of reward-predictive cues on hippocampal and striatal firing patterns
Reward-predictive cues modulated the activated neuronal ensembles in both the HC and VS compared with ITIs and in addition exerted a time-compressing and a firing rate effect on hippocampal neurons. This rate remapping, which in the HC refers to strong amplitude modulation of place fields with constant location, reinforces the notion that the HC is not only concerned with allocentric representations of space, but also with the time-discrete events taking place within the spatial context, as these affect the motivational and attentional state of the animal (Fenton et al., 2010). We propose that the compression of hippocampal firing fields in combination with the enhanced peak firing rates renders hippocampal representations sharper, as will be required by task demands accompanied by a heightened state of motivation and attention triggered by cue appearance. Although this hypothesis must be tested further, we note that the error in reconstructing the animal′s maze position based on HC and VS firing patterns indeed decreased better than average in both structures during cue-evoked approach versus ITIs.
Currently, experimental data indicative of remapping are mainly limited to the HC and the upstream medial entorhinal cortex (Leutgeb et al., 2004, 2005, 2007; Fyhn et al., 2007), but the hypothesis of remapping underlying memory separation entails that representations emerging during remapping can be transmitted to target areas. VS remapping illustrates how the impact of outcome-predictive cues reaches beyond the hippocampal memory system. Functionally, this impact may be to convey separate codes for behavioral context to the VS as a system coding outcome predictions and invigorating associated behaviors. Considering that a substantial number of VS neurons fired in close spatial and temporal proximity to reward locations, the convergence of spatial-contextual and motivational (outcome-predictive) information may also serve to integrate these types of information and support the learning of place-reward associations that are fundamental to foraging behavior and learned behaviors such as conditioned place preference (Carr and White, 1983; Kim and Fanselow, 1992; Ito et al., 2008; Lansink et al., 2009). Although the HC seems currently the most plausible candidate for triggering VS remapping, it may also involve other areas such as the PFC or BLA.
Coding in ventral striatum: overall action strategy and outcome-predictive coding
The premise that the VS receives spatial and contextual information from the HC and is essential for mediating HC-dependent behaviors, whereas VS neurons do not show predominant spatial firing patterns, requires an alternative theoretical framework to explain how hippocampal input is essential for efficient VS functioning. When our results are reviewed in conjunction with lesion evidence and anatomical knowledge (Annett et al., 1989; Sutherland and Rodriguez, 1989; Voorn et al., 2004; Ito et al., 2006, 2008), the emerging concept of VS function is that the neurons collectively code the overall action strategy and its current outcome-predictive value applicable to a particular task phase, viewed in the animal's specific spatiotemporal context. Here, it is important to note that inputs from HC, but also from BLA, mPFC, and other structures, each provide information to the VS. The observation that most VS neurons did not discriminate between different chambers, running directions, or reward-port positions in the Y-maze indicates that the action is coded more globally than occurs e.g., in dorsolateral striatum (where distinct limb or body movements are represented (cf. Alexander et al., 1990; West et al., 1990; Jog et al., 1999). Yet, the ventral striatal code for actions can still be considered specific as it is appropriate for the location and task phase in which the animal finds itself. For instance, it is dysfunctional for the animal to initiate a locomotor response when it has just arrived at a cued reward site. Likewise, licking responses will not be functional when the animal perceives a cue light but is located in the Y-maze center. The HC may contribute to the selection of action strategy by providing contextual and spatial information that aids activation of a particular VS ensemble for invigorating a corresponding action appropriate for that temporal phase and spatial context. Thus, the HC may enable the VS to respond in a context-dependent manner where context includes individual locations (“where”), specific cues (“what”), and temporal aspects (“when”).
Footnotes
This work was supported by Human Frontier Science Program Grant RGP0127/2001, NWO-VICI Grant 918.46.609, and EU Grants FP7 #217148 and #270108 (C.M.A.P.). The Behavioral and Clinical Institute is supported by a joint grant from the Medical Research Council and Wellcome trust. We thank Bruce L. McNaughton and Carol A. Barnes for discussion and the technical departments of the Netherlands Institute for Neurosciences and the University of Amsterdam for construction of the Y-maze. Furthermore, we acknowledge A.D. Redish for the use of the cluster isolation software MClust.
The authors declare no competing financial interests.
References
- Aggleton JP, Petrides M, Iversen SD. Differential effects of amygdaloid lesions on conditioned taste aversion learning by rats. Physiol Behav. 1981;27:397–400. doi: 10.1016/0031-9384(81)90322-x. [DOI] [PubMed] [Google Scholar]
- Alexander GE, Crutcher MD, DeLong MR. Basal ganglia-thalamocortical circuits: parallel substrates for motor, oculomotor, “prefrontal” and “limbic” functions. Prog Brain Res. 1990;85:119–146. [PubMed] [Google Scholar]
- Annett LE, McGregor A, Robbins TW. The effects of ibotenic acid lesions of the nucleus accumbens on spatial learning and extinction in the rat. Behav Brain Res. 1989;31:231–242. doi: 10.1016/0166-4328(89)90005-3. [DOI] [PubMed] [Google Scholar]
- Balleine BW, Dickinson A. Goal-directed instrumental action: contingency and incentive learning and their cortical substrates. Neuropharmacology. 1998;37:407–419. doi: 10.1016/s0028-3908(98)00033-1. [DOI] [PubMed] [Google Scholar]
- Berke JD, Breck JT, Eichenbaum H. Striatal versus hippocampal representations during win-stay maze performance. J Neurophysiol. 2009;101:1575–1587. doi: 10.1152/jn.91106.2008. [DOI] [PMC free article] [PubMed] [Google Scholar]
- Birrell JM, Brown VJ. Medial frontal cortex mediates perceptual attentional set shifting in the rat. J Neurosci. 2000;20:4320–4324. doi: 10.1523/JNEUROSCI.20-11-04320.2000. [DOI] [PMC free article] [PubMed] [Google Scholar]
- Buzsáki G. Hippocampal sharp waves: their origin and significance. Brain Res. 1986;398:242–252. doi: 10.1016/0006-8993(86)91483-6. [DOI] [PubMed] [Google Scholar]
- Buzsáki G. Two-stage model of memory trace formation: a role for “noisy” brain states. Neuroscience. 1989;31:551–570. doi: 10.1016/0306-4522(89)90423-5. [DOI] [PubMed] [Google Scholar]
- Cardinal RN, Parkinson JA, Hall J, Everitt BJ. Emotion and motivation: the role of the amygdala, ventral striatum, and prefrontal cortex. Neurosci Biobehav Rev. 2002;26:321–352. doi: 10.1016/s0149-7634(02)00007-6. [DOI] [PubMed] [Google Scholar]
- Carr GD, White NM. Conditioned place preference from intra-accumbens but not intra-caudate amphetamine injections. Life Sci. 1983;33:2551–2557. doi: 10.1016/0024-3205(83)90165-0. [DOI] [PubMed] [Google Scholar]
- Cromwell HC, Schultz W. Effects of expectations for different reward magnitudes on neuronal activity in primate striatum. J Neurophysiol. 2003;89:2823–2838. doi: 10.1152/jn.01014.2002. [DOI] [PubMed] [Google Scholar]
- Everitt BJ, Cador M, Robbins TW. Interactions between the amygdala and ventral striatum in stimulus-reward associations: studies using a second-order schedule of sexual reinforcement. Neuroscience. 1989;30:63–75. doi: 10.1016/0306-4522(89)90353-9. [DOI] [PubMed] [Google Scholar]
- Fenton AA, Lytton WW, Barry JM, Lenck-Santini PP, Zinyuk LE, Kubík S, Bures J, Poucet B, Muller RU, Olypher AV. Attention-like modulation of hippocampus place cell discharge. J Neurosci. 2010;30:4613–4625. doi: 10.1523/JNEUROSCI.5576-09.2010. [DOI] [PMC free article] [PubMed] [Google Scholar]
- Fuchs RA, Evans KA, Parker MC, See RE. Differential involvement of the core and shell subregions of the nucleus accumbens in conditioned cue-induced reinstatement of cocaine seeking in rats. Psychopharmacology (Berl) 2004;176:459–465. doi: 10.1007/s00213-004-1895-6. [DOI] [PubMed] [Google Scholar]
- Fyhn M, Hafting T, Treves A, Moser MB, Moser EI. Hippocampal remapping and grid realignment in entorhinal cortex. Nature. 2007;446:190–194. doi: 10.1038/nature05601. [DOI] [PubMed] [Google Scholar]
- Gray CM, Maldonado PE, Wilson M, McNaughton B. Tetrodes markedly improve the reliability and yield of multiple single-unit isolation from multi-unit recordings in cat striate cortex. J Neurosci Methods. 1995;63:43–54. doi: 10.1016/0165-0270(95)00085-2. [DOI] [PubMed] [Google Scholar]
- Groenewegen HJ, Vermeulen-Van der Zee E, te Kortschot A, Witter MP. Organization of the projections from the subiculum to the ventral striatum in the rat. A study using anterograde transport of Phaseolus vulgaris leucoagglutinin. Neuroscience. 1987;23:103–120. doi: 10.1016/0306-4522(87)90275-2. [DOI] [PubMed] [Google Scholar]
- Hafting T, Fyhn M, Molden S, Moser MB, Moser EI. Microstructure of a spatial map in the entorhinal cortex. Nature. 2005;436:801–806. doi: 10.1038/nature03721. [DOI] [PubMed] [Google Scholar]
- Ito R, Robbins TW, McNaughton BL, Everitt BJ. Selective excitotoxic lesions of the hippocampus and basolateral amygdala have dissociable effects on appetitive cue and place conditioning based on path integration in a novel Y-maze procedure. Eur J Neurosci. 2006;23:3071–3080. doi: 10.1111/j.1460-9568.2006.04883.x. [DOI] [PMC free article] [PubMed] [Google Scholar]
- Ito R, Robbins TW, Pennartz CM, Everitt BJ. Functional interaction between the hippocampus and nucleus accumbens shell is necessary for the acquisition of appetitive spatial context conditioning. J Neurosci. 2008;28:6950–6959. doi: 10.1523/JNEUROSCI.1615-08.2008. [DOI] [PMC free article] [PubMed] [Google Scholar]
- Jog MS, Kubota Y, Connolly CI, Hillegaart V, Graybiel AM. Building neural representations of habits. Science. 1999;286:1745–1749. doi: 10.1126/science.286.5445.1745. [DOI] [PubMed] [Google Scholar]
- Kim JJ, Fanselow MS. Modality-specific retrograde amnesia of fear. Science. 1992;256:675–677. doi: 10.1126/science.1585183. [DOI] [PubMed] [Google Scholar]
- Kjelstrup KB, Solstad T, Brun VH, Hafting T, Leutgeb S, Witter MP, Moser EI, Moser MB. Finite scale of spatial representation in the hippocampus. Science. 2008;321:140–143. doi: 10.1126/science.1157086. [DOI] [PubMed] [Google Scholar]
- Lansink CS, Bakker M, Buster W, Lankelma J, van der Blom R, Westdorp R, Joosten RN, McNaughton BL, Pennartz CM. A split microdrive for simultaneous multi-electrode recordings from two brain areas in awake small animals. J Neurosci Methods. 2007;162:129–138. doi: 10.1016/j.jneumeth.2006.12.016. [DOI] [PubMed] [Google Scholar]
- Lansink CS, Goltstein PM, Lankelma JV, Joosten RN, McNaughton BL, Pennartz CM. Preferential reactivation of motivationally relevant information in the ventral striatum. J Neurosci. 2008;28:6372–6382. doi: 10.1523/JNEUROSCI.1054-08.2008. [DOI] [PMC free article] [PubMed] [Google Scholar]
- Lansink CS, Goltstein PM, Lankelma JV, McNaughton BL, Pennartz CM. Hippocampus leads ventral striatum in replay of place-reward information. PLoS Biol. 2009;7:e1000173. doi: 10.1371/journal.pbio.1000173. [DOI] [PMC free article] [PubMed] [Google Scholar]
- Lansink CS, Goltstein PM, Lankelma JV, Pennartz CM. Fast-spiking interneurons of the rat ventral striatum: temporal coordination of activity with principal cells and responsiveness to reward. Eur J Neurosci. 2010;32:494–508. doi: 10.1111/j.1460-9568.2010.07293.x. [DOI] [PubMed] [Google Scholar]
- Lavoie AM, Mizumori SJ. Spatial, movement- and reward-sensitive discharge by medial ventral striatum neurons of rats. Brain Res. 1994;638:157–168. doi: 10.1016/0006-8993(94)90645-9. [DOI] [PubMed] [Google Scholar]
- Leutgeb JK, Leutgeb S, Moser MB, Moser EI. Pattern separation in the dentate gyrus and CA3 of the hippocampus. Science. 2007;315:961–966. doi: 10.1126/science.1135801. [DOI] [PubMed] [Google Scholar]
- Leutgeb S, Leutgeb JK, Treves A, Moser MB, Moser EI. Distinct ensemble codes in hippocampal areas CA3 and CA1. Science. 2004;305:1295–1298. doi: 10.1126/science.1100265. [DOI] [PubMed] [Google Scholar]
- Leutgeb S, Leutgeb JK, Barnes CA, Moser EI, McNaughton BL, Moser MB. Independent codes for spatial and episodic memory in hippocampal neuronal ensembles. Science. 2005;309:619–623. doi: 10.1126/science.1114037. [DOI] [PubMed] [Google Scholar]
- Markus EJ, Qin YL, Leonard B, Skaggs WE, McNaughton BL, Barnes CA. Interactions between location and task affect the spatial and directional firing of hippocampal neurons. J Neurosci. 1995;15:7079–7094. doi: 10.1523/JNEUROSCI.15-11-07079.1995. [DOI] [PMC free article] [PubMed] [Google Scholar]
- McNaughton BL, Barnes CA, O'Keefe J. The contributions of position, direction, and velocity to single unit activity in the hippocampus of freely-moving rats. Exp Brain Res. 1983;52:41–49. doi: 10.1007/BF00237147. [DOI] [PubMed] [Google Scholar]
- McNaughton BL, Barnes CA, Gerrard JL, Gothard K, Jung MW, Knierim JJ, Kudrimoti H, Qin Y, Skaggs WE, Suster M, Weaver KL. Deciphering the hippocampal polyglot: the hippocampus as a path integration system. J Exp Biol. 1996;199:173–185. doi: 10.1242/jeb.199.1.173. [DOI] [PubMed] [Google Scholar]
- McNaughton BL, Battaglia FP, Jensen O, Moser EI, Moser MB. Path integration and the neural basis of the ‘cognitive map’. Nat Rev Neurosci. 2006;7:663–678. doi: 10.1038/nrn1932. [DOI] [PubMed] [Google Scholar]
- Mulder AB, Hodenpijl MG, Lopes da Silva FH. Electrophysiology of the hippocampal and amygdaloid projections to the nucleus accumbens of the rat: convergence, segregation, and interaction of inputs. J Neurosci. 1998;18:5095–5102. doi: 10.1523/JNEUROSCI.18-13-05095.1998. [DOI] [PMC free article] [PubMed] [Google Scholar]
- Mulder AB, Shibata R, Trullier O, Wiener SI. Spatially selective reward site responses in tonically active neurons of the nucleus accumbens in behaving rats. Exp Brain Res. 2005;163:32–43. doi: 10.1007/s00221-004-2135-3. [DOI] [PubMed] [Google Scholar]
- Muller RU, Kubie JL. The effects of changes in the environment on the spatial firing of hippocampal complex-spike cells. J Neurosci. 1987;7:1951–1968. doi: 10.1523/JNEUROSCI.07-07-01951.1987. [DOI] [PMC free article] [PubMed] [Google Scholar]
- O'Keefe J. Hippocampal physiology in the behaving animal. In: Andersen P, Morris RG, Amaral DG, Bliss T, O'Keefe J, editors. The hippocampus book. New York: Oxford UP; 2006. pp. 475–548. [Google Scholar]
- O'Keefe J, Dostrovsky J. The hippocampus as a spatial map. Preliminary evidence from unit activity in the freely-moving rat. Brain Res. 1971;34:171–175. doi: 10.1016/0006-8993(71)90358-1. [DOI] [PubMed] [Google Scholar]
- O'Keefe J, Nadel L. The hippocampus as a cognitive map. Oxford: Clarendon; 1978. [Google Scholar]
- Paxinos G, Watson C. The rat brain in stereotaxic coordinates. Ed 2. New York: Academic; 1986. [DOI] [PubMed] [Google Scholar]
- Pennartz CM, Groenewegen HJ, Lopes da Silva FH. The nucleus accumbens as a complex of functionally distinct neuronal ensembles: an integration of behavioural, electrophysiological and anatomical data. Prog Neurobiol. 1994;42:719–761. doi: 10.1016/0301-0082(94)90025-6. [DOI] [PubMed] [Google Scholar]
- Pennartz CM, Lee E, Verheul J, Lipa P, Barnes CA, McNaughton BL. The ventral striatum in off-line processing: ensemble reactivation during sleep and modulation by hippocampal ripples. J Neurosci. 2004;24:6446–6456. doi: 10.1523/JNEUROSCI.0575-04.2004. [DOI] [PMC free article] [PubMed] [Google Scholar]
- Pennartz CM, Ito R, Verschure PF, Battaglia FP, Robbins TW. The hippocampal-striatal axis in learning, prediction and goal-directed behavior. Trends Neurosci. 2011;34:548–559. doi: 10.1016/j.tins.2011.08.001. [DOI] [PubMed] [Google Scholar]
- Riedel G, Harrington NR, Hall G, Macphail EM. Nucleus accumbens lesions impair context, but not cue, conditioning in rats. Neuroreport. 1997;8:2477–2481. doi: 10.1097/00001756-199707280-00013. [DOI] [PubMed] [Google Scholar]
- Roitman MF, Wheeler RA, Carelli RM. Nucleus accumbens neurons are innately tuned for rewarding and aversive taste stimuli, encode their predictors, and are linked to motor output. Neuron. 2005;45:587–597. doi: 10.1016/j.neuron.2004.12.055. [DOI] [PubMed] [Google Scholar]
- Schultz W, Apicella P, Scarnati E, Ljungberg T. Neuronal activity in monkey ventral striatum related to the expectation of reward. J Neurosci. 1992;12:4595–4610. doi: 10.1523/JNEUROSCI.12-12-04595.1992. [DOI] [PMC free article] [PubMed] [Google Scholar]
- Seamans JK, Phillips AG. Selective memory impairments produced by transient lidocaine-induced lesions of the nucleus accumbens in rats. Behav Neurosci. 1994;108:456–468. doi: 10.1037//0735-7044.108.3.456. [DOI] [PubMed] [Google Scholar]
- Sharp PE. Subicular cells generate similar spatial firing patterns in two geometrically and visually distinctive environments: comparison with hippocampal place cells. Behav Brain Res. 1997;85:71–92. doi: 10.1016/s0166-4328(96)00165-9. [DOI] [PubMed] [Google Scholar]
- Shibata R, Mulder AB, Trullier O, Wiener SI. Position sensitivity in phasically discharging nucleus accumbens neurons of rats alternating between tasks requiring complementary types of spatial cues. Neuroscience. 2001;108:391–411. doi: 10.1016/s0306-4522(01)00400-6. [DOI] [PubMed] [Google Scholar]
- Skaggs WE, McNaughton BL, Gothard KM. An information-theoretic approach to deciphering the hippocampal code. In: Hanson S, Cowan J, Giles L, editors. Neural information processing systems. San Francisco: Morgan Kaufmann; 1993. pp. 1030–1037. [Google Scholar]
- Sutherland RJ, Rodriguez AJ. The role of the fornix/fimbria and some related subcortical structures in place learning and memory. Behav Brain Res. 1989;32:265–277. doi: 10.1016/s0166-4328(89)80059-2. [DOI] [PubMed] [Google Scholar]
- van der Meer MA, Redish AD. Covert expectation-of-reward in rat ventral striatum at decision points. Front Integr Neurosci. 2009;3:1. doi: 10.3389/neuro.07.001.2009. [DOI] [PMC free article] [PubMed] [Google Scholar]
- van Duuren E, Escámez FA, Joosten RN, Visser R, Mulder AB, Pennartz CM. Neural coding of reward magnitude in the orbitofrontal cortex of the rat during a five-odor olfactory discrimination task. Learn Mem. 2007;14:446–456. doi: 10.1101/lm.546207. [DOI] [PMC free article] [PubMed] [Google Scholar]
- Vinje WE, Gallant JL. Sparse coding and decorrelation in primary visual cortex during natural vision. Science. 2000;287:1273–1276. doi: 10.1126/science.287.5456.1273. [DOI] [PubMed] [Google Scholar]
- Voorn P, Vanderschuren LJ, Groenewegen HJ, Robbins TW, Pennartz CM. Putting a spin on the dorsal-ventral divide of the striatum. Trends Neurosci. 2004;27:468–474. doi: 10.1016/j.tins.2004.06.006. [DOI] [PubMed] [Google Scholar]
- Wallis JD, Anderson KC, Miller EK. Single neurons in prefrontal cortex encode abstract rules. Nature. 2001;411:953–956. doi: 10.1038/35082081. [DOI] [PubMed] [Google Scholar]
- West MO, Carelli RM, Pomerantz M, Cohen SM, Gardner JP, Chapin JK, Woodward DJ. A region in the dorsolateral striatum of the rat exhibiting single-unit correlations with specific locomotor limb movements. J Neurophysiol. 1990;64:1233–1246. doi: 10.1152/jn.1990.64.4.1233. [DOI] [PubMed] [Google Scholar]
- Wilson MA, McNaughton BL. Dynamics of the hippocampal ensemble code for space. Science. 1993;261:1055–1058. doi: 10.1126/science.8351520. [DOI] [PubMed] [Google Scholar]
- Zhang K, Ginzburg I, McNaughton BL, Sejnowski TJ. Interpreting neuronal population activity by reconstruction: unified framework with application to hippocampal place cells. J Neurophysiol. 1998;79:1017–1044. doi: 10.1152/jn.1998.79.2.1017. [DOI] [PubMed] [Google Scholar]