Abstract
Scanning acoustic microscopy is potentially a powerful tool for characterising the elastic properties of soft biological tissues and cells. In this paper, we present a method, Multi-Layer Phase Analysis (MLPA), which can be used to extract local speed of sound values, for both thin tissue sections mounted on glass slides and cultured cells grown on cell culture plastic, with a resolution close to 1 μm. The method exploits the phase information that is preserved in the interference between the acoustic wave reflected from the substrate surface and internal reflections from the acoustic lens. In practice, a stack of acoustic images are captured beginning with the acoustic focal point 4 μm above the substrate surface and moving down in 0.1 μm increments. Scanning parameters, such as acoustic wave frequency and gate position, were adjusted to obtain optimal phase and lateral resolution. The data were processed offline to extract the phase information with the contribution of any inclination in the substrate removed prior to the calculation of sound speed. Here, we apply this approach to both skin sections and fibroblast cells, and compare our data with the V(f) (voltage vs frequency) method that has previously been used for characterisation of soft tissues and cells. Compared with the V(f) method, the MPLA method not only reduces signal noise but can be implemented without making a priori assumptions with regards to tissue or cell parameters.
Keywords: scanning acoustic microscopy, soft tissue mechanics, cellular biophysics, phase analysis, V(f) method
I. INTRODUCTION
Changes in the mechanical properties of soft tissues are known to profoundly influence both human morbidity and mortality. The physical properties of skin for example are known to change with both chronological age and exposure to environmental factors [1, 2] and increases in arterial stiffness which are associated with age, diabetes and many other factors lead to hypertension, stroke, heart failure and end-stage renal failure [3-5]. Hence there is considerable interest in developing new approaches to characterise the mechanical properties of soft tissues. However, tissues such as skin are highly heterogeneous anisotropic materials whose composition and microscopic structure can vary as a consequence of both age and disease. There is a need therefore, to develop micro-mechanical approaches which, in combination with conventional histochemical methods, can measure the mechanical properties of discrete tissue components [6].
The accurate characterisation of the elastic properties of cells is needed to better understand the mechanical function of the cytoskeleton and the response of cells to changes in their local mechanical environment [7]. Improved methods for the measurement of mechanical properties using very small forces and displacements [8] coupled with the development of constitutive models for cell mechanical behaviour [9] has led to a number of studies investigating the mechanical behaviour of cells.
Atomic force microscopy (AFM)-based methods are currently the most widely used techniques for the mechanical investigation of soft tissues and cells because they combine a high lateral spatial resolution with good qualitative resolution of mechanical properties. However it is difficult to quantify sample stiffness from AFM data because the high compliance of both cells and soft tissues limits the applicability of the conventional Hertzian contact mechanics approach [8]. There are further limitations inherent in the technique, such as the difficulty in accurately determining the cantilever spring constant [10]. In addition, for conventional thin histology slices mounted on glass and for cells spread on a substrate, it is difficult to prevent the properties of the substrate dominating the AFM response [11]. Other techniques such as nanoindentation have a more secure mechanical foundation than AFM but this accuracy in mechanical property measurement is compromised by a significantly inferior spatial resolution. In addition, the response of the substrate also affects nanoindentation measurements [12]. Finally, indentation-based methods when applied to living cells mechanically disturb the cytoskeleton cell [13] and hence may induce a mechanical response. Thus there is a need to develop high-spatial resolution non-contact methods to accurately characterise the mechanical behaviour of cells and soft tissues.
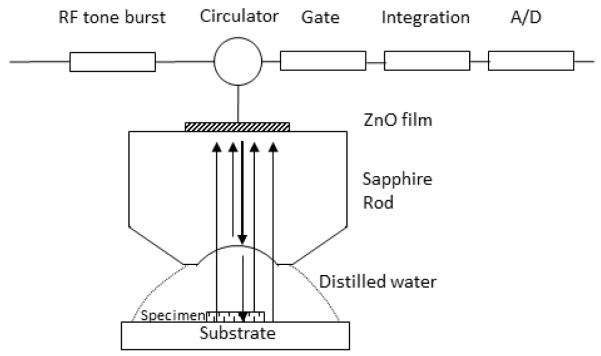
The potential utility of scanning acoustic microscopy (SAM) for biomedical applications [14] has been long recognised and the technique has been used to characterise living cells [15] and soft tissues such as blood vessels [16, 17] and heart valves [18]. The advantages of SAM include relatively fast acquisition, high spatial resolution (around 1 μm at 1 GHz excitation), ease of sample preparation, the ability to obtain histological data (without the need for specific staining) and non-destructive imaging of cells [19]. Although images of cells and tissue sections can be collected relatively easily, quantitative measurements are more challenging even for engineering materials [20] or stiff, calcified tissues [21], which can both be prepared to provide a flat specimen surface. The contrast observed in a SAM image contains complex phase information through the interference of a number of signals from the specimen and any interface with a significant acoustic impedance mismatch. Fig. 1 shows a schematic of a soft biological specimen mounted on a substrate, immersed in an acoustic coupling fluid (normally a buffered saline) immediately beneath an acoustic lens. The lens both transmits a short burst of ultra-high frequency acoustic energy and acts as the receiver for the reflected signals. Reflections are generated at all of the interfaces in the system: lens/fluid, fluid/specimen and specimen/substrate. In addition Rayleigh waves may radiate along the substrate surface and these leaky Rayleigh waves radiate acoustic energy from the substrate towards the lens. The signal received at the lens thus results from the interference between the reflections and the amplitude determined by the intensities and phase of each wave. Thus if the lens is moved in the z-direction, normal to the surface a complex oscillating intensity is recorded known as the V(z) curve or response [22, 23].
Fig. 1.
Schematic representation of the Scanning Acoustic Microscope (SAM). When a sound wave is generated and propagates through the acoustic lens, medium and specimen there are reflections from acoustic lens/medium, specimen/medium, specimen/substrate, and medium/substrate interfaces.
Quantitative analysis of the mechanical properties of specimens in the acoustic microscope is achieved by analysing the phase information in the reflected signal. In most cases this is achieved through appropriate gating of the received signal to reduce the number of specimen-related signals, hence simplifying analysis of the V(z) curve to interference between two signals. In the case of soft tissues on glass slides, or cells on substrates, the strong reflection from the substrate is often taken as a suitable reference signal that interferes with the weaker reflection from the specimen fluid interface. It is also possible to investigate the change in amplitude and phase of the reflected signal when the frequency of the acoustic excitation is varied rather than the acoustic path length. This method is known as frequency scanning or the V(f) method [15].
A number of approaches have been used to determine the properties of biological samples using SAM and recording the V(z) response [24, 25]. Kundu et al [26, 27] computed the properties of fixed cells by using the Simplex algorithm to estimate the cell thickness profile and estimating the value of the longitudinal wave speed in the cell. With this information, they estimated the probable upper and lower bounds of the cell thickness at different pixels or cell positions. They developed this method further by comparing synthetically-derived pixel intensities along a line scan with experimental V(z) data, using a simplex inversion algorithm to obtain the best estimate of the unknown values of cell thickness profile, acoustic wave speed and attenuation at each pixel.
There have also been studies of the properties of cells using the V(f) method [28]. Kundu and co-workers further developed their methods using the signal intensity as a function of frequency, V(f), to obtain the acoustic properties of cells using the simplex algorithm. They have also applied the analysis to soft tissue specimens [18, 29]. The V(f) approach has a number of advantages over other methods that have been used for characterisation of the elastic properties of cells including the relatively fast acquisition time of a V(f) dataset. Recently we have employed this approach to demonstrate that the gross tissue stiffening which characterises the ageing aorta is localised to collagen fibril rich regions within the medial layer of the vessel wall [30].
However, although relative differences in speed of sound through cells and tissues can be computed using either the V(f) methods coupled with algorithmic optimisation, the method relies on a defined set of upper and lower bounds before optimisation [15]. The resultant wave speed values are found to be highly dependent on the initial bounds that have been defined (possibly arbitrarily). Further, we have found that the sound waves that are reflected from the specimen also interfere with stray echoes inside the acoustic lens. This interference results in a voltage signal that significantly depends on the acoustic frequency and the distance between the lens and the specimen. Thus, the analysis of V(f) data is further complicated. In light of these confounding issues with current methods of analysing SAM data for cells and soft tissues, this study aimed to develop a novel analysis method by utilising phase information. We have found that the interference between the in-lens echoes and the reflections from the specimen preserves phase (timing) information and also that this interference can be utilised to determine the acoustic wave speed as well as attenuation in tissues and have compared our approach to the V(f) method using cells and soft tissues as examples to show the utility of our approach.
II. METHODS
A. Cell and Tissue Preparation
NIH 3T3 mouse fibroblasts were plated on polystyrene culture dishes (60 mm diameter; BD Biosciences, Oxford, UK) coated with 10 μg/ml bovine plasma fibronectin (Sigma-Aldrich; Dorset, UK) and kept overnight in Dulbecco’s Modified Eagle’s Medium (DME; Sigma-Aldrich, Dorset, UK) supplemented with fetal bovine calf serum (FBS; 10 %) and L-glutamine (Invitrogen; Paisley, UK) at 37°C in 5 % CO2.
Histological cryosections (5 μm) of human skin were prepared from a 6 mm diameter punch biopsy excised from a photoprotected site (buttock) of a 35 year old female volunteer. The samples were embedded in Optimal Cutting Temperature (OCT) medium (Miles Laboratories; Elkhart, IN, USA), snap-frozen in liquid N2 and immediately stored at -80°C pending cryosectioning when samples were mounted on glass slides.
B. Scanning Acoustic Microscopy
The method outlined in this study was developed on a KSI 2000 microscope (PVA TePla Analytical Systems GmbH; Herborn, Germany) modified with a custom data acquisition and control system. A similar system has been described in detail by Raum [21] and is schematically shown in Fig. 1. In brief, the system operates at two frequency regimes; up to 400 MHz the acoustic lenses are excited with a short pulse, with a pulse width of around 1 ns, and at frequencies between 800 MHz and 2 GHz (which is the regime we have worked with), the lenses are excited with quasi monochromatic tone bursts, with burst length around 20 ns and a repetition rate of approximately 500 kHz.
The acoustic lens has a plano-concave design consisting of a sapphire cylindrical rod with a zinc oxide piezoelectric film deposited on one end as the transducer and a spherical cavity on the other end acting as an acoustic lens. For the 1 GHz lens used in this investigation, the cavity has an aperture of 80 μm in diameter and an included angle of 100°. The specimen was placed on a horizontal stage and scanned by the lens. An aqueous fluid provides acoustic coupling between the lens and the specimen; Ham’s F12 medium (Sigma-Aldrich; Dorset, UK) was used for the cells and distilled water for tissue.
All the SAM experiments were conducted in an air-conditioned laboratory and minimal temperature fluctuations were expected during the course of the experiments.
During operation, acoustic waves travel through the sapphire wave guide and are focused by the acoustic lens. The focused acoustic beam propagates through the coupling fluid and the specimen, before reaching the substrate. Reflections occur at the interfaces of lens/medium, medium/tissue and tissue/substrate due to mismatch of acoustic impedances (Fig. 1). The time delay and amplitude of the reflections provide information about the acoustic wave speed and attenuation in the specimen. The reflected waves are received by the same transducer and converted into electrical signals. A 20 ns time-window (gate) with variable time delay (gate position) is used as a temporal filter to allow specific signals to pass. After being amplified and integrated, these signals produce a single voltage signal proportional to the amplitude of the reflection that is then converted by a 500 kS/s analogue/digital converter card (USB-9201; National Instruments, Berkshire, UK) with a 12 bit resolution.
With this system, the lens is scanned horizontally in the x- and y-directions by a pair of oscillator coil drives to produce C-mode two-dimensional (2-D) images. The fast xy scanner is used to generate C-scan 512 × 512 pixel images with a scan area of 200 × 200 μm to be collected in around 10 s. The z-stage allows the lens-sample distance to be varied at increments down to 0.1 μm. The MATSAM software (Q-BAM Laboratory, Halle, Germany) that is used to control the system allows a series of C-scan images to be collected at incrementally decreasing lens-sample distances (Multilayer Analysis (MLA)) [31].
C. Multi-Layer Phase Analysis (MLPA)
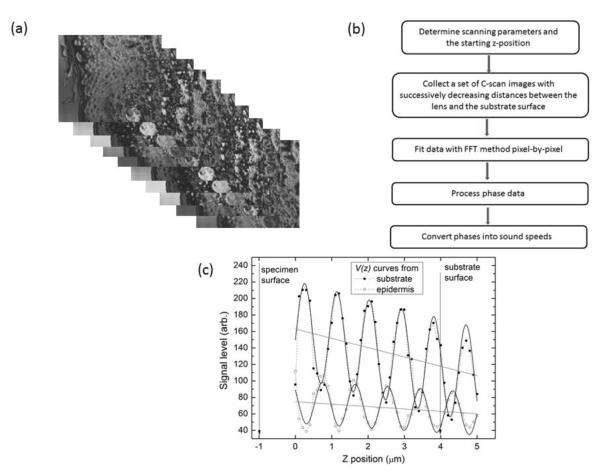
In each case, the lens was initially focused at the surface of the substrate (the polystyrene culture dish for cells or glass slide for the tissue sample) by monitoring the maximum output of the received signal with a gate setting optimized for in-focus signals. The lens was then raised 4 μm away from the substrate and a stack of images were taken at different z-positions commencing from this height towards the substrate surface with a step-size of 0.1 μm over a range of 5 μm (Fig. 2a). Scanning parameters, namely acoustic frequency and gate position were optimized for signal level and lateral resolution.
Fig. 2.
(a) A stack of images is collected with the MLPA method at 0.1 μm increments commencing with a z-position 4 μm above the substrate. (b) Summary of data acquisition and off-line analysis for MLPA method. (c) V(z) curves shown for different pixel positions from a stack of C-scan images obtained for a skin sample. Periodic oscillations are seen for both the substrate and for the region of tissue sampled (epidermal layer of the skin). The grey lines indicate the linear components (background) of the V(z) curves. The solid curves show the results of FFT fitting. Z-position at 0 represents the starting position. The arrows indicate the positions of specimen surface and substrate surface.
Following acquisition, the images were processed off-line with custom software developed with LABVIEW (National Instruments). The gray scale value for every pixel (x, y position) was extracted from all the images at each z position to form a V(z) curve. The V(z) data were filtered to remove the subtlety changing background and the remaining oscillation components were tapered with a Hanning window followed by Fast Fourier Transformation (FFT). The single frequency corresponding to the interpolated maximum amplitude was chosen as the spatial frequency νosc of the oscillation and similarly the phase value φosc of the oscillation determined [32, 33]. A 2D phase array was then recovered for the image; this was processed and used to calculate speed of sound. To determine the strength of transmission (inverse of attenuation) of the acoustic wave through the specimen, the maximum of the V(z) curve was used as the sum of all reflections and the average of the weakest V(z) curve (where the amplitude of oscillation is lower than its average) was taken as the contribution of the in-lens echo. The MLPA method is summarized in Fig. 2b.
It should be noted that the term Multi-Layer is used here to refer to the method of data acquisition which is based on the MLA method and not on the off-line processing of the data where the sum of all the reflections from a single layer is assumed.
III. RESULTS
A. Phase Analysis of Acoustic Images
Fig. 2c shows two V(z) curves extracted at different pixel positions from a stack of C-scan images (Fig 2a) taken from a skin sample. Each curve is composed of an oscillation superimposed over a smooth background. For the V(z) curve of the substrate, the background represents the reflection from the substrate surface (glass slide), the oscillations indicate the presence of interference with in-lens echoes. However, for the V(z) curve from the tissue, the oscillations represent the sum of all reflections travelling through the tissue and the background indicates the in-lens signal.
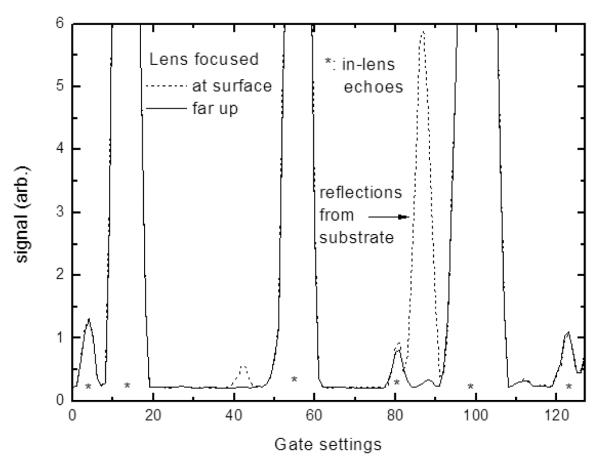
When the acoustic beam passes through the specimen and is focused on the substrate surface, the reflected wave reaches its maximum amplitude and any signal from the tissue surface (sample/fluid interface) is relatively weak, if not negligible, because the impedance mismatch is much lower than at the specimen/substrate interface. However, there are also echoes within the lens itself. Such waves can travel between the acoustic lens and zinc oxide film (transducer) many times due to the low attenuation within the sapphire buffer rod and generate a sequence of electrical pulses at the transducer. This is illustrated in Fig. 3 where in-lens echoes, either strong or weak, can be clearly identified. If appropriate gate settings are selected (e.g. around gate 82 in Fig. 3) interference occurs between the stray in-lens echo and the reflections from the specimen, which preserves relative timing information. The in-lens signal can therefore be used as a timing reference and the timing information (difference in phase) can be extracted from the gated V(z) response.
Fig. 3.
Signal intensity shown as a function of the lens gate settings. Even when the lens is focused at some distance from the sample surface, strong echoes which originate from within the lens can be identified
Assuming the reflections are expressed as Aeiωt for the in-lens echo and Bei(ωt+φ) from any of the interfaces, the final wave that reaches the transducer is:
| 1 |
with the new phase
| 2 |
and the new amplitude
| 3 |
Equation (3) demonstrates that the new amplitude is clearly a function of the phase difference φ.
It is obvious that C=A+B when the phase difference is 2nπ, and C=A-B when the phase difference is (2n+1)π (where n is an integer number). Normally when the exciting frequency and delay-time window are selected, the phase and amplitude of the in-lens echo will no longer change. However, the amplitude B of the reflected wave is a function of attenuation and consequently the phase value φ cannot be obtained directly from the detected amplitude C without knowing B. This problem can be overcome by moving the lens in the z direction, and as phase φ is a function of lens position with Δφ=2π*2Δz*f/(cmedium), where f is the frequency of the acoustic signal and cmedium is the acoustic wave speed in the coupling media, a periodic oscillation in the recorded voltage signals can be easily obtained with a V(z) scan. However, when the focus of the acoustic beam is far from the substrate surface or the attenuation of the specimen is high, reflections from the specimen/substrate and specimen/fluid interfaces could be comparable in amplitude and interfere significantly when overlapped in the time domain, which makes interpreting the V(z) curve more complicated. In order to characterize biological tissues and cells, only the interference between the reflection from the specimen/substrate interface and the in-lens echo is desired for calculating sound speed. To minimize the contribution from the specimen/fluid interface, firstly we use a 20 ns time window to select the time specific waveform to be processed (i.e. mostly the reflection from the substrate surface, as these two reflections reach the transducer with a difference in time). Secondly, the acoustic lens is positioned with the focus point beneath the specimen surface and near to the specimen/substrate interface enhancing the reflection from substrate surface and meanwhile resulting in negligible contribution of surface waves; this differs from a standard V(z) scan where the acoustic lens is focused deep into the substrate to make use of the excited surface waves [23].
B. MLPA applied to soft tissue sections
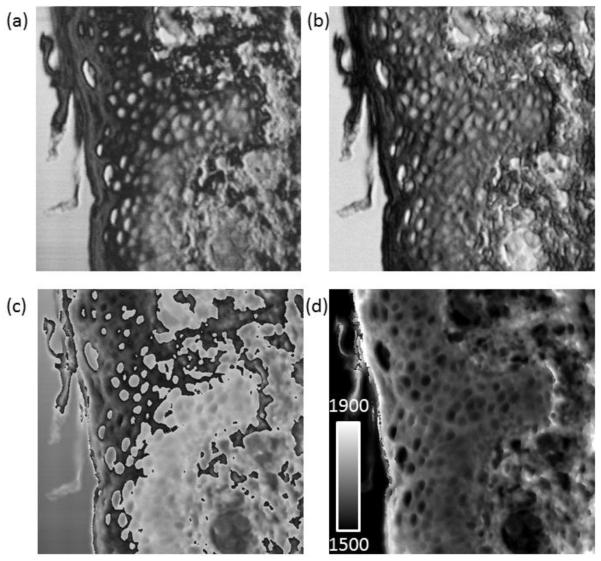
Fig. 4 shows images for the skin sample which are generated following processing of the images pixel by pixel. Together with the reconstructed transmission image (Fig. 4b), a 2-D phase array is recovered and a gray scale image is generated (Fig. 4c). Due to the intrinsic properties of FFT, the recovered phase is limited to within ±π, which introduces discontinuities into the image when the actual phase is beyond this limit. In order to unwrap these discontinuities, an appropriate integer multiple of 2π is added to each pixel element of the recovered phase map which can then be converted to a speed of sound map (Fig. 4d). In practice, the phase values may need to be adjusted accordingly to reflect the continuity of the specimen especially at locations where the mechanical properties change significantly. For skin, such a change may be seen in the cornified layer (stratum corneum) as compared to other regions of the epidermis. Furthermore, a change in relative lens-surface distance, either caused by an inclined substrate surface or uneven x-y scanning contour can contribute to the recovered phase value, and such contribution should be removed prior to further processing. Normally this can be done by simply subtracting the phase image of the interested area with another phase image obtained from a nearby exposed substrate area with the assumption that the two areas are parallel to each other.
Fig. 4.
200 × 200 μm images of a section of human skin (a) Typical SAM image collected at 1 GHz. (b) reconstructed transmission image (c) A 2-D phase array is recovered and a gray scale image is generated (d) Speed of sound map generated from the phase data. The scale ranges from 1500-1900 ms−1.
A. Speed of Sound Calculation from Phase Data
When the spatial frequency of the oscillation, determined from a V(z) curve, is denoted as νosc, and the phase of the oscillation as φosc-sub, for a V(z) curve taken from the exposed substrate φosc-tissue surface, and for a V(z) curve taken from the tissue specimen respectively, the following relations hold:
| 4 |
| 5 |
where d is the tissue thickness, and cmedium and ctissue are the sound speeds in the coupling medium and the tissue respectively, and f is the acoustic wave frequency.
Equations (4) and (5) can be rewritten as follows to determine the speed of sound in the sample:
| 6 |
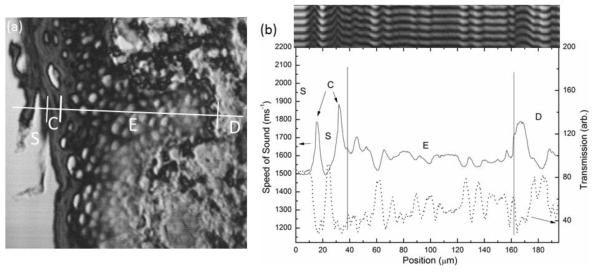
An example line profile is shown in Fig. 5 for skin where the variation in speed of sound is evident across the line.
Fig. 5.
SAM image showing a line profile through the different histological layers of the skin; glass substrate (S), cornified layer (C), epidermis (E) and dermis (D) (b) Speed of sound (solid line) and transmission signal (dotted line) values shown across these layers. Inset: reconstructed V(x, z) image.
B. Comparison of MLPA with V(f) method for cells
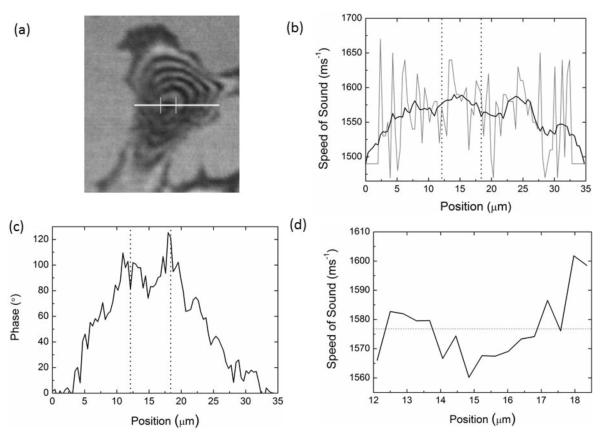
Here we use the example of measuring the acoustic wave speed in a well-adhered cell to compare MLPA with the frequency scanning or V(f) method using SAM. A single mouse fibroblast cell well-adhered to a polystyrene substrate was identified in culture and imaged in the SAM. Fig. 6a shows a typical SAM image of the cell obtained at a frequency of 1 GHz showing concentric interference fringes caused by variation in thickness from the cell edge to centre.
Fig. 6.
Comparison of V(f) and MLPA for cells. (a) Typical SAM image of a NIH3T3 mouse fibroblast with line profile marked for analysis (b) Sound speed as a function of position with the V(f) method. The grey line shows the actual values with the smoothed data shown in black. (c) Phase value as a function of position and (d) Sound speed determined from the phase data with the MLPA method.
A series of 6 images of the cell were obtained at 10 MHz intervals in the frequency range 960 – 1010 MHz. In order to compare the analysis methods, a further series of 50 images were obtained at 0.1 μm increments along the z-axis at a fixed frequency of 1 GHz. These two data sets were then processed using the V(f) method and the MLPA method respectively.
Fig. 6b shows the computed wave speed across the cell nucleus (marked as the line on Fig. 6a) using the V(f) method with the boundary values given in Table I. The result was very noisy and was smoothed by adjacent averaging with the data binned every 10 pixels. Using the unsmoothed data, the average wave speed through the centre of the cell was 1584 ± 8 ms−1.
Table I.
Bounds utilized for V(f) analysis of a 3t3 cell. The absolute and probable boundary values were defined as outlined in [16]
| Parameter | Absolute Bounds | Probable Bounds |
|---|---|---|
| Speed of sound (ms−1) | 1450-1700 | 1500-1650 |
| Cell thickness (μm) | 0-5 | 0.01-4 |
| Cell density (g cm−3) | 0.9-1.3 | 1-1.12 |
Fig. 6c shows the phase data calculated from the image stack, using the MLPA method, across the same marked region as analysed using the V(f) method. The mean speed of sound across the cell nucleus was computed from this data and is presented in Fig. 6d. On comparison with Fig. 6b it is clear that this method (using a constant frequency) produces data with considerably less noise. The average wave speed across the nucleus region using the MLPA method was 1577 ± 3 ms−1.
At first it appears that the two methods of analysing the SAM data produce similar values. However, further investigation of the V(f) method showed it to be highly sensitive to the initial boundary values used.
The influence of the initial boundary values of wave speed on the computed optimised wave speed using the V(f) method is demonstrated in Table II. The final optimised wave speed is seen to be extremely sensitive to the bounding values with the range of computed wave speeds being significantly greater than the experimental scatter.
Table II.
Different bounds for speed of sound determination with V(f) for cells. Bounds for cell thickness indicated with.
| Absolute bounds | Probable bounds | Speed of Sound (ms−1) |
|---|---|---|
| 1450-1700 | 1500-1650 | 1584 ± 8 |
| 1450-1650 | 1500-1600 | 1546 ± 6 |
| 1450-1700 | 1500-1600 | 1549 ± 9 |
| 1500-1700 | 1550-1650 | 1599 ± 9 |
| 1550-1700 | 1600-1650 | 1664 ± 6 |
| 0-5* | 0.01-4* | 1584 ± 8 |
| 2-5* | 3-4* | 1576 ± 1 |
| 2.5-5* | 3-4* | 1598 ± 1 |
All other bounds are bounds of speed of sound.
The influence of the boundary values of specimen thickness (Table II) is less marked than that for wave speed but is at least comparable, if not greater than the experimental scatter.
It appears that the limited number of data points utilised by the V(f) method and the large number of starting parameters that have to be optimised, result in the estimated wave speeds being highly dependent on the upper and lower bounds.
To some extent, the influence of specimen thickness bounds can be alleviated by inspecting the image of the cell (Fig. 6a) and using the interference fringes to define realistic bounds at each location on the cell. However, the need for operator intervention reduces the utility of the V(f) approach to determine cell properties from SAM data.
C. Comparison of MLPA with V(f) method for skin cryosections
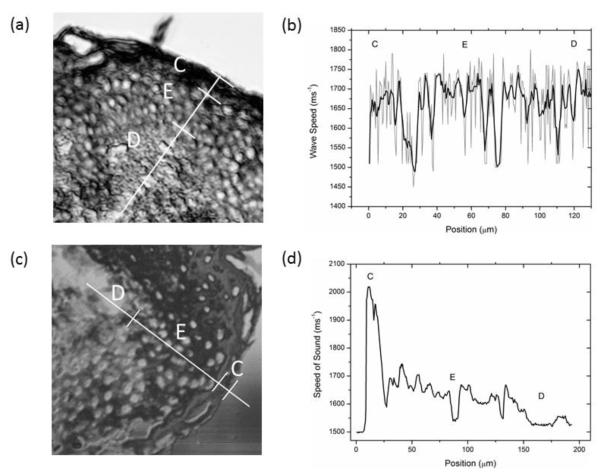
A similar comparison between the two analysis methods can be carried out using skin samples. Fig. 7 shows V(f) data alongside MLPA data for skin sections from the same donor and anatomical site. The raw line profile data from the V(f) method is very noisy (Fig. 7b), as was the case with the cell sample (Fig. 6b) and requires smoothing. The MLPA data is much less noisy (Fig. 7c). Further, the variation in speed of sound data across histological layers is much clearer with the MLPA approach (e.g. the large difference in acoustic wave velocity between the cornified layer and rest of the epidermis).
Fig. 7.
Comparison of V(f) and MLPA for skin. (a) Typical SAM image collected with the V(f) method with line profile marked for analysis (b) Sound speed as a function of position determined with the V(f) method. The grey line shows the actual values with the smoothed data shown in black. (c) Typical image from MLPA stack and (d) Sound speed profile determined with the MLPA method. The data collected with the latter method is less noisy and shows a clear transition in sound speed from the cornified layer (C) through to the epidermis (E) and dermis (D).
When comparing the data extracted from the SAM images of cells, the optimised value of the acoustic wave velocity determined using the V(f) method is very sensitive to the initial bounding values. In the case of thin histological specimens it was not possible to obtain an independent estimate of sample thickness as was available from counting the interference rings on the cell specimen. It is possible to estimate bounds for the acoustic wave speed values using literature data, e.g. the values recorded by Moran [34] or through the use of reference tables [35]. Table III shows how changing the input bounds in the V(f) analysis alter the optimised acoustic wave speed in the skin sample. As was the case with the cell analysis, the variation in value is much greater than the statistical scatter across a specimen.
Table III.
Different bounds for speed of sound determination for skin sample with V(f).
| Absolute bounds | Probable bounds | Speed of Sound (ms−1) |
|---|---|---|
| 1400-1800 | 1500-1750 | 1666 ± 5 |
| 1400-1750 | 1500-1700 | 1622 ± 5 |
| 1400-1800 | 1500-1700 | 1624 ± 5 |
| 1450-1800 | 1550-1750 | 1695 ± 4 |
| 1500-1800 | 1600-1750 | 1698 ± 3 |
The accuracy of the speed of sound measurements is generally governed by the speed of sound in the reference medium, the accuracy of specimen thickness and the accuracy of measuring the time differences in the acoustic signals [34]. For the V(f) method, the specimen thickness is the most important criteria for determining reliable speed of sound values (Table II).
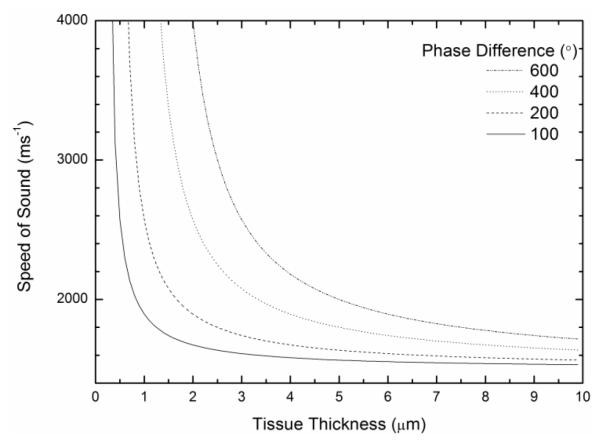
This is more critical for soft tissues, because with cells, counting interference rings can be used to determine their thickness. For soft tissues, the nominal thickness to which the tissues have been sectioned has to be relied on. However, Fig. 8 demonstrates that with the MLPA approach, the error in the speed of sound values when the specimen thickness is under or overestimated for a soft tissue section is small, particularly when the phase difference is low e.g. if the actual thickness of a tissue section is 6 μm and the inputted thickness is ± 1μm. In our case, tissues were sectioned at a thickness of 5 μm. For soft tissues such as skin which were imaged in this study, phase values are around 300° as compared to 100° for cells.
Fig. 8.
The absolute thickness is dependent on the thickness value that is used in Equation (6). Speed of sound variation with inputted thickness values is demonstrated here. The error in the speed of sound values decreases with thicker sections or when there is a smaller phase difference.
Fig. 8 demonstrates that an under- or overestimation of this thickness gives rise to only a small error in wave speed, when using the MLPA method. Accurate thickness measurements are more critical with thinner sections or when the phase difference is high. The V(f) method introduces the additional problem of determining suitable absolute and probable bounds prior to estimation of speed of sound values. In addition, the V(f) method assumes that the focal position is determined with a high accuracy, which is difficult to achieve in practice [36].
Phase imaging with SAM has been used previously for thin film characterisation as this yields additional information that cannot be extracted from acoustic amplitude images alone [37, 38] We now combine multilayer analysis [21] with phase analysis; with our approach the method becomes an extremely powerful tool for locally (~1 μm spatial resolution) characterising the acoustic wave speed in cells and soft tissues. However, the acquisition times per dataset under the current MLPA method are relatively long compared to the V(f) method. For the data presented in this paper, acquisition of the V(z) image stack took around 13 minutes: the image stack was composed of 50 images with a 5 μm change in z-position and a 0.1 μm z-axis step size. In contrast, with the V(f) method often around 6 images are recorded at incrementally increasing frequencies [18], thereby resulting in an acquisition time of approximately 1 minute with a 200 × 200 μm scan field and 512 × 512 pixel resolution.
Although the acquisition time is not a limiting factor for the characterisation of soft tissues, it is an important factor if SAM is to be used as a time resolved tool for cell biology where the temporal resolution of a migrating cell may be important [11]. In such instances, the MLPA method may require further development such as using lower image resolution to reduce the total time required, or a modified protocol for the MLPA method e.g. determining a lower bound to the number of images required for accurate analysis.
IV. CONCLUSIONS
We present a new quantitative analysis method for ultra-high frequency SAM which is suitable for determining the elastic properties of soft tissues and cells. This approach, the MLPA method, exploits the phase information that is preserved in the interference between acoustic wave reflected from the substrate surface as well as internal reflections from the acoustic lens.
ACKNOWLEDGMENTS
The authors would like to thank Dr Sebastian Brand (Fraunhofer Institute of Material Mechanics, Germany) and Professor Kay Raum (Julius Wolff Institut & Berlin-Brandenburg School for Regenerative Therapies, Germany) who developed the MATSAM software used to collect the acoustic images and Dr Carsten Riis (Aarhus University Hospital, Denmark) who kindly provided access to STAN software used for V(f) analysis.
The authors are grateful to the Wellcome Trust (WT085981AIA), BBSRC, AgeUK (Senior Fellowship awarded to MJS: Grant No. 266) and the British Heart Foundation for funding (Advanced Training Award FS/08/036/25364 to RA).
Contributor Information
Xuegen Zhao, School of Materials, The University of Manchester UK (xuegen.zhao@manchester.ac.uk).
Riaz Akhtar, School of Materials and Cardiovascular Sciences Research Group (Manchester Academic Health Science Centre), The University of Manchester UK.
Nadja Nijenhuis, Faculty of Life Sciences, Michael Smith Building, Oxford Road,Manchester,M13 9PT, The University of Manchester UK (nadja.nijenhuis@manchester.ac.uk).
Steven J. Wilkinson, School of Materials, The University of Manchester UK (steven.wilkinson@manchester.ac.uk)
Lilli Murphy, School of Materials, The University of Manchester UK (lilli.murphy@hotmail.co.uk).
Christoph Ballestrem, Faculty of Life Sciences, Michael Smith Building, Oxford Road,Manchester,M13 9PT, The University of Manchester UK (christoph.ballestrem@manchester.ac.uk).
Michael. J. Sherratt, Faculty of Medical & Human Sciences, Manchester Academic Health Science Centre, The University of Manchester UK (michael.j.sherratt@manchester.ac.uk)
Rachel E.B. Watson, Faculty of Medical & Human Sciences, Manchester Academic Health Science Centre,, The University of Manchester UK (rachel.watson@manchester.ac.uk)
Brian Derby, School of Materials, The University of Manchester, UK (brian.derby@manchester.ac.uk).
REFERENCES
- [1].Naylor EC, Watson REB, Sherratt MJ. Molecular aspects of skin ageing. Maturitas. 2011 doi: 10.1016/j.maturitas.2011.04.011. [DOI] [PubMed] [Google Scholar]
- [2].Sherratt MJ. Tissue elasticity and the ageing elastic fibre. Age. 2009 Dec;31:305–325. doi: 10.1007/s11357-009-9103-6. [DOI] [PMC free article] [PubMed] [Google Scholar]
- [3].Boutouyrie P, Tropeano AI, Asmar R, Gautier I, Benetos A, Lacolley P, Laurent S. Aortic stiffness is an independent predictor of primary coronary events in hypertensive patients - A longitudinal study. Hypertension. 2002 Jan;39:10–15. doi: 10.1161/hy0102.099031. [DOI] [PubMed] [Google Scholar]
- [4].Aoun S, Blacher J, Safar ME, Mourad JJ. Diabetes mellitus and renal failure: effects on large artery stiffness. Journal of Human Hypertension. 2001 Oct;15:693–700. doi: 10.1038/sj.jhh.1001253. [DOI] [PubMed] [Google Scholar]
- [5].Cruickshank K, Riste L, Anderson SG, Wright JS, Dunn G, Gosling RG. Aortic pulse-wave velocity and its relationship to mortality in diabetes and glucose intolerance - An integrated index of vascular function? Circulation. 2002 Oct;106:2085–2090. doi: 10.1161/01.cir.0000033824.02722.f7. [DOI] [PubMed] [Google Scholar]
- [6].Akhtar R, Sherratt MJ, Cruickshank JK, Derby B. Characterizing the elastic properties of tissues. Materials Today. 2011;14:96–105. doi: 10.1016/S1369-7021(11)70059-1. [DOI] [PMC free article] [PubMed] [Google Scholar]
- [7].Suresh S. Biomechanics and biophysics of cancer cells. Acta Biomaterialia. 2007 Jul;3:413–438. doi: 10.1016/j.actbio.2007.04.002. [DOI] [PMC free article] [PubMed] [Google Scholar]
- [8].Van Vliet KJ, Bao G, Suresh S. The biomechanics toolbox: experimental approaches for living cells and biomolecules. Acta Materialia. 2003 Nov;51:5881–5905. [Google Scholar]
- [9].Lim CT, Zhou EH, Li A, Vedula SRK, Fu HX. Experimental techniques for single cell and single molecule biomechanics. Materials Science and Engineering: C. 2006 Sep;vol:1278–1288. [Google Scholar]
- [10].Kirmizis D, Logothetidis S. Atomic force microscopy probing in the measurement of cell mechanics. International Journal of Nanomedicine. 2010;5:137–145. doi: 10.2147/ijn.s5787. [DOI] [PMC free article] [PubMed] [Google Scholar]
- [11].Liang HD, Blomley MJK. The role of ultrasound in molecular imaging. British Journal of Radiology. 2003;76:S140–S150. doi: 10.1259/bjr/57063872. [DOI] [PubMed] [Google Scholar]
- [12].Akhtar R, Schwarzer N, Sherratt MJ, Watson REB, Graham HK, Trafford AW, Mummery PM, Derby B. Nanoindentation of histological specimens: Mapping the elastic properties of soft tissues. Journal of Materials Research. 2009 Mar;24:638–646. doi: 10.1557/JMR.2009.0130. [DOI] [PMC free article] [PubMed] [Google Scholar]
- [13].Charras GT, Horton MA. Single cell mechanotransduction and its modulation analyzed by atomic force microscope indentation. Biophysical Journal. 2002 Jun;82:2970–2981. doi: 10.1016/S0006-3495(02)75638-5. [DOI] [PMC free article] [PubMed] [Google Scholar]
- [14].Daft CMW, Briggs GAD. THE ELASTIC MICROSTRUCTURE OF VARIOUS TISSUES. Journal of the Acoustical Society of America. 1989 Jan;85:416–422. doi: 10.1121/1.397693. [DOI] [PubMed] [Google Scholar]
- [15].Kundu T, Bereiter-Hahn J, Karl I. Cell property determination from the acoustic microscope generated voltage versus frequency curves. Biophysical Journal. 2000 May;78:2270–2279. doi: 10.1016/S0006-3495(00)76773-7. [DOI] [PMC free article] [PubMed] [Google Scholar]
- [16].Saijo Y, Ohashi T, Sasaki H, Sato M, Jorgensen CS, Nitta SI. Application of scanning acoustic microscopy for assessing stress distribution in atherosclerotic plaque. Annals of Biomedical Engineering. 2001 Dec;29:1048–1053. doi: 10.1114/1.1424912. [DOI] [PubMed] [Google Scholar]
- [17].Saijo Y, Jorgensen CS, Mondek P, Sefranek V, Paaske W. Acoustic inhomogeneity of carotid arterial plaques determined by GHz frequency range acoustic microscopy. Ultrasound in Medicine and Biology. 2002 Jul;28:933–937. doi: 10.1016/s0301-5629(02)00527-6. [DOI] [PubMed] [Google Scholar]
- [18].Jensen AS, Baandrup U, Hasenkam JM, Kundu T, Jorgensen CS. Distribution of the microelastic properties within the human anterior mitral leaflet. Ultrasound in Medicine and Biology. 2006 Dec;32:1943–1948. doi: 10.1016/j.ultrasmedbio.2006.06.011. [DOI] [PubMed] [Google Scholar]
- [19].BereiterHahn J, Karl I, Luers H, Voth M. Mechanical basis of cell shape: Investigations with the scanning acoustic microscope. Biochemistry and Cell Biology-Biochimie Et Biologie Cellulaire. 1995 Jul-Aug;73:337–348. doi: 10.1139/o95-042. [DOI] [PubMed] [Google Scholar]
- [20].Goodman O, Derby B. The mechanical properties of float glass surfaces measured by nanoindentation and acoustic microscopy. Acta Materialia. 2011 Feb;59:1790–1799. [Google Scholar]
- [21].Raum K. Microelastic imaging of bone. Ieee Transactions on Ultrasonics Ferroelectrics and Frequency Control. 2008 Jul;55:1417–1431. doi: 10.1109/TUFFC.2008.817. [DOI] [PubMed] [Google Scholar]
- [22].Briggs GAD. An introduction to scanning acoustic microscopy. Oxford University Press; New York: 1985. [Google Scholar]
- [23].Kushibiki J, Chubachi N. MATERIAL CHARACTERIZATION BY LINE-FOCUS-BEAM ACOUSTIC MICROSCOPE. Ieee Transactions on Sonics and Ultrasonics. 1985;32:189–212. [Google Scholar]
- [24].Sasaki H, Saijo Y, Tanaka M, Okawai H, Terasawa Y, Yambe T, Nitta S. Influence of tissue preparation on the high-frequency acoustic properties of normal kidney tissue. Ultrasound in Medicine and Biology. 1996;22:1261–1265. doi: 10.1016/s0301-5629(96)00150-0. [DOI] [PubMed] [Google Scholar]
- [25].Kamanyi A, Ngwa W, Betz T, Wannemacher R, Grill W. Combined phase-sensitive acoustic microscopy and confocal laser scanning microscopy. Ultrasonics. 2006 Dec;44:E1295–E1300. doi: 10.1016/j.ultras.2006.05.030. [DOI] [PubMed] [Google Scholar]
- [26].Kundu T, Bereiterhahn J, Hillmann K. MEASURING ELASTIC PROPERTIES OF CELLS BY EVALUATION OF SCANNING ACOUSTIC MICROSCOPY V(Z) VALUES USING SIMPLEX ALGORITHM. Biophysical Journal. 1991 Jun;59:1194–1207. doi: 10.1016/S0006-3495(91)82335-9. [DOI] [PMC free article] [PubMed] [Google Scholar]
- [27].Kundu T, Bereiterhahn J, Hillmann K. CALCULATING ACOUSTICAL PROPERTIES OF CELLS - INFLUENCE OF SURFACE-TOPOGRAPHY AND LIQUID LAYER BETWEEN CELL AND SUBSTRATE. Journal of the Acoustical Society of America. 1992 May;91:3008–3017. doi: 10.1121/1.402935. [DOI] [PubMed] [Google Scholar]
- [28].Okawai H, Tanaka M, Dunn F. NONCONTACT ACOUSTIC METHOD FOR THE SIMULTANEOUS MEASUREMENT OF THICKNESS AND ACOUSTIC PROPERTIES OF BIOLOGICAL TISSUES. Ultrasonics. 1990 Nov;28:401–410. doi: 10.1016/0041-624x(90)90064-u. [DOI] [PubMed] [Google Scholar]
- [29].Jorgensen CS, Hasenkam JM, Kundu T. Measurement of material properties of hard and soft biological tissues by means of V(z) and V(f) curves obtained with acoustic microscopy. In: Kundu T, editor. Advanced Nondestructive Evaluation for Structural and Biological Health Monitoring. vol. 4335. Spie-Int Soc Optical Engineering; Bellingham: 2001. pp. 244–253. [Google Scholar]
- [30].Graham HK, Akhtar R, Kridiotis C, Derby B, Kundu T, Trafford AW, Sherratt MJ. Localised micro-mechanical stiffening in the ageing aorta. Mechanisms of Ageing and Development. 2011 doi: 10.1016/j.mad.2011.07.003. [DOI] [PMC free article] [PubMed] [Google Scholar]
- [31].Raum K, Jenderka KV, Klemenz A, Brandt J. Multilayer analysis: Quantitative scanning acoustic microscopy for tissue characterization at a microscopic scale. Ieee Transactions on Ultrasonics Ferroelectrics and Frequency Control. 2003 May;50:507–516. [Google Scholar]
- [32].Grandke T. INTERPOLATION ALGORITHMS FOR DISCRETE FOURIER-TRANSFORMS OF WEIGHTED SIGNALS. Ieee Transactions on Instrumentation and Measurement. 1983;32:350–355. [Google Scholar]
- [33].Jain VK, Collins WL, Davis DC. HIGH-ACCURACY ANALOG MEASUREMENTS VIA INTERPOLATED FFT. Ieee Transactions on Instrumentation and Measurement. 1979;28:113–122. 1979. [Google Scholar]
- [34].Moran CM, Bush NL, Bamber JC. ULTRASONIC PROPAGATION PROPERTIES OF EXCISED HUMAN SKIN. Ultrasound in Medicine and Biology. 1995;21:1177–1190. doi: 10.1016/0301-5629(95)00049-6. [DOI] [PubMed] [Google Scholar]
- [35].Duck FA. Physical Properties of Tissue. A Comprehensive Reference Book. Academic Press; London: 1990. [Google Scholar]
- [36].Weiss EC, Anastasiadis P, Pilarczyk G, Lemor RM, Zinin PV. Mechanical properties of single cells by high-frequency time-resolved acoustic Microscopy. Ieee Transactions on Ultrasonics Ferroelectrics and Frequency Control. 2007 Nov;54:2257–2271. doi: 10.1109/tuffc.2007.530. [DOI] [PubMed] [Google Scholar]
- [37].Every AG, Hillmann K, Wurz KU, Hasselmann H, Grill W. Singularities in surface acoustic microscopy phase images. Physica B. 1996 Apr;220:714–716. [Google Scholar]
- [38].Sasaki Y, Endo T, Yamagishi T, Sakai M. THICKNESS MEASUREMENT OF A THIN-FILM LAYER ON AN ANISOTROPIC SUBSTRATE BY PHASE-SENSITIVE ACOUSTIC MICROSCOPE. Ieee Transactions on Ultrasonics Ferroelectrics and Frequency Control. 1992 Sep;39:638–642. doi: 10.1109/58.156182. [DOI] [PubMed] [Google Scholar]


