Abstract
In skeletal muscle, the transcription factors Foxo1 and Foxo3A control expression of proteins that mediate muscle atrophy, making the nuclear concentration and nuclear-cytoplasmic movements of Foxo1 and Foxo3A of therapeutic interest in conditions of muscle wasting. Here, we use Foxo-GFP fusion proteins adenovirally expressed in cultured adult mouse skeletal muscle fibers to characterize the time course of nuclear efflux of Foxo1-GFP in response to activation of the insulin-like growth factor-1 (IGF-1)/phosphatidylinositol-3-kinase (PI3K)/Akt pathway to determine the time course of nuclear influx of Foxo1-GFP during inhibition of this pathway and to show that Akt mediates the efflux of nuclear Foxo1-GFP induced by IGF-1. Localization of endogenous Foxo1 in muscle fibers, as determined via immunocytochemistry, is consistent with that of Foxo1-GFP. Inhibition of the nuclear export carrier chromosome region maintenance 1 by leptomycin B (LMB) traps Foxo1 in the nucleus and results in a relatively rapid rate of Foxo1 nuclear accumulation, consistent with a high rate of nuclear-cytoplasmic shuttling of Foxo1 under control conditions before LMB application, with near balance of unidirectional influx and efflux. Expressed Foxo3A-GFP shuttles ∼20-fold more slowly than Foxo1-GFP. Our approach allows quantitative kinetic characterization of Foxo1 and Foxo3A nuclear-cytoplasmic movements in living muscle fibers under various experimental conditions.
Keywords: nuclear influx, leptomycin B, PP2A, IGF-1, Akt
the fox (forkhead box) transcription factor superfamily, including the Foxo family, is characterized by a common 100-residue DNA-binding domain known as the forkhead domain. Foxo is an evolutionarily conserved transcription factor family that is a major player in many vital cellular functions such as cell proliferation, cell cycle, and cellular survival (1, 23). There are four members of the forkhead transcription factor family in humans; Foxo1, Foxo3A, Foxo4, and Foxo6. These are all expressed in skeletal muscle except Foxo6, which is mainly expressed in the brain (16). In adult mice, Foxo1 is expressed in many tissue types but most strongly in ovary and uterus tissue; Foxo3 (the murine ortholog of Foxo3A) is expressed in all tissue types studied in Biggs et al. (4), whereas Foxo4 is only expressed in skeletal muscle. However, Foxo1 and Foxo3A are the forkhead transcription factors associated with muscle atrophy and upregulation of either one individually has been shown to be sufficient to induce muscle atrophy (17, 26). Foxo1 knockout mice are embryonic lethal, and cre-mediated disruption of Foxo1 expression indicates that Foxo1 acts as a tumor suppressor (14, 34). In muscle, Foxo1 has been shown to regulate myotube differentiation and skeletal muscle fiber type remodeling (15, 32). Activation of the Foxo pathway leads to expression of atrogene products Atrogin-1/MAFbx and MuRF-1, proteins that are integral to the development of muscle atrophy (5, 19, 26).
The phosphorylation status of Foxo regulates its nuclear entry and activation of atrogenes. Foxo1 has three highly conserved Akt [also known as protein kinase B (PKB)] phosphorylation sites; Thr-24, Ser-256, and Ser-319 in human Foxo1 (1, 7, 24). Many growth stimuli, such as insulin-like growth factor-1 (IGF-1), can bind to membrane-bound receptors that activate phosphatidylinositol-3-kinase (PI3K) and subsequently Akt (10, 12). Although the primary regulation of Foxo occurs through Akt-mediated phosphorylation, serum- and glucocorticoid-inducible kinase (SGK) has the ability to phosphorylate these residues as well. Casein kinase 1 (CK1), DYRK1A, and other kinases have different recognized phosphorylation sites (9, 25, 36). Ser-256, which is phosphorylated by Akt, is located in a basic region at the COOH-terminal end of the DNA binding domain (DBD) that has been shown to function as a nuclear localization signal (38). There is a leucine-rich nuclear export signal in the region COOH-terminal to the DBD of Foxo1. In FL5.12 and NIH 3T3 cell lines, phosphorylated Foxo1 can be dephoshosphorylated by PP2A, a serine/threonine phosphatase, allowing Foxo1 to enter the nucleus. Okadaic acid (OA), a PP2A inhibitor, prevents this dephosphorylation, thereby inhibiting the nuclear influx of Foxo1 (37).
Although the pathway for Foxo1 regulation has been explored in depth in many muscle and nonmuscle tissue types, the extent and kinetics of its nuclear-cytoplasmic redistribution in response to various physiological, pathological, and pharmacological stimuli have not been fully defined in skeletal muscle, where the mechanism underlying muscle atrophy is of therapeutic interest. Further characterization of this pathway strives to aid in the development of new therapeutic avenues to minimize, and possibly treat, skeletal muscle atrophy in diseases such as sepsis, severe insulinopenia, HIV, as well as age-related muscle atrophy (37).
Here, we use confocal microscopy to image adenovirally expressed Foxo1-GFP (adFoxo1-GFP) or Foxo3A-GFP (adFoxo3A-GFP) in living cultured adult skeletal muscle fibers to determine the kinetics of their nuclear-cytoplasmic translocation and what factors affect these kinetics. We demonstrate that under resting conditions Foxo1 is cycling into and out of the nucleus rapidly, but Foxo3A is cycling 20 times slower. Nuclear entry of Foxo1 can be blocked by activation of the IGF-1/PI3K/Akt pathway or by inhibition of the phosphatase PP2A. Leptomycin B (LMB) irreversibly binds to chromosome region maintenance 1 (CRM1) and inhibits nuclear efflux of Foxo1, thereby enabling the calculation of the rates of unidirectional nuclear influx under conditions with different levels of phosphorylation of Foxo1. Comparison of the responses of endogenous Foxo1 and adenovirally expressed Foxo1-GFP to the treatments described above identifies our model system as being an accurate and useful tool in the kinetic study of changes in subcellular distribution of Foxo1 in skeletal muscle fibers.
MATERIALS AND METHODS
Materials.
OA, staurosporine, and IGF-1 were purchased from Sigma Aldrich (St. Louis, MO) and leptomycin B from LC Laboratories (Woburn, MA). The Akt inhibitor Akt-I-1,2 and the PI3K inhibitor LY294002 were obtained from Calbiochem (Darmstadt, Germany).
Isolation and culture of adult flexor digitorum brevis muscle fibers.
The flexor digitorum brevis (FDB) was isolated from adult female CD1 mice (4–6 wk old). Animals were euthanized by asphyxiation via CO2 followed by cervical dislocation according to protocols approved by the University of Maryland Institutional Animal Care and Use Committee. Individual fibers were enzymatically dissociated and cultured using a modified protocol previously described in Liu et al. (18). Briefly, the muscle was incubated in MEM (Invitrogen, Carlsbad, CA) containing 3.5 μg/ml collagenase type I (Sigma-Aldrich), 10% FBS, and 50 μg/ml gentamicin for 2 h at 37° to enzymatically dissociate the muscle. Manual manipulation to separate individual fibers was done by triturating the muscle gently in media containing no collagenase. Approximately 50 fibers were then plated in a laminin-coated glass-bottomed dish.
Adenoviral infection of cultured FDB fibers.
Fibers were plated in 2 ml serum-free MEM with 9.2 × 10⁴ plaque-forming units/μl adFoxo1-GFP or 4.8 × 10³ plaque-forming units/μl adFoxo3A-GFP lysate and incubated for 48–72 h. The adenovirus encoding Foxo1-GFP was a gift from Dr. Joseph Hill (University of Texas Southwestern Medical Center; Ref. 20), and the Foxo3A-GFP adenovirus was purchased from Applied Biological Materials (Richmond, British Columbia, Canada; catalog no. 000420A). Both adenoviruses were amplified in our laboratory. In both constructs, the GFP fusion tag is attached at the COOH-terminal of Foxo.
Confocal fluorescence imaging of living cultured adult muscle fibers.
A half hour before imaging, the culture dish was removed from the incubator and the culture media were removed and replaced with L-15 media (Invitrogen). The culture dish was then set on the stage of an Olympus IX70 inverted microscope equipped with an Olympus FLUOVIEW 500 laser scanning confocal imaging system with excitation wavelengths of 488 and 647 nm. Fibers were viewed with an Olympus ×60/1.2 NA water-immersion objective and scanned at zoom 3 (except see Fig. 1, A and B, and 3, A and B, which were scanned at zoom 1) using consistent laser output and gain. Then, 30 min after media change to L-15, images were taken for 30 min at 10-min increments to establish a baseline in each individual fiber. After the last baseline image was taken, LMB or other treatment was added to the dish and time was set to begin from 0 min at that point. Once the experiment began, the medium was not removed at any point; only additions of small volumes of reagents were made.
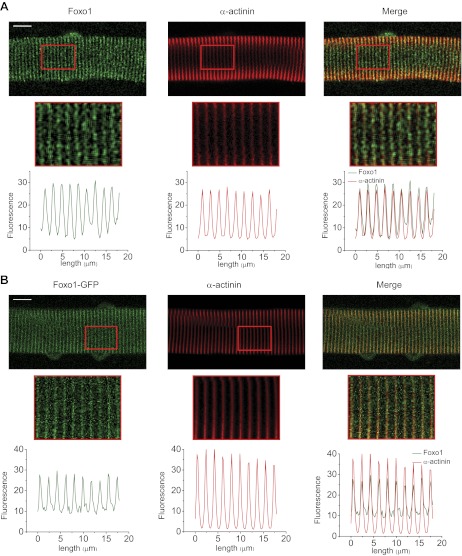
Fig. 1.
Subsarcomeric distribution of endogenous Foxo1 and exogenous Foxo1-GFP. Representative confocal images of immunocytochemistry assays of endogenous Foxo1 (A) and fluorescence of Foxo1-GFP (B) with α-actinin establish its Z-line localization. A and B, top: large section of a fiber with a red square indicating the segment of the fiber that is magnified at bottom. Below each enlarged region is a graph demonstrating the total fluorescence of the enlarged region as a function of distance as detailed on the x-axis. Scale bars = 10 μm.
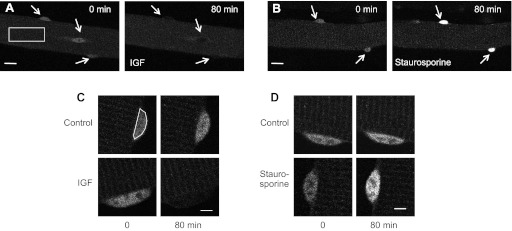
Fig. 3.
Broad spectrum kinase inhibitor staurosporine promotes Foxo1 nuclear entry. Representative confocal images of single fibers at 0 and 80 min of insulin-like growth factor-1 (IGF-1; A) or staurosporine (B) treatments, as labeled. White arrows point to nuclei. Over 80 min of IGF-1 treatment the nuclear concentration of Foxo1 nuclei decreases visibly whereas the nuclei of the fiber treated with staurosporine increase to the point of saturation. White box indicates an average cytoplasmic region used to quantify cytoplasmic fluorescence. Scale bars are 20 μm. Magnification of individual nuclei from control fibers, a fiber treated with IGF-1 (C), and a fiber treated with staurosporine (D), as labeled. Fluorescence of the control nuclei increase very slightly whereas IGF-1 treatment causes a decrease in nuclear fluorescence and staurosporine treatment causes an increase in nuclear fluorescence. White outline in C indicates the nuclear region used to quantify nuclear fluorescence. Scale bars = 5 μm.
In cases of strong nuclear uptake of Foxo1-GFP, including the fiber in results (see Fig. 3B), the nuclei of the fiber reached saturation of our detection system using the control laser intensity. Therefore, continued imaging used decreased laser intensity to avoid nuclear saturation. However, the images shown in results (see Fig. 3) were taken at the original laser intensity with saturated nuclei for qualitative comparison to show the overall extent of the effect. The change in laser intensity when saturation occurs does not affect our quantification of nuclear concentration because we calculate the nuclear concentration as a nuclear to cytoplasmic fluorescence ratio (n/c), and both the nuclear fluorescence and cytoplasmic fluorescence are affected by the same percent by change in laser intensity.
Image analysis.
The mean pixel fluorescence of the cytoplasm and nucleus from each image was quantified using an area of interest in Image J as indicated in results (see Fig. 3, A and C), and then the background mean pixel fluorescence was subtracted from each. The ratio of nuclear mean pixel fluorescence to cytoplasmic mean pixel fluorescence (n/c ratio) is calculated for each time point to allow comparison of nuclear fluorescence independent of expression levels of Foxo1-GFP and should be proportionate to nuclear concentration normalized to cytoplasmic level of expression. Student's t-tests were used for comparisons of data obtained from two experimental conditions, and differences were considered significant if P < 0.05.
Fluorescence immunocytochemistry.
Fluorescence immunocytochemistry was carried out as in Shen et al. (28). Briefly, fibers were fixed with 4% paraformaldehyde, permeabilized with 0.2% Triton-X-100 in PBS, and then blocked with 5% normal goat serum. Fibers were incubated with anti-Foxo1 (no. 2880; Cell Signaling), anti-α-actinin (Sigma), or anti-nucleophosmin (Zymed, San Francisco, CA) overnight followed by overnight incubation with a fluorescent-tagged secondary antibody. The stained fibers were imaged using the confocal microscope and lasers described above. Colocalization of immunofluorescence images were merged, and mean pixel fluorescence were measured as a function of distance for tracings and enhanced using ImageJ. No other image in this study was enhanced.
Western blotting.
Protein extraction and Western blotting techniques were performed as described in Shen et al. (31). Briefly, FDB were cultured for 2 days and then treated for 80 min as indicated. Fibers were then collected and mixed with M-PER (Thermo Scientific, Rockford, IL) and a protease inhibitor cocktail (Roche Diagnostics, Indianapolis, IN) and passed through a 21-gauge syringe several times, followed by high speed centrifugation. The supernatant was combined with sample reducing agent and LDS sample buffer (Invitrogen), heated at 70° for 10 min, and run on a NuPAGE Novex 4–12% Bis-Tris gel (Invitrogen). Proteins were transferred to a PVDF membrane. Akt antibody (no. 9272; Cell Signaling) and phosphospecific Akt antibody (no. 9271; Cell Signaling) were used and the membrane was then treated with ECL and film was exposed and developed.
RESULTS
Adenovirally expressed Foxo1-GFP is distributed in a manner consistent with endogenous Foxo1 in adult muscle fibers.
To establish a live adult muscle fiber system to explore the phosphorylation dependency of the kinetics of Foxo1 nuclear-cytoplasmic translocation in skeletal muscle, we infected cultured adult FDB fibers with an adenovirus coding for Foxo1-GFP, which can be tracked quantitatively in subcellular regions of living muscle fibers using fluorescence confocal microscopy. To validate this system, we first compared the sarcomeric localization as well as nuclear/cytoplasmic distribution of endogenous Foxo1 to that of adenovirally expressed Foxo1-GFP (Fig. 1). Using immunocytochemistry, we established the subsarcomeric colocalization of endogenous Foxo1 with α-actinin (Fig. 1A, right), a well-established Z-line protein. Foxo1-GFP also colocalized with α-actinin (Fig. 1B, right), demonstrating consistent Z-line localization of both expressed Foxo1-GFP and endogenous Foxo1. In agreement with these findings, antibody staining of Foxo1 and the fluorescence of Foxo1-GFP in fibers expressing Foxo1-GFP displayed colocalization (data not shown). Under resting conditions, Foxo1-GFP is also present in the nuclei in a generally diffuse pattern (Fig. 1B, left) but does not enter the nucleolus (data not shown).
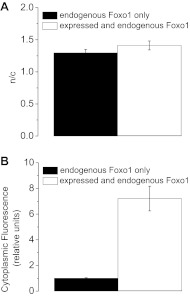
We next compared the n/c ratios of immunostained Foxo1-GFP and endogenous Foxo1 under control conditions. The normalization to cytoplasmic levels provides a means of comparing the concentrations of nuclear Foxo1 in a manner that is not expression dependent. The n/c ratios attained using immunocytochemistry of endogenous Foxo1 agreed very closely with n/c ratios of immunostained Foxo1-GFP under control conditions (Fig. 2A).
Fig. 2.
Nuclear/cytoplasmic fluorescence ratios (n/c) of expressed Foxo1-GFP and endogenous Foxo1. A: quantification of n/c ratios of Foxo1-GFP (n = 16/20) in white and antibody stain for endogenous Foxo1 (n = 16/22) in black showing nuclear/cytoplasmic distribution to be comparable under control conditions as determined using immunocytochemistry. B: Foxo1-GFP (n = 20) is determined to be expressed at a level 7-fold that of endogenous Foxo1 (n = 22). Data represent means ± SE.
To further characterize our conditions, we compared the cytoplasmic anti-Foxo1 fluorescence levels in fibers expressing Foxo1-GFP and in noninfected control fibers. We treated both sets of fibers with anti-Foxo1 primary antibody and conjugated Alexa-647 secondary antibody (which does not interfere with GFP emissions) and found that the total Foxo1 cytoplasmic concentration in infected fibers was approximately sevenfold that of uninfected fibers (Fig. 2B). A typical area of interest used for determining the mean pixel fluorescence of the cytoplasm in a confocal image for a given fiber is shown in white at left in Fig. 3A and that for a nucleus is shown in white in Fig. 3C.
The similarity in sarcomeric localization and nuclear/cytoplasmic distribution of expressed Foxo1-GFP and endogenous Foxo1, coupled with consistency in response to phosphorylating and dephosphorylating agents (see Fig. 4, bottom) leads us to conclude that adenovirally expressed Foxo1-GFP is a good model for endogenous Foxo1. The system of adenovirally expressed Foxo1-GFP in cultured adult skeletal muscle fibers is thus a useful tool for real-time monitoring of kinetics of translocation of Foxo1 in live cells in a quantitative manner.
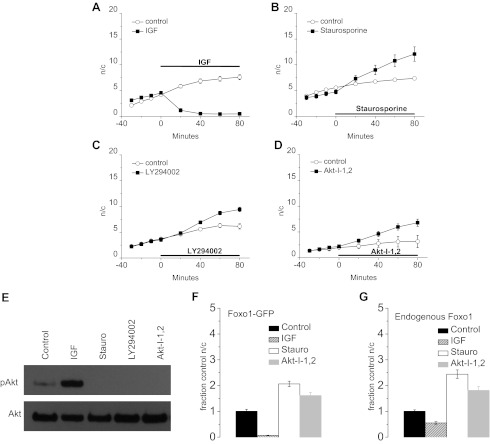
Fig. 4.
IGF-1 promotes reduction of nuclear Foxo1, whereas staurosporine and inhibitors of phosphatidylinositol-3-kinase (PI3K) and Akt increase nuclear Foxo1. A: 100 ng/ml IGF-1 treatment causes a decrease in the n/c ratio of Foxo1 (n = 4) over time compared with control fibers (n = 4). B: treatment with 1 μM staurosporine (n = 4) causes an increase in n/c Foxo1 above control levels (n = 5) indicating kinase dependency of Foxo1 cytoplasmic retention. Inhibition of PI3K (C) via LY294002 (n = 4; control n = 4) or inhibition of Akt (D) by Akt-I-1,2 (n = 4; control n = 7) increases the concentration of nuclear Foxo1. This indicates that the activity of PI3K and Akt are individually necessary for cytoplasmic retention of Foxo1. E: treatment with staurosporine (stauro), LY294002, and Akt-I-1,2 inhibited phosphorylation of Akt whereas IGF treatment increased phosphorylation of Akt as demonstrated with western blotting techniques for Akt and Akt phosphorylated at S473. Bar graphs of relative increase of nuclear Foxo1 as a fraction of control conditions in Foxo1-GFP (F) and endogenous Foxo1 (G) after 80-min control (endogenous n = 26; Foxo1-GFP n = 19) or 80-min treatments with IGF-1 (endogenous n = 27; Foxo1-GFP n = 4), staurosporine (endogenous n = 23; Foxo1-GFP n = 3), or Akt-I-1,2 (endogenous n = 29; Foxo1-GFP n = 6) as labeled. Autofluorescence and background values were subtracted from endogenous nuclear and cytoplasmic fluorescence values. Data represent means ± SE.
Nuclear-cytoplasmic movements of Foxo1 are kinase dependent.
Under the standard conditions used for these studies, fibers exposed to adenovirus Foxo1-GFP were cultured in serum-free media without added growth factors for 48–72 h. The media were then changed to L-15 imaging media (as described in materials and methods) with no added growth factors or serum. Treatment with 100 ng/ml IGF-1, a concentration that produces both mytogenic and myogenic responses in cultured myoblasts (11), caused a rapid and marked reduction in the concentration of nuclear Foxo1-GFP (Fig. 3, A and C). After 20 min of IGF-1 treatment, nuclear/cytoplasmic Foxo1-GFP decreased to 20% of control and by 40 min reached a steady level of 10% of control (Fig. 4A, squares). In comparison, a gradual increase in nuclear/cytoplasmic fluorescence of Foxo1-GFP was observed over the same time period in control fibers where no changes were made to the medium bathing the fibers (Fig. 4, A–D, open circles). This slow increase in nuclear/cytoplasmic Foxo1-GFP fluorescence is likely due to the previous removal of the culture media, which presumably contained secreted autocrine/paracrine growth factors produced by fibers during the 48–72 h of fiber culture (22), and the subsequent addition of growth factor-free imaging media. The cytoplasmic fluorescence showed little change with time when IGF-1 was included in the imaging media (data not shown).
Treatment with 1 μM staurosporine, a nonspecific kinase inhibitor, had the opposite effect from IGF-1; it caused a rapid increase in nuclear Foxo1 (Figs. 3, B and D, and 4B). After 20 min, the nuclear concentration of Foxo1 increased by 40%, and over 80 min it increased by 144% (Fig. 4B). The opposite changes in nuclear Foxo1-GFP in response to treatment with IGF-1, an upstream activator of several kinases including Akt, and staurosporine, a nonspecific kinase inhibitor, demonstrate the phosphorylation dependence of nuclear fluxes of Foxo1.
PI3K/Akt pathway is necessary for Foxo1 phosphorylation.
To determine the pathway(s) involved in the phosphorylation of Foxo1, which regulates the nuclear-cytoplasmic fluxes of Foxo1, we employed specific kinase inhibitors. 25 μM LY294002, a specific PI3K inhibitor, induced an increase in nuclear Foxo1-GFP within 40 min (Fig. 4C). Akt-I-1,2 is a selective inhibitor of Akt 1 and Akt 2 that does not cause significant inhibition of other kinases with the exception of CaMK1, a kinase that, to our knowledge, does not affect the phosphorylation status of Foxo1 (2, 3). The Akt inhibitor, Akt-I-1,2 (1 μM; Fig. 4D), also caused an increase in nuclear Foxo1-GFP. As determined by western blot and a phospho-specific Akt antibody, 80 min of treatment with staurosporine, LY294002, or Akt-I-1,2 each efficiently inhibited phosphorylation of Akt (Fig. 4E). These data indicate that the PI3K/Akt pathway is necessary to block Foxo1 nuclear entry.
We also compared the relative values of n/c ratios obtained for Foxo1-GFP and for endogenous Foxo1 under control conditions to n/c ratios in the presence of phosphorylating agents and phosphorylation inhibitors and determined that the ratios are similar under the same condition, further validating the use of exogenous Foxo1-GFP to monitor Foxo1 movement in living fibers (Fig. 4, F–G).
Inhibition of PP2A via OA decreases nuclear Foxo1.
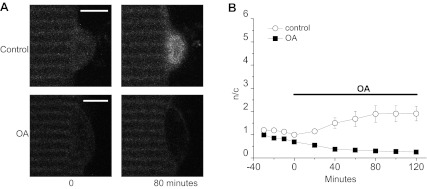
The phosphatase PP2A has been shown to directly dephosphorylate Foxo1 in the FL5.12 cell line expressing doxycycline-inducible wild-type Foxo1 (37). Treatment of cultured muscle fibers with 100 nM OA, a selective inhibitor of the PP2A class of phosphatases at this concentration (33), drastically reduced nuclear Foxo1 and inhibited the increase in nuclear Foxo1 that occurs with time in control fibers (Fig. 5, A and B), implicating PP2A as a Foxo1 phosphatase in skeletal muscle.
Fig. 5.
PP2A inhibitor okadaic acid (OA) reduces Foxo1-GFP nuclear influx. A: representative confocal images of 2 fibers at 0 and 80 min of 100 nM okadaic acid treatment (bottom) or under control conditions (top). Scale bars = 5 μm. B: quantification of n/c ratio of Foxo1-GFP vs. time during 100 nM OA (n = 5) or control (n = 4) treatment demonstrates OA ability to decrease nuclear Foxo1. Data represent means ± SE.
Nuclear-cytoplasmic shuttling of Foxo1.
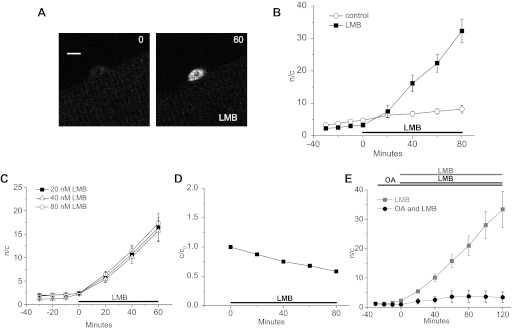
The results presented thus far show changes in net nuclear Foxo1 resulting from differences between nuclear influx and efflux of Foxo1. However, the magnitudes of the simultaneously occurring nuclear efflux and influx underlying the observed net flux was not determined. Treatment with a maximally effective concentration of LMB, an irreversible inhibitor of the export carrier CRM1, should eliminate nuclear export of Foxo1. Under this condition, the time course of the resulting buildup of nuclear Foxo1 would then occur at a rate equal to its rate of unidirectional flux out of the cytoplasm and into the nucleus. Therefore, using LMB we can calculate the rate of nuclear influx of Foxo1 under various conditions. Under resting conditions, nuclear influx of Foxo1-GFP occurs at a fast pace in LMB. During 80 min of exposure to 40 nM LMB, nuclear Foxo1 increased 10-fold (Fig. 6, A and B). Because there is no substantial buildup of Foxo1 without LMB under the same (control) conditions, we conclude that fast shuttling of Foxo1 into and out of the nucleus occurs in the absence of LMB; 20, 40, and 80 nM LMB induced the same rate of nuclear buildup of Foxo1, indicating that CRM-1 is maximally inhibited by 40 nM LMB under these conditions (Fig. 6C).
Fig. 6.
Leptomycin B (LMB) eliminates nuclear efflux of Foxo1 and allows direct measurement of the unidirectional rate of nuclear influx of Foxo1. A: representative confocal images of a single muscle fiber treated with 40 nM LMB for the time indicated. Nuclear Foxo1 increases with LMB treatment. Due to saturation, laser intensity was decreased for the second image. The n/c ratio is used to measure nuclear Foxo1 in an expression independent manner and to normalize for the change in laser intensity. Scale bar = 5 μm. B: quantification of the increase in nuclear Foxo1 in control (n = 5) and LMB-treated (n = 5) fibers. C: time course of the effects of 20 (n = 7), 40 (n = 5), and 80 (n = 7) nM LMB treatment on Foxo1 n/c. D: as the nuclear concentration of Foxo1 increases with LMB treatment the cytoplasmic concentration decreases (n = 12). E: addition of 100 nM OA in tandem with 40 nM LMB (n = 3) prevents the buildup of nuclear Foxo1 compared with that seen in LMB-treated fibers (n = 5). Data represent means ± SE.
In contrast to our studies without LMB, where Foxo1-GFP is not strongly accumulated in the muscle fiber nuclei, during LMB treatment Foxo1-GFP can become highly concentrated in the nuclei and the cytoplasmic Foxo1-GFP fluorescence visibly decreases. Over 80 min of LMB treatment, the cytoplasmic fluorescence is reduced by about half (Fig. 6D), whereas in control conditions without LMB treatment, the cytoplasmic fluorescence does not change noticeably (data not shown).
By conservation of mass,
| (1) |
where Δc and Δn are the coreresponding changes in c and n when a given amount of Foxo1-GFP moves between the cytoplasm and the nuclei of a muscle fiber and Vc and Vn are the cytoplasmic and nuclear volumes. The mean value of −Δc/Δn obtained from 11 fibers exposed to LMB for 80 min was 0.05 ± 0.001, which equals the mean value of Vn/Vc in these muscle fibers.
Role of cytoplasmic phosphatase.
The PP2A inhibitor OA induces a decrease in nuclear Foxo1 in the absence of LMB (Fig. 5, A and B). To determine the manner in which this nuclear decrease occurs, fibers were or were not pretreated with OA for 30 min, followed by the addition of LMB. Using LMB to determine the rate of nuclear import of Foxo1, we established that OA effectively inhibits nuclear influx of Foxo1 (Fig. 6E). During 60 min of OA and LMB treatment, the nuclear concentration of Foxo1 increased linearly with a slope of 0.04 n/c per min compared with control fibers treated with only LMB, where the slope was 0.19 n/c per min (Fig. 6E). After 60 min of OA and LMB treatment, nuclear Foxo1 became constant. In contrast, in fibers treated with LMB alone, n/c ratio continued to increase linearly during 60 min of LMB exposure, and showed a >10-fold increase over that of the nuclear concentration at 0 min, the point of addition of LMB (Fig. 6E). Based on these data, we conclude that Foxo1 nuclear import is induced by cytoplasmic dephosphorylation of Foxo1 via an OA-sensitive phosphatase, presumably PP2A.
Near balance between relatively large nuclear influx and nuclear efflux under resting conditions.
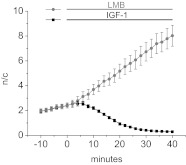
In previous studies from our own and other laboratories (21, 29), the observation of a rapid net nuclear influx during application of the CRM1-dependent nuclear efflux blocker LMB has been taken as evidence for the presence of relatively large, but near balanced nuclear influx and efflux before the addition of LMB. However, we are unaware of any previous reports of direct comparison of unidirectional influx and efflux rates under conditions of such nuclear-cytoplasmic shuttling of any molecule in any cell type. We therefore carried out experiments to directly address this point using our muscle fiber culture system. To improve time resolution, in these studies we used more frequent image acquisition, now at 2-min intervals, compared with the preceding results that were based on images acquired at 10 or 20 min intervals. We first monitored fibers under control conditions and then added either a maximally blocking concentration of LMB (Fig. 7, grey line) or a highly effective concentration of IGF-1 (Fig. 7, black line). The increase in nuclear Foxo1-GFP due to LMB addition begins with little delay, as expected for a direct, diffusion-limited pharmacological block of the nuclear export system by LMB. Subsequently, the nuclear accumulation of Foxo1 continues at a constant rate for the 40-min recording interval after LMB addition. In contrast, the decrease in nuclear Foxo1-GFP on addition of IGF-1 begins with a clear time lag. This is as expected for the occurrence of a multistep signaling cascade initiated by IGF-1 but accomplished by the sequential activation of IGF receptor, PI3K, and Akt, leading to the eventual phosphorylation of Foxo1, which eliminates Foxo1 nuclear influx and promotes Foxo1 net nuclear efflux.
Fig. 7.
Nuclear-cytoplasmic shuttling of Foxo1-GFP. After 10 min of imaging at 2-min increments to attain a baseline value of the n/c ratio, fibers were treated with either 100 ng/ml IGF-1 (black line; n = 5 nuclei from 4 fibers) or 40 nM LMB (grey line; n = 5 nuclei from 4 fibers) to prevent nuclear influx or efflux, respectively. Unidirectional rates of nuclear influx (0.16 ± 0.03 n/c per min) and efflux (0.12 ± 0.03 n/c per min) were calculated as the linear slope from 10 to 20 min of treatment.
To obtain a rough measure of the unidirectional flux rates under control conditions in Fig. 7, we used the mean flux rate from 10 to 20 min after reagent addition. This gives a unidirectional influx rate of 0.16 ± 0.03 n/c per min (means ± SE) in 9 nuclei from 8 fibers from 2 experiments as in Fig. 7 in the presence of LMB, and a unidirectional efflux rate of 0.12 ± 0.03 n/c per min in 10 nuclei from 8 fibers in 2 other experiments in the presence of IGF-1. With the assumption that these unidirectional flux rates to apply to the control period before drug addition, the influx rate slightly exceeds the efflux rate and would predict a relatively slow but systematic net influx of Foxo1 at a rate of 0.04 n/c per min under control conditions before drug addition in Fig. 7. This predicted value of net nuclear influx agrees very closely with the experimentally measured slopes of 0.04 ± 0.01 and 0.03 ± 0.02 n/c per min obtained before addition of LMB or IGF-1, respectively.
Nuclear cytoplasmic shuttling is much slower for Foxo3A than for Foxo1.
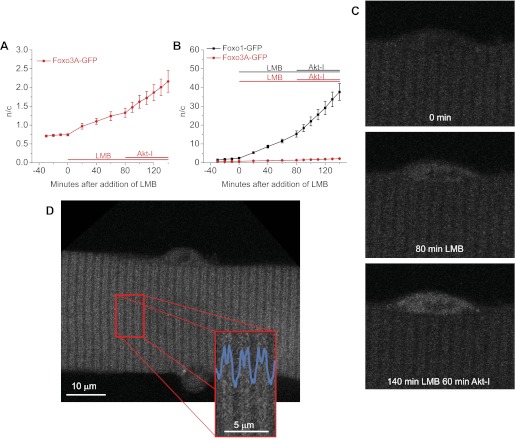
In a few experiments, we examined the nuclear-cytoplasmic distribution and shuttling of Foxo3A compared with Foxo1. Under control conditions, the addition of LMB causes the nuclear fluorescence due to Foxo3A to continuously increase with time, indicating a constant rate of Foxo3A-GFP unidirectional nuclear influx. The rate of nuclear influx of Foxo3A in LMB then approximately doubled with the inhibition of Akt (Fig. 8A). However, the rates of influx of Foxo3A in LMB are only ∼1/20 of those of Foxo1, as seen by comparison of fibers from the same mouse infected with adenovirus for either Foxo1 or Foxo3A (Fig. 8B). Note that the vertical scale in Fig. 8B is compressed by a factor of 20 compared with that in Fig. 8A and that the same data points for Foxo3A-GFP are presented in Fig. 8, A and B. The mean values of the rate of increase of Foxo3A-GFP n/c were 0.0011 ± 0.0005 n/c per min in control, 0.0073 ± 0.0013 n/c per min in LMB, and 0.014 ± 0.003 n/c per min in LMB plus Akt-I-1,2; and for Foxo1-GFP were 0.029 ± 0.004 n/c per min in control, 0.16 ± 0.018 n/c per min in LMB, and 0.38 ± 0.057 n/c per min in LMB plus Akt-I-1,2. Representative images of a single fiber in Fig. 8C demonstrate the increase in nuclear Foxo3A during 80 min of LMB treatment and during an additional 60 min of Akt inhibition with continued LMB treatment.
Fig. 8.
Foxo3A cycling and phosphorylation by Akt. A and B: Foxo3A-GFP (red line; n = 5 nuclei from 4 fibers) enters the nucleus at a slower rate than does Foxo1-GFP (black line in B; n = 4), as determined using LMB to inhibit nuclear efflux. Inhibition of Akt via Akt-I-1,2 (Akt-I) induced an increase in the rate of nuclear influx of both Foxo1-GFP and Foxo3A-GFP. The difference between the relative increases of Foxo1-GFP and Foxo3A-GFP can be seen in B in which the scale is 20-fold that of the same experiment in A. C: representative confocal images of a single muscle fiber expressing Foxo3A-GPF treated with 40 nM LMB with or without Akt-I for the times indicated. Nuclear Foxo3A-GFP increases with LMB treatment revealing nuclear import. With Akt inhibition nuclear import increases indicating cytoplasmic retention to be Akt-dependent. D: unlike the Z-line distribution of Foxo1-GFP (see Fig. 1), Foxo3A-GFP appears as a doublet.
The basis for the much slower nuclear influx exhibited by Foxo3A compared with Foxo1 will be considered in the discussion.
We also noted that the sarcomeric pattern of distribution of Foxo3A was different from that of Foxo1. Whereas Foxo1-GFP was localized in a single sharp line per sarcomere at the sarcomeric Z-lines (Fig. 1B), Foxo3A-GFP is present in a doublet band per sarcomere on either side of the Z-line (Fig. 8D).
Rate of unidirectional nuclear influx.
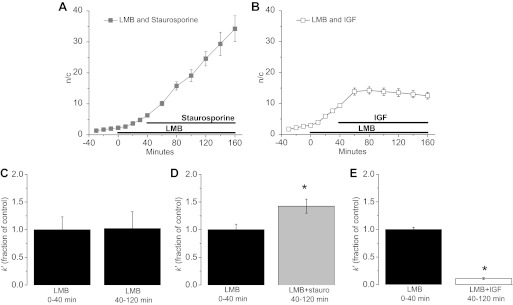
To determine the effect of kinase activity on the unidirectional rate constants for movement of cytoplasmic Foxo1-GFP out of the cytoplasm and into the nucleus, after a control period of 30 min we pretreated fibers with LMB for 40 min and then added staurosporine or IGF-1 for an additional 120 min (Fig. 9, A and B). The average rate of increase of nuclear fluorescence in LMB alone was 0.14 n/c per min and the average rate in LMB with staurosporine was 0.31 n/c per min (Fig. 9A), indicating that in the absence of staurosporine, kinase activity reduced the rate of nuclear influx of Foxo1, presumably by maintaining the concentration of cytoplasmic dephosphorylated Foxo1 at slightly less than half of the concentration attained in the presence of staurosporine. Note that specific inhibition of Akt by Akt-I-1,2 caused a similar (∼2-fold) increase in the rate of Foxo1-GFP nuclear influx in the presence of LMB, confirming that Akt is the predominant kinase phosphorylating cytoplasmic Foxo1 in muscle fibers. As anticipated, IGF-1 treatment completely ablated nuclear influx (Fig. 9B).
Fig. 9.
Nuclear influx rate constant with staurosporine and IGF-1. Quantification of the slope measured in n/c ratio per min in fibers treated with LMB followed by staurosporine (A; n = 5) or IGF-1 (B; n = 5) treatment is the rate of nuclear influx induced by these individual treatments. C: apparent rate constant of nuclear influx k’ of the first 40 min compared with the last 80 min of the 120-min time course of LMB treatment is the same during LMB treatment alone (n = 4). D: k’ increases significantly during 80 min of staurosporine treatment from k’ during LMB treatment alone (n = 10; *P < 0.05). E: IGF-1 causes a significant decrease in k’ compared with k’ during the control period with LMB alone (n = 11; * P < 0.05). Data represent means ± SE.
First order rate constants for unidirectional cytoplasmic to nuclear fluxes.
We next calculate the apparent first order rate constant k′ for unidirectional flux of Foxo from the cytoplasm to the nuclei for the experiment in Fig. 9. With the use of Eq. A4, k′ can be evaluated from successive images acquired at times t1 and t2 using the equation:
| (2) |
where ni is the mean pixel fluorescence of the nucleus at a specified time ti and ci is the mean cytoplasmic pixel fluorescence at the same specified time. The value used for Vn/Vc was the mean value of −Δc/Δn of 0.049 (±0.0079) obtained from 11 fibers during Foxo1-GFP nuclear influx over time periods sufficient to give relatively large values of Δc (see above). To assess the consistency of k′ during fiber treatment with LMB, we calculated k′ for data values collected at t1 of 0, 20, 40, 60, 80, and 100 min after LMB addition using the corresponding respective values collected at t2 of 20, 40, 60, 80, 100, and 120 min after LMB addition. This yielded six consistent k′ values, demonstrating the uniformity of k′ under these conditions (data not shown). Next, we calculated the average k′ for the first 40 min and last 80 min of each group of experiments by averaging the individual k′ calculated per fiber. We then compared these two data sets within each of the three sets of experimental conditions by normalizing all k′ values to the mean k′ of the control period (0–40 min), thus calculating the k′ of the experimental condition (40–120 min) as a fraction of k′ during the control period. The mean k′ in the first 40 min in LMB treatment alone was then compared with the mean k′ for the next 80 min of treatment with LMB and a phosphorylation modulator as a fraction of the LMB alone control period (Fig. 9, C–E). We saw a modest but significant increase in k′ with staurosporine treatment (Fig. 9D) and a more drastic and significant decrease in k′ with IGF-1 (Fig. 9E) whereas fibers treated with LMB alone for the same time showed no difference in their k′ values in the first 40 min compared with the last 80 min (Fig. 9C).
The ratio of the apparent rate constant for nuclear influx during treatment with LMB plus a phosphorylating or a dephosphorylating agent to the rate constant for nuclear influx with LMB alone should be proportional to the fraction of control dephosphorylated Foxo1 that is present in the cytoplasm in the presence of the additional agent, assuming that only unbound dephosphorylated cytoplasmic Foxo1 is imported into the nucleus, that the percent of cytoplasmic dephosphorylated Foxo1-GFP that is not bound to cytoplasmic sites is the same in the two conditions, and that the nuclear transport system itself is not altered by the experimental manipulation. During staurosporine treatment the fraction is 1.4, indicating that general inhibition of phosphorylation by staurosporine caused a 40% increase in the cytosolic concentration of dephosphorylated Foxo1. In sharp contrast, during IGF-1 treatment the fraction is 0.11, indicating a decrease of cytosolic dephosphorylated Foxo1 to 11% of its control level before IGF-1 treatment or a phosphorylation of 89% of the control dephosphorylated Foxo1 on the application of IGF-1. These values, obtained from the kinetic analysis, provide a quantitative measure of the extent to which the inhibition of kinase activity by staurosporine promotes the dephosphorylation of cytoplasmic Foxo1 and IGF-1 promotes its phosphorylation (Fig. 9, C–E).
Akt is necessary for IGF-1-induced cytoplasmic retention of Foxo1.
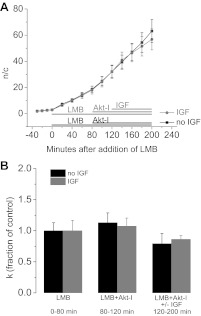
To determine the role of Akt in the reduction of nuclear Foxo1 due to IGF-1 treatment, we determined the rate of nuclear influx during inhibition of Akt in the presence or absence of IGF-1. This experiment had four distinct segments (Fig. 10A). First, a control period of 30 min with no added agents. Second, an 80-min treatment (“0 to 80 min”) with LMB. Third, 40-min (“80 to 120 min”) exposure to 1 μM Akt inhibitor Akt-I-1,2 in the continued presence of LMB. Up to this point all fibers were exposed to the same reagents. Then, in the fourth segment, fibers were treated with or without IGF-1 for 80 min (“120 to 200 min”). Note that media were not changed during the entirety of this experiment and therefore no reagents were removed. The results showed that the rates of nuclear influx with and without IGF-1 in the presence of Akt inhibitor were the same (Fig. 10A), indicating that the entire IGF-1 effect is mediated by Akt and that Akt activity is necessary for IGF-1-induced reduction of nuclear Foxo1. Furthermore, the calculation of the apparent rate constants of cytoplasmic efflux of Foxo1-GFP (k'), as described above, for the last three segments at 0–80, 80–120, and 120–200 min showed IGF-1 treatment to be ineffective in changing the rate constant of cytoplasmic efflux when Akt was inhibited (Fig. 10B). As expected for two samples subjected to the same treatment, the rate constants of nuclear influx from both samples from 0–80 min were not significantly different nor were the rate constants of nuclear influx different for both samples from 80–120 min. Of note, the last time segment did not have significantly different k, regardless of the presence or absence of 100 ng/ml IGF-1, revealing Akt inhibition to be sufficient to fully suppress the IGF-1 effect of reducing nuclear influx of Foxo1.
Fig. 10.
Akt modulation of IGF-1. A: quantification of the slope measured in n/c ratio per min in fibers treated with LMB followed by Akt-I-1,2 (Akt-I; n = 12) or Akt-I-1,2 and IGF-1 (n = 13) shows inhibition of Akt to prevent the decrease in the rate of nuclear influx normally induced by IGF-1. B: comparison of the nuclear influx rate constants at 0–80 min, 80–120 min, and 120–200 min of LMB treatment and additional treatment of Akt-I-1,2 and IGF-1 as labeled. The fibers represented in black were treated with LMB with Akt-I-1,2 (n = 12), and those in grey were treated with LMB, Akt-I-1,2, and IGF-1 (n = 13). Data represent means ± SE.
DISCUSSION
Foxo transcription factors play key roles in cell proliferation, cell cycle, and cellular survival and are expressed in all cells of the human body (1, 13, 23). In skeletal muscle, Foxo proteins play a key role in determining muscle size through the regulation of transcription of atrogene products such as E3 ubiqutin ligases Atrogin-1/MAFbx and MuRF-1 (5, 19, 26).
Here, we utilize confocal imaging of fluorescence from exogenously expressed Foxo-GFP to monitor kinetics of nuclear-cytoplasmic movements of Foxo proteins in living muscle fibers. Comparison of antibody-stained endogenous Foxo1 and exogenously expressed Foxo1-GFP in terms of sarcomeric localization (Fig. 1), nuclear-cytoplasmic distribution (Fig. 2A), and response to treatment (Fig. 4, E and F) validate this system of adenovirally expressed Foxo-GFP as a reliable indicator of endogenous Foxo and as a useful tool in measuring rates of nuclear-cytoplasmic translocation in studies involving fluorescently tagged Foxo.
Our results with Foxo1-GFP show that IGF-1 treatment alone is sufficient to prevent nuclear targeting of Foxo1 in live adult skeletal muscle fibers and demonstrate the necessity of the kinases PI3K and Akt in cytoplasmic retention of Foxo1 (Figs. 3, A and C, and 4, A, C, and D). Furthermore, we identify Akt's functional activity to be necessary to the decrease in nuclear Foxo1 that occurs in response to IGF-1 treatment (Fig. 10). Kinases such as SGK, CK1, and DYRK1A have been shown to be Foxo kinases (9, 25, 36) but do not seem to be sufficient for modulating the Foxo1 nuclear-cytoplasmic movements monitored in cultured adult muscle fibers.
PP2A directly dephosphorylates Foxo1 in NIH T3T cells (37). The impressive decrease in nuclear Foxo1 in response to inhibition of PP2A via OA (Fig. 5) demonstrates PP2A's functional role in Foxo1 dephosphorylation in skeletal muscle, as well. Studies of unidirectional nuclear influx with and without OA treatment identify PP2A inhibition to occur in the cytoplasm (Fig. 6E). This does not limit PP2A's role to the cytoplasm but does reveal the importance of its cytoplasmic activity, as well as its role in nuclear-cytoplasmic cycling of Foxo1.
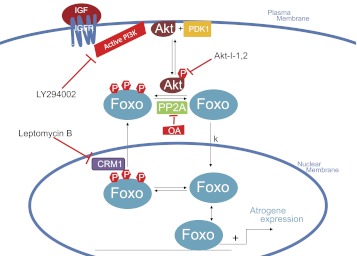
A kinetic reaction scheme representing the nuclear-cytoplasmic movements of Foxo proteins is presented in Fig. 11, together with the signaling systems and inhibitors that we have examined as modifiers of Foxo movements in our muscle fiber studies. Other physiological modulators of Foxo movements, such as Foxo phosphorylation at other sites (25, 36) or acetylation (8) are not shown in Fig. 11 and can be thought of as providing a possible constant background level of modulation of the Foxo fluxes observed here. Dephosphorylated cytoplasmic Foxo is unidirectionally translocated out of the cytoplasm by the nuclear localization signal and Ran GTPase driven nuclear import system, but phosphorylated Foxo is not transported by this system (6). Note that the rate constant k for unidirectional first order flux of dephosphorylated Foxo out of the cytoplasm and into the nucleus in Fig. 11 is the same as the k in Eq. A1. In contrast to the nuclear import system, which carries only dephosphorylated Foxo, phosphorylated but not dephosphorylated Foxo is carried by the CRM1-dependent nuclear export system, with export facilitated by the chaperone protein 14-3-3 (7).
Fig. 11.
Schematic presentation of regulators of subcellular localization of Foxo. Nuclear-cytoplasmic trafficking is regulated by phosphorylation of Foxo by active Akt. Binding of IGF to its membrane bound receptor IGF receptor (IGFR) activates the kinase PI3K, indirectly causing the phosphorylation of Akt, which directly phosphorylates Foxo. Inhibition of PI3K by LY294002 or inhibition of Akt by Akt-I-1,2 prevents phosphorylation of Foxo and thus induces nuclear import of Foxo. CRM1 facilitates of nuclear export of Foxo1 and inhibition of chromosome region maintenance 1 (CRM1) by LMB prevents nuclear export of Foxo.
The nuclear export of Foxo can be inhibited by LMB (Fig. 11), which binds to and thus removes the availability of CRM1 for nuclear export. In the presence of a fully blocking concentration of LMB, any Foxo that enters the nucleus is unable to leave and becomes trapped in the nucleus. Inhibition of nuclear export via LMB thus provides a powerful tool for measuring the rate of unidirectional nuclear influx and for calculating its rate constant of cytoplasmic efflux. The change in the rate constant for unidirectional efflux out of the cytoplasm due to treatment with phosphorylation modulators demonstrates the importance of cytoplasmic phosphorylation/dephosphorylation of Foxo1 in regulation of its rate of cytoplasmic efflux (Figs. 6, 9, and 10). Furthermore, the increase in the rate of nuclear influx that resulted from staurosporine addition in the presence of LMB (Fig. 9A) indicates that the nuclear import machinery is not saturated at the level of expression of Foxo1-GFP employed under our conditions of infection by adFoxo1-GFP. Based on the important information obtained here and elsewhere with the nuclear export inhibitor LMB, identification of a comparable specific inhibitor of nuclear import would further open up the field to understanding the kinases and phosphatases that regulate Foxo1 nuclear export.
It should be noted that the same unidirectional flux of Foxo from muscle fiber nuclei can be considered as either a unidirectional efflux out of the cytoplasm or as a unidirectional influx into the nuclei. In practical terms of ease of experimental measurement, it is more convenient to monitor the rate of change of Foxo-GFP fluorescence in the nuclei than in the cytoplasm. The total volume of the nuclei is much smaller than that of the cytoplasm, so the corresponding change in mean pixel fluorescence for a given flux of Foxo-GFP between cytoplasm and nuclei is much larger in the nuclei than in the cytoplasm. By conservation of mass, the ratio of changes of nuclear to cytoplasmic mean pixel fluorescence for a given movement of Foxo-GFP between nuclei and cytoplasm is equal to the ratio of cytoplasmic to nuclear volume in the muscle fibers. However, in terms of mechanistic interpretation of the nuclear import system, it is more appropriate to consider cytoplasmic rather than nuclear concentration change and the rate of efflux of Foxo out of the cytoplasm. This is because the unidirectional flux of Foxo from cytoplasm to nuclei is determined by the cytoplasmic concentration of dephosphorylated unbound Foxo and is independent of the nuclear concentration, as indicated in the kinetic scheme in Fig. 11 and by Eq. A1.
The unidirectional rate constant of cytoplasmic efflux of Foxo1 is relatively high compared with that of other transcription factors that our laboratory has studied. Based on the nuclear influx measured in the presence of LMB, the apparent first order rate constant k′ for unidirectional flux of Foxo1-GFP out of the cytoplasm and into the nucleus was 0.355 ± 0.035 per hour under resting conditions (data from Fig. 10). In contrast, under resting conditions, the transcription factor NFATc1 leaves the cytoplasm and enters the nucleus at a much slower rate. As determined in LMB, the unidirectional flux of NFATc1 from cytoplasm to nucleus occurs with an apparent first order rate constant of 0.074 ± 0.005 per hour [based on data used to make Figs. 2C and 6C in Shen et al. (30), assuming Vn/Vc is the same for Foxo1 and NFATc1]. Foxo3A also enters the nucleus much more slowly than Foxo1. The unidirectional first order apparent rate constant for movement of Foxo3A out of the cytoplasm and into the nucleus is 0.023 ± 0.004 per hour in the presence of LMB (calculated from the data for nuclei in fibers in Fig. 8). One possible explanation for the lower unidirectional apparent rate constants for movement of NFATc1 and Foxo3A out of the cytoplasm compared with the rate constant for Foxo1 could be their less effective transport by the nuclear import system, i.e., the actual rate constant k, would be considerably lower for Foxo3A or NFATc1 than that for Foxo1, but this may be unlikely for the similar molecules Foxo1 and Foxo3A. Alternatively, the fractional dephosphorylation of NFATc1 or Foxo3A in the cytoplasm might be much lower than that of Foxo1. A much lower relative degree of dephosphorylation of Foxo3A than Foxo1 in muscle fibers would be consistent with the observation that nerve growth factor activated Foxo phosphorylation in PC12 cells occurs at considerably lower nerve growth factor levels for Foxo3 than for Foxo1(35). Finally, the fraction of unbound dephosphorylated Foxo1 in the cytoplasm could be considerably greater than the fraction of unbound dephosphorylated Foxo3A or NFATc1 in the cytoplasm. Intriguingly, the subsarcomeric distribution pattern for Foxo3A is different from that of Foxo1, possibly indicative of a difference in binding and fraction bound. The presence of two Foxo isoforms, Foxo1 and 3A, having ∼20-fold different nuclear-cytoplasmic shuttling rates under control conditions, but presumably modulating the expression of the same group of genes, raises interesting questions regarding mechanism, regulation, and function that merit future investigation of Foxo isoforms.
APPENDIX
Apparent first order rate constant for unidirectional flux of Foxo from cytoplasm to nuclei.
Assuming that the rate of nuclear efflux is 0 with LMB treatment, that the movement of Foxo-GFP out of the cytoplasm is a first order process, and that only depohsphorylated and unbound Foxo-GFP can enter the nucleus, the rate of change of cytoplasmic Foxo-GFP fluorescence due to movement of Foxo-GFP out of the cytoplasm is given by:
| (A1) |
where c is the mean pixel fluorescence in the cytoplasm, t is time, k is the first order rate constant for movement of dephosphorylated and unbound Foxo-GFP from the cytoplasm to the nucleus, and fc is the fraction of total cytoplasmic Foxo-GFP that is both dephosphorylated and unbound. Defining the apparent rate constant k′ as k fc, k′ is given by
| (A2) |
Rearranging the equation for conservation of mass (Eq. 1) and taking the time derivative gives
| (A3) |
Substitution of Eq. A3 into Eq. A2 gives the equation
| (A4) |
for the apparent first order rate constant for Foxo-GFP movement out of the cytoplasm and into the nuclei.
GRANTS
This work was supported by National Institute of Arthritis and Musculoskeletal and Skin Diseases Grant R01-AR056477 from National Institutes of Health (NIH). T. N. Schachter was partially supported by institutional NIH Training Grants T32-AR-007592 and T32-HL-072751. The content is solely the responsibility of the authors and does not necessarily represent the official views of the National Institutes of Health.
DISCLOSURES
No conflicts of interest, financial or otherwise, are declared by the author(s).
AUTHOR CONTRIBUTIONS
Author contributions: T.N.S., T.S., Y.L., and M.F.S. conception and design of research; T.N.S. performed experiments; T.N.S. analyzed data; T.N.S., T.S., and M.F.S. interpreted results of experiments; T.N.S. prepared the figures; T.N.S. drafted manuscript; T.N.S., T.S., and M.F.S. edited and revised manuscript; T.N.S., T.S., and M.F.S. approved final version of manuscript.
ACKNOWLEDGMENTS
We thank Dr. Joseph Hill (University of Texas Southwestern Medical Center) for providing the recombinant adenovirus of Foxo1-GFP.
REFERENCES
- 1. Arden KC, Biggs WH., III Regulation of the FoxO family of transcription factors by phosphatidylinositol-3 kinase-activated signaling. Arch Biochem Biophys 403: 292–298, 2002 [DOI] [PubMed] [Google Scholar]
- 2. Bain J, Plater L, Elliott M, Shpiro N, Hastie CJ, McLauchlan H, Klevernic I, Arthur JS, Alessi DR, Cohen P. The selectivity of protein kinase inhibitors: a further update. Biochem J 408: 297–315, 2007 [DOI] [PMC free article] [PubMed] [Google Scholar]
- 3. Barnett SF, Defeo-Jones D, Fu S, Hancock PJ, Haskell KM, Jones RE, Kahana JA, Kral AM, Leander K, Lee LL, Malinowski J, McAvoy EM, Nahas DD, Robinson RG, Huber HE. Identification and characterization of pleckstrin-homology-domain-dependent and isoenzyme-specific Akt inhibitors. Biochem J 385: 399–408, 2005 [DOI] [PMC free article] [PubMed] [Google Scholar]
- 4. Biggs WH, III, Cavenee WK, Arden KC. Identification and characterization of members of the FKHR (FOX O) subclass of winged-helix transcription factors in the mouse. Mamm Genome 12: 416–425, 2001 [DOI] [PubMed] [Google Scholar]
- 5. Bodine SC, Latres E, Baumhueter S, Lai VK, Nunez L, Clarke BA, Poueymirou WT, Panaro FJ, Na E, Dharmarajan K, Pan ZQ, Valenzuela DM, DeChiara TM, Stitt TN, Yancopoulos GD, Glass DJ. Identification of ubiquitin ligases required for skeletal muscle atrophy. Science 294: 1704–1708, 2001 [DOI] [PubMed] [Google Scholar]
- 6. Brownawell AM, Kops GJ, Macara IG, Burgering BM. Inhibition of nuclear import by protein kinase B (Akt) regulates the subcellular distribution and activity of the forkhead transcription factor AFX. Mol Cell Biol 21: 3534–3546, 2001 [DOI] [PMC free article] [PubMed] [Google Scholar]
- 7. Brunet A, Bonni A, Zigmond MJ, Lin MZ, Juo P, Hu LS, Anderson MJ, Arden KC, Blenis J, Greenberg ME. Akt promotes cell survival by phosphorylating and inhibiting a Forkhead transcription factor. Cell 96: 857–868, 1999 [DOI] [PubMed] [Google Scholar]
- 8. Brunet A, Sweeney LB, Sturgill JF, Chua KF, Greer PL, Lin Y, Tran H, Ross SE, Mostoslavsky R, Cohen HY, Hu LS, Cheng HL, Jedrychowski MP, Gygi SP, Sinclair DA, Alt FW, Greenberg ME. Stress-dependent regulation of FOXO transcription factors by the SIRT1 deacetylase. Science 303: 2011–2015, 2004 [DOI] [PubMed] [Google Scholar]
- 9. Burgering BM, Medema RH. Decisions on life and death: FOXO Forkhead transcription factors are in command when PKB/Akt is off duty. J Leukoc Biol 73: 689–701, 2003 [DOI] [PubMed] [Google Scholar]
- 10. Cantley LC. The phosphoinositide 3-kinase pathway. Science 296: 5573: 1655–1657, 2002 [DOI] [PubMed] [Google Scholar]
- 11. Coolican SA, Samuel DS, Ewton DZ, McWade FJ, Florini JR. The mitogenic and myogenic actions of insulin-like growth factors utilize distinct signaling pathways. J Biol Chem 272: 6653–6662, 1997 [DOI] [PubMed] [Google Scholar]
- 12. Downward J. Mechanisms and consequences of activation of protein kinase B/Akt. Curr Opin Cell Biol 10: 262–267, 1998 [DOI] [PubMed] [Google Scholar]
- 13. Hedrick SM. The cunning little vixen: Foxo and the cycle of life and death. Nat Immunol 10: 1057–1063, 2009 [DOI] [PMC free article] [PubMed] [Google Scholar]
- 14. Hosaka T, Biggs WH, III, Tieu D, Boyer AD, Varki NM, Cavenee WK, Arden KC. Disruption of forkhead transcription factor (FOXO) family members in mice reveals their functional diversification. Proc Natl Acad Sci USA 101: 2975–2980, 2004 [DOI] [PMC free article] [PubMed] [Google Scholar]
- 15. Hribal ML, Nakae J, Kitamura T, Shutter JR, Accili D. Regulation of insulin-like growth factor-dependent myoblast differentiation by Foxo forkhead transcription factors. J Cell Biol 162: 535–541, 2003 [DOI] [PMC free article] [PubMed] [Google Scholar]
- 16. Jacobs FM, van der Heide LP, Wijchers PJ, Burbach JP, Hoekman MF, Smidt MP. FoxO6, a novel member of the FoxO class of transcription factors with distinct shuttling dynamics. J Biol Chem 278: 35959–35967, 2003 [DOI] [PubMed] [Google Scholar]
- 17. Kamei Y, Miura S, Suzuki M, Kai Y, Mizukami J, Taniguchi T, Mochida K, Hata T, Matsuda J, Aburatani H, Nishino I, Ezaki O. Skeletal muscle FOXO1 (FKHR) transgenic mice have less skeletal muscle mass, down-regulated Type I (slow twitch/red muscle) fiber genes, and impaired glycemic control. J Biol Chem 279: 41114–41123, 2004 [DOI] [PubMed] [Google Scholar]
- 18. Liu Y, Contreras M, Shen T, Randall WR, Schneider MF. Alpha-adrenergic signalling activates protein kinase D and causes nuclear efflux of the transcriptional repressor HDAC5 in cultured adult mouse soleus skeletal muscle fibres. J Physiol 587: 1101–1115, 2009 [DOI] [PMC free article] [PubMed] [Google Scholar]
- 19. McLoughlin TJ, Smith SM, DeLong AD, Wang H, Unterman TG, Esser KA. FoxO1 induces apoptosis in skeletal myotubes in a DNA-binding-dependent manner. Am J Physiol Cell Physiol 297: C548–C555, 2009 [DOI] [PMC free article] [PubMed] [Google Scholar]
- 20. Ni YG, Berenji K, Wang N, Oh M, Sachan N, Dey A, Cheng J, Lu G, Morris DJ, Castrillon DH, Gerard RD, Rothermel BA, Hill JA. Foxo transcription factors blunt cardiac hypertrophy by inhibiting calcineurin signaling. Circulation 114: 1159–1168, 2006 [DOI] [PMC free article] [PubMed] [Google Scholar]
- 21. Pache JC, Burton DW, Deftos LJ, Hastings RH. A carboxyl leucine-rich region of parathyroid hormone-related protein is critical for nuclear export. Endocrinology 147: 990–998, 2006 [DOI] [PubMed] [Google Scholar]
- 22. Perrone CE, Fenwick-Smith D, Vandenburgh HH. Collagen and stretch modulate autocrine secretion of insulin-like growth factor-1 and insulin-like growth factor binding proteins from differentiated skeletal muscle cells. J Biol Chem 270: 2099–2106, 1995 [DOI] [PubMed] [Google Scholar]
- 23. Puig O, Tjian R. Nutrient availability and growth: regulation of insulin signaling by dFOXO/FOXO1. Cell Cycle 5: 503–505, 2006 [DOI] [PubMed] [Google Scholar]
- 24. Rena G, Guo S, Cichy SC, Unterman TG, Cohen P. Phosphorylation of the transcription factor forkhead family member FKHR by protein kinase B. J Biol Chem 274: 17179–17183, 1999 [DOI] [PubMed] [Google Scholar]
- 25. Rena G, Woods YL, Prescott AR, Peggie M, Unterman TG, Williams MR, Cohen P. Two novel phosphorylation sites on FKHR that are critical for its nuclear exclusion. EMBO J 21: 2263–2271, 2002 [DOI] [PMC free article] [PubMed] [Google Scholar]
- 26. Sandri M, Sandri C, Gilbert A, Skurk C, Calabria E, Picard A, Walsh K, Schiaffino S, Lecker SH, Goldberg AL. Foxo transcription factors induce the atrophy-related ubiquitin ligase atrogin-1 and cause skeletal muscle atrophy. Cell 117: 399–412, 2004 [DOI] [PMC free article] [PubMed] [Google Scholar]
- 27. Schakman O, Gilson H, Thissen JP. Mechanisms of glucocorticoid-induced myopathy. J Endocrinol 197: 1: 1–10, 2008 [DOI] [PubMed] [Google Scholar]
- 28. Shen T, Liu Y, Contreras M, Hernandez-Ochoa EO, Randall WR, Schneider MF. DNA binding sites target nuclear NFATc1 to heterochromatin regions in adult skeletal muscle fibers. Histochem Cell Biol 134: 387–402, 2010 [DOI] [PMC free article] [PubMed] [Google Scholar]
- 29. Shen T, Liu Y, Cseresnyes Z, Hawkins A, Randall WR, Schneider MF. Activity- and calcineurin-independent nuclear shuttling of NFATc1, but not NFATc3, in adult skeletal muscle fibers. Mol Biol Cell 17: 1570–1582, 2006 [DOI] [PMC free article] [PubMed] [Google Scholar]
- 30. Shen T, Liu Y, Randall WR, Schneider MF. Parallel mechanisms for resting nucleo-cytoplasmic shuttling and activity dependent translocation provide dual control of transcriptional regulators HDAC and NFAT in skeletal muscle fiber type plasticity. J Muscle Res Cell Motil 27: 405–411, 2006 [DOI] [PubMed] [Google Scholar]
- 31. Shen T, Liu Y, Schneider MF. Localization and regulation of the N terminal splice variant of PGC-1alpha in adult skeletal muscle fibers. J Biomed Biotechnol 2012: 989263, 2012 [DOI] [PMC free article] [PubMed] [Google Scholar]
- 32. Stitt TN, Drujan D, Clarke BA, Panaro F, Timofeyva Y, Kline WO, Gonzalez M, Yancopoulos GD, Glass DJ. The IGF-1/PI3K/Akt pathway prevents expression of muscle atrophy-induced ubiquitin ligases by inhibiting FOXO transcription factors. Mol Cell 14: 395–403, 2004 [DOI] [PubMed] [Google Scholar]
- 33. Tanuma N, Kim SE, Beullens M, Tsubaki Y, Mitsuhashi S, Nomura M, Kawamura T, Isono K, Koseki H, Sato M, Bollen M, Kikuchi K, Shima H. Nuclear inhibitor of protein phosphatase-1 (NIPP1) directs protein phosphatase-1 (PP1) to dephosphorylate the U2 small nuclear ribonucleoprotein particle (snRNP) component, spliceosome-associated protein 155 (Sap155). J Biol Chem 283: 35805–35814, 2008 [DOI] [PubMed] [Google Scholar]
- 34. Tothova Z, Kollipara R, Huntly BJ, Lee BH, Castrillon DH, Cullen DE, McDowell EP, Lazo-Kallanian S, Williams IR, Sears C, Armstrong SA, Passegue E, DePinho RA, Gilliland DG. FoxOs are critical mediators of hematopoietic stem cell resistance to physiologic oxidative stress. Cell 128: 325–339, 2007 [DOI] [PubMed] [Google Scholar]
- 35. Wen Q, Duan X, Liao R, Little P, Gao G, Jiang H, Lalit S, Quirion R, Zheng W. Characterization of intracellular translocation of Forkhead transcription factor O (FoxO) members induced by NGF in PC12 cells. Neurosci Lett 498: 31–36, 2011 [DOI] [PubMed] [Google Scholar]
- 36. Woods YL, Rena G, Morrice N, Barthel A, Becker W, Guo S, Unterman TG, Cohen P. The kinase DYRK1A phosphorylates the transcription factor FKHR at Ser329 in vitro, a novel in vivo phosphorylation site. Biochem J 355: 597–607, 2001 [DOI] [PMC free article] [PubMed] [Google Scholar]
- 37. Yan L, Lavin VA, Moser LR, Cui Q, Kanies C, Yang E. PP2A regulates the pro-apoptotic activity of FOXO1. J Biol Chem 283: 7411–7420, 2008 [DOI] [PMC free article] [PubMed] [Google Scholar]
- 38. Zhang X, Gan L, Pan H, Guo S, He X, Olson ST, Mesecar A, Adam S, Unterman TG. Phosphorylation of serine 256 suppresses transactivation by FKHR (FOXO1) by multiple mechanisms. Direct and indirect effects on nuclear/cytoplasmic shuttling and DNA binding. J Biol Chem 277: 45276–45284, 2002 [DOI] [PubMed] [Google Scholar]


