Abstract
Murine RAW 264.7 cells were exposed to spheroidal core–shell Fe3O4@Au nanoparticles (SCS-NPs, ca. 34 nm) or nanostars (NSTs, ca. 100 nm) in the presence of bovine serum albumin, with variable effects observed after macrophagocytosis. Uptake of SCS-NPs caused macrophages to adopt a rounded, amoeboid form, accompanied by an increase in surface detachment. In contrast, the uptake of multibranched NSTs did not induce gross changes in macrophage shape or adhesion, but correlated instead with cell enlargement and signatures of macrophage activation such as TNF-α and ROS. MTT assays indicate a low cytotoxic response to either SCS-NPs or NSTs despite differences in macrophage behavior. These observations show that differences in NP size and shape are sufficient to produce diverse responses in macrophages following uptake.
Introduction
The application of nanotechnology to medical imaging and therapy is a driving force behind the development of novel nanomaterials.1 For example, plasmon-resonant Au nanoparticles (NPs) show great potential as contrast agents in optical imaging,2 and as photothermal agents for targeted cell destruction.3, 4 Bioconjugated iron-oxide NPs can provide enhanced contrast in magnetic resonance imaging,5, 6 and core–shell Fe3O4@Au NPs with combined magnetic and plasmonic properties can enhance contrast for deep-tissue or multiscale imaging.7, 8
A key issue in the application of nanomedicine in animals and humans is the rapid clearance of NPs from the bloodstream by immune cells of the reticuloendothelial system (RES). The impact of NP characteristics such as size,9, 10 shape,11 and surface chemistry12, 13 on circulation time following systemic administration has been studied extensively. While considerable progress has been made toward extending the circulation lifetime of coated NPs, biodistribution studies have demonstrated that eventual uptake by RES macrophages remains the ultimate fate for most NPs.14 The number of potential applications in nanomedicine has increased rapidly in recent years,15, 16 with a commensurate emphasis on defining the structure–activity relationships between NPs and immune cells.
Much effort has already been invested in the design of NPs that can avoid phagocytosis by RES macrophages, but recently interest has shifted to the downstream effects of internalized NPs on macrophages. It is widely accepted that surface chemistry plays an important role in the immunomodulatory effects of NPs:17 For example, Au nanorods coated with carboxyl-terminated surfactants promote an inflammatory response in macrophages derived from human monocytes, whereas those coated with amines promote anti-inflammatory activity instead.18 However, such effects are not always simply defined: in one study, the phagocytosis of peptide-conjugated Au NPs has been shown to promote the expression of inflammatory cytokines in general, regardless of peptide length or polarity.19
NP size and shape can also be expected to have an impact on macrophage activity.20 For example, Oh et al. reported that the phagocytosis of hollow SiO2/TiO2 NPs by murine aveolar macrophages was efficient for 50–100 nm particles, and produced mild increases in toxicity, ROS production, and early-stage apoptosis as a function of NP concentration.21 With respect to NP shape, Hutter et al. demonstrated that PEG-coated, multibranched Au NPs (nanostars) stimulated the production of molecular signatures of macrophage activation in microglial cells, relative to Au nanorods or nanospheres.22 These recent studies illustrate the significance and variability of NP effects on the immune system.
In this paper, we describe the differential effects of albumin-stabilized Fe3O4@Au nanoparticles and nanostars on murine macrophages following phagocytosis. Incubation of cultured murine macrophages with spheroidal core–shell nanoparticles (SCS-NPs, ca. 30 nm) in the presence of bovine serum albumin (BSA) resulted in pronounced changes in cell shape and surface detachment, whereas treatments with nanostars (NSTs, ca. 100 nm) did not. On the other hand, the uptake of NSTs resulted in apparent macrophage activation, as indicated by cell expansion and the production of pro-inflammatory molecules such as tumor necrosis factor-alpha (TNF-α) and reactive oxygen species (ROS). The albumin-stabilized NPs and NSTs did not produce significant cytotoxicity at the concentrations used to promote macrophage activation. We also examined the effects of a rotating magnetic field gradient on the behavior of macrophages with internalized magnetically responsive NSTs.
Experimental
Materials and macrophage culture
SCS-NPs (34 nm) and NSTs (100 nm) were prepared by seeded growth using 15.4-nm core–shell Fe3O4@Au NPs (see ESI for details). The murine monocyte macrophage RAW 264.7 cell line was originally obtained from American Type Culture Collection (ATCC) and subsequently cultured in Dulbecco’s modified Eagle’s medium (DMEM, Invitrogen) with 10% fetal bovine serum (FBS, Sigma), 1% L-glutamine (200 mM, Sigma), and 1% penicillin–streptomycin (Invitrogen) at 37 °C in a humidified atmosphere containing 5% CO2.
MTT assay
Cell viability assays were performed in duplicated using mitochondrial reduction of 3-(4,5-dimethylthiazolyl-2)-2,5-diphenyltetrazolium bromide (MTT) to purple formazan.23 2.5×10⁵ cells/mL (100 µL) was incubated in 96-well plates (Falcon, BD Biosciences) for 24 h, covered with an adhesive thin film to prevent evaporation. Cells were treated with variable quantities (5–160 µL) of BSA-coated SCS-NPs (O.D. 7) or NSTs (O.D. 4) were added, then incubated for an another 24 h prior to addition of MTT reagent (5% in PBS, 10 µL), followed 45 min later with DMSO (100 µL). Ratiometric absorption measurements were performed 2 h after DMSO addition with an automated reader at 570/680 nm. NP absorption at 570 nm was subtracted based on data from wells with SCS-NPs (547 µg/O.D./mL) or NSTs (527 µg/O.D./mL). Viability readings of cells incubated with NPs and NSTs were normalized against the largest value.
Confocal microscopy
Cell morphology and ROS production were visualized using an inverted confocal laser scanning microscope (FV-1000, Olympus) equipped with a 60×/1.42 NA oil-immersion objective (PLAPON 60XO). A 488-nm Argon ion laser was used to excite carboxyl-DCF and a 635-nm He-Ne laser was used for confocal reflectance. Emission signals were separated by a 560-nm dichroic mirror and passed through 505–560 and 560–660-nm filters, respectively. RAW 264.7 cells were incubated in chambered coverglass wells (Nalge Nunc) for 24 h at 37 °C, then washed twice with sterile PBS to remove non-adherent cells prior to treatment with BSA-stabilized SCS-NPs (ca. 30 µg/mL) or NSTs (ca. 50 µg/mL). Cell populations were incubated for up to 24 h and monitored at various intervals, then washed 3× with PBS to remove extracellular NPs prior to imaging. Alternatively, after the initial wash with PBS, cells were treated with H2DCFDA (25 µM, Invitrogen) for 30 min at 37 °C, then washed twice with PBS and imaged by fluorescence microscopy.
Flow cytometry
Cells were treated with LPS (100 ng/mL, Invitrogen), SCS-NPs (30 µg/mL), or NSTs (50 µg/mL) for up to 24 h. All cells were washed 3× with sterile PBS prior to trypsinization, then collected in Eppendorf tubes. Cells were either directly incubated with H2DCFDA (25 µM) for 30 min at 37 °C for ROS analysis, or fixed and labeled with PE-conjugated rat monoclonal antibody against TNF-α (eBioscience). In all cases, cells were washed 3× with PBS prior to flow cytometry (FACSCalibur, BD Biosciences); data acquisition and analysis was performed using CellQuest (BD Biosciences). The fluorescence gate for TNF-α or ROS signal (x-axis) was set so that < 0.5% of RAW cells in an unlabeled control sample were counted positive.
Effect of magnetic field gradient on ROS production in treated macrophages
Petri dishes with adherent RAW 264.7 cells with internalized SCS-NPs or NSTs were prepared as described above, then incubated at 37 °C for 2 h over a magnetic stirring plate (|B| ~100 G), with dishes repositioned every 15 min to ensure the uniformity of field exposure. Cells were maintained at 37 °C without the magnetic field gradient, and evaluated for ROS production at 4, 12, and 24 h (Fig. S3).
Results and Discussion
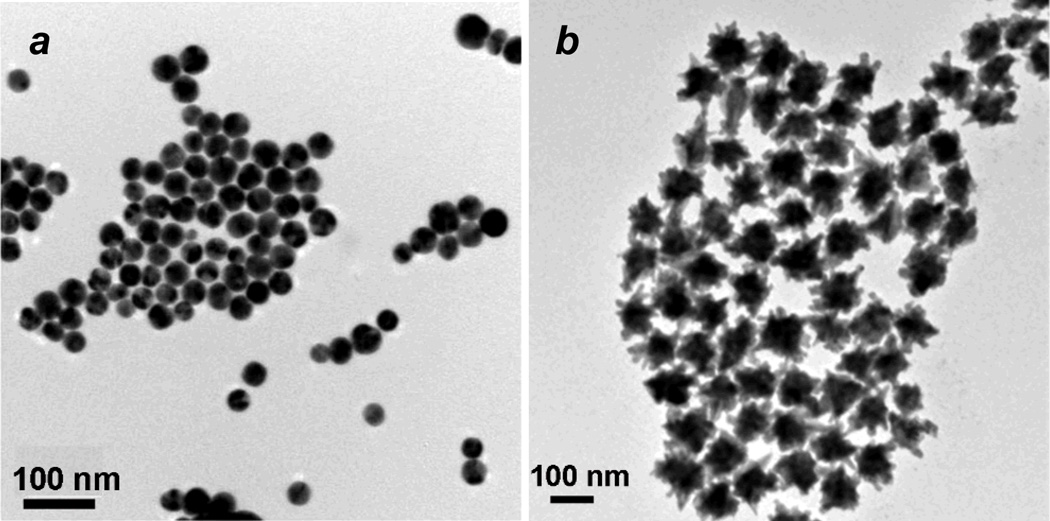
Spheroidal Fe3O4@Au NPs and multibranched NSTs were synthesized by a seeded growth method, similar that previously described (see ESI for full details).8 AuCl3 was found to be most effective for preparing Fe3O4@Au NPs with a narrow size distribution centered at 15.4 nm. These were used as seeds for the growth of SCS-NPs or NSTs: Fe3O4@Au NP seeds dispersed in an aqueous CTAB solution (0.2 M) were added to a growth solution (composed of CTAB, HAuCl4, AgNO3, and ascorbic acid) produced SCS-NPs with a mean size of 34 nm (Fig. 1a), whereas Fe3O4@Au NP seeds dispersed in a sodium citrate solution (0.25 mM) produced multibranched NSTs with tip-to-tip distances on the order of 100 nm (Fig. 1b). The CTAB-stabilized SCS-NPs and NSTs were treated with Na-polystyrenesulfonate (PSS), an efficient detergent for removing CTAB,23 then stabilized in a solution of bovine serum albumin (BSA, 1 wt%) and stored at 4 °C prior to use. DLS analysis revealed that PSS-treated SCS-NPs and NSTs existed as submicron aggregates in physiological buffer but were more effectively dispersed in 1 wt% BSA, suggesting their stabilization by a persistent protein corona (see ESI, Fig. S3).38, 39
Fig. 1.
(a) TEM image of spheroidal core–shell Fe3O4@Au NPs (dav = 34 ± 4 nm); (b) TEM image of gold NSTs with magnetic cores (average tip-to-tip span: 100 ± 19 nm).
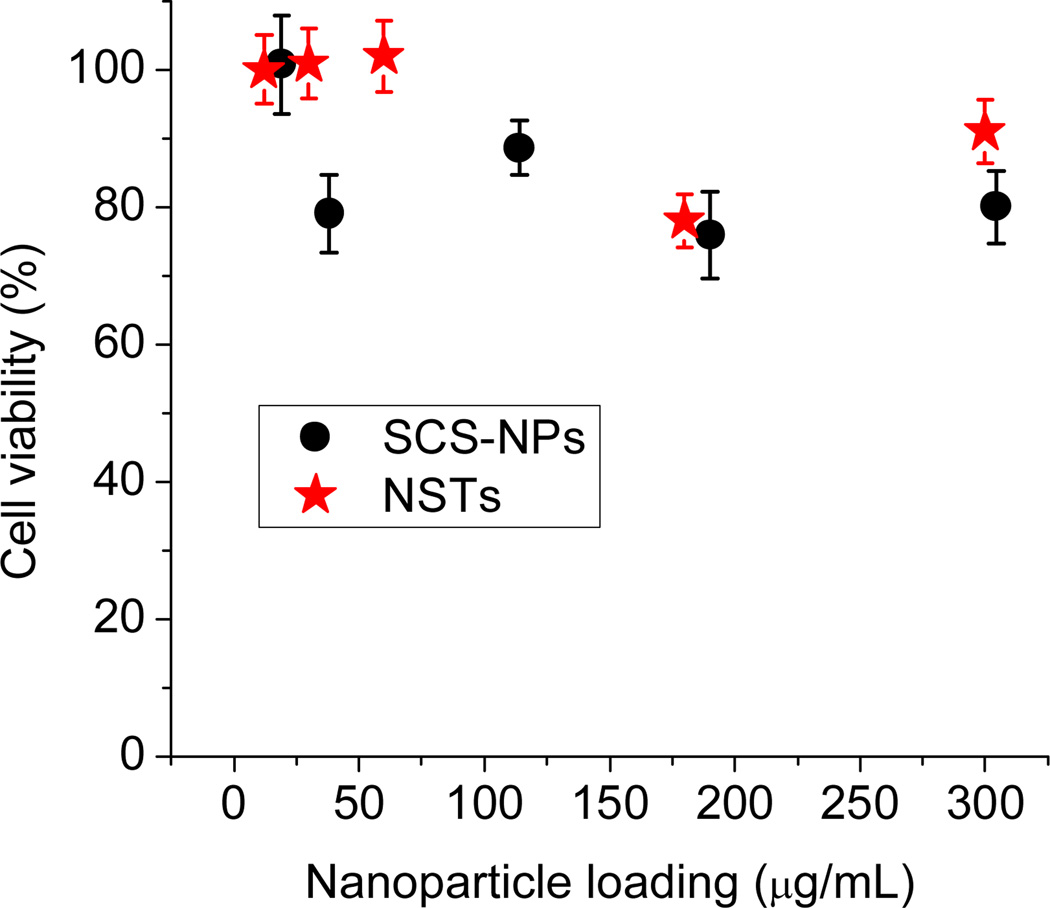
The cytotoxicity of BSA-stabilized SCS-NPs and NSTs were first evaluated using MTT viability assays. Murine macrophages (RAW 264.7 cells) were incubated for 24 h at various NP loadings prior to the MTT assay; in both cases, the nanoparticles had only modest effects in the range examined (up to 300 µg/mL for SCS-NPs, and over 900 µg/mL for NSTs), with cell viabilities of over 80% (partial data shown in Fig. 2). In the studies that follow, macrophages were exposed to SCS-NPs and NSTs at maximum loadings of 30 and 50 µg/mL respectively, well below the threshold for significant loss of cell viability. We thus considered all observable responses of the macrophages to internalized NPs to be distinct from cytotoxic effects.
Fig. 2.
MTT assay following a 24-h incubation of RAW 264.7 cells with BSA-stabilized SCS-NPs (black) and NSTs (red).
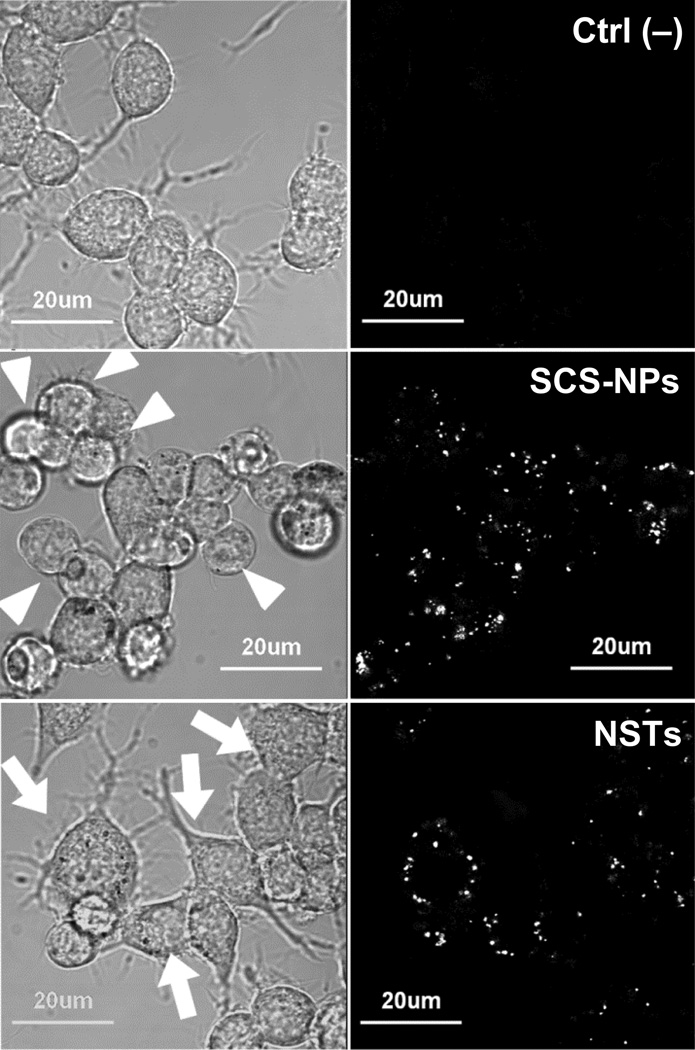
Changes in the morphology of murine macrophages were monitored by brightfield confocal microscopy during a 24-h exposure to either SCS-NPs (30 µg/mL) or NSTs (50 µg/mL). Evidence for NP internalization was obtained simultaneously using confocal reflectance (Fig. 3). RAW cells exposed to SCS-NPs exhibited a rounded (amoeboid) geometry within 6 h relative to non-treated control cells, whereas macrophages exposed to NSTs were enlarged and exhibited a ramified morphology with multiple filopodia. These changes in morphology are apparently unrelated to cytotoxicity according to the MTT assay, but are suggestive instead of macrophage activation, whose correlation with cell spreading has been well documented.24, 25
Fig. 3.
Confocal microscopy of untreated RAW cells (top), cells exposed to SCS-NPs (30 µg/mL, 6 h;middle) and NSTs (50 µg/mL, 6 h; bottom). Left, brightfield images reveal differences in cell morphology (highlighted by arrows); right, reflectance images (λex = 635 nm) indicate NP uptake.
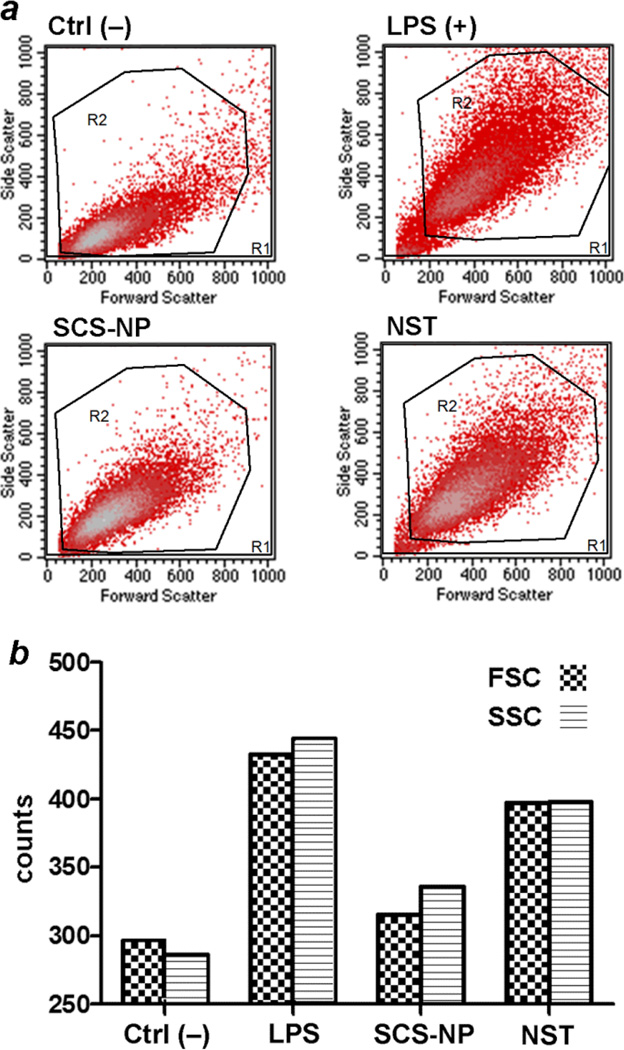
To determine whether the enlargement of RAW cells was statistically relevant and could be considered as a positive factor for macrophage activation, cell cultures treated with SCS-NPs or NSTs for 24 h were subjected to tryptic digestion and light scattering analysis by flow cytometry, and compared with RAW cells treated with lipopolysaccharide (LPS, 100 ng/mL) as a positive control for macrophage activation (Fig. 4). NST-treated cells exhibited higher levels of forward and side scatter (qualitative indicators of cell size and granularity, respectively) than untreated cells (Ctrl–), and similar levels to that produced by LPS-activated cells. Cells treated with SCS-NPs also produced higher scatter than the control cells, but less than that induced by NSTs or LPS.
Fig. 4.
Light scattering analysis from RAW cells by flow cytometry. (a) Negative control (untreated cells, upper left); positive control (cells incubated with LPS, upper right); cells incubated with BSA-coated SCS-NPs (lower right); cells incubated with BSA-coated NSTs (lower left). (b) Histograms representing relative levels of forward and side scatter in RAW cells (FSC, SSC = forward, side scattering counts). Macrophages treated with LPS and BSA-coated NSTs scattered more strongly than macrophages treated with SCS-NPs or untreated (control) cells.
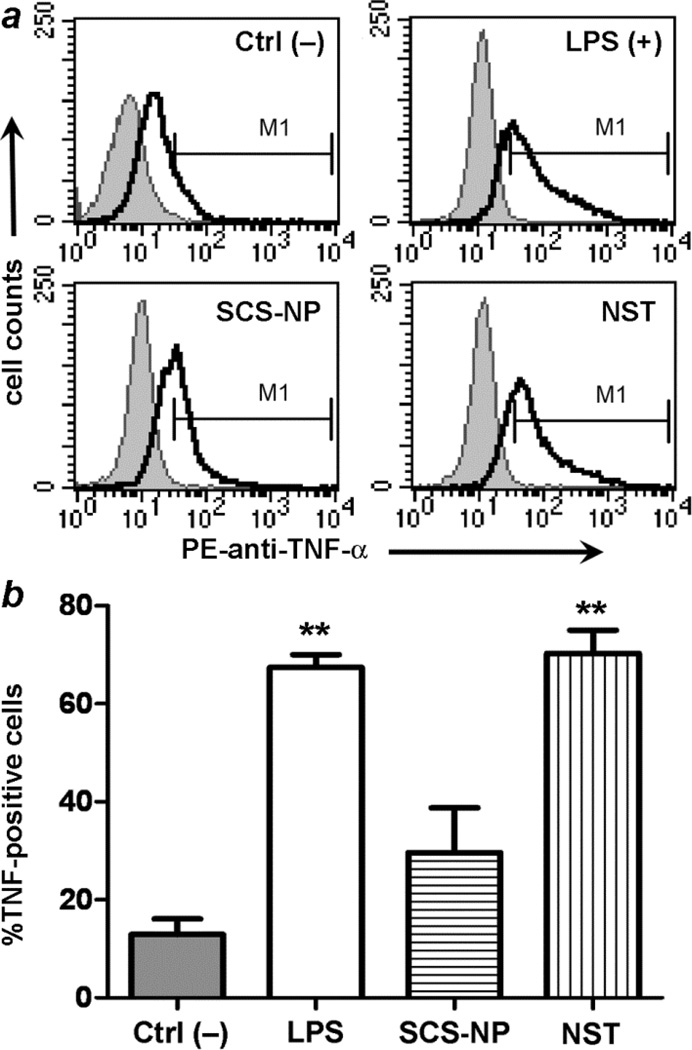
These observations motivated us to use molecular assays to determine whether RAW cells might be activated upon exposure to NSTs. Activated macrophages are well known to produce pro-inflammatory agents, namely tumor necrosis factor-α (TNF-α) and reactive oxygen species (ROS).26–28 RAW cells were incubated for 24 h with SCS-NPs and NSTs as before, then fixed and assayed for intracellular TNF-α production by flow cytometry and compared against cells treated with LPS and untreated cells (Fig. 5). Statistical analysis using a two-tailed t-test indicated a heightened level of TNF-α production in both NST-treated and LPS-treated macrophages, but cytokine production in macrophages exposed to SCS-NPs was less significant.
Fig. 5.
(a) Flow cytometry data indicating TNF-α levels in RAW cells: untreated cells (negative control, upper left); LPS-treated cells (upper right); cells incubated with BSA-stabilized SCS-NPs (lower right); cells incubated with BSA-stabilized NSTs (lower left). (b) Histogram representing TNF-α levels in RAW cells. LPS and BSA-stabilized NSTs stimulated TNF-α production, relative to Ctrl– (p < 0.01, **).
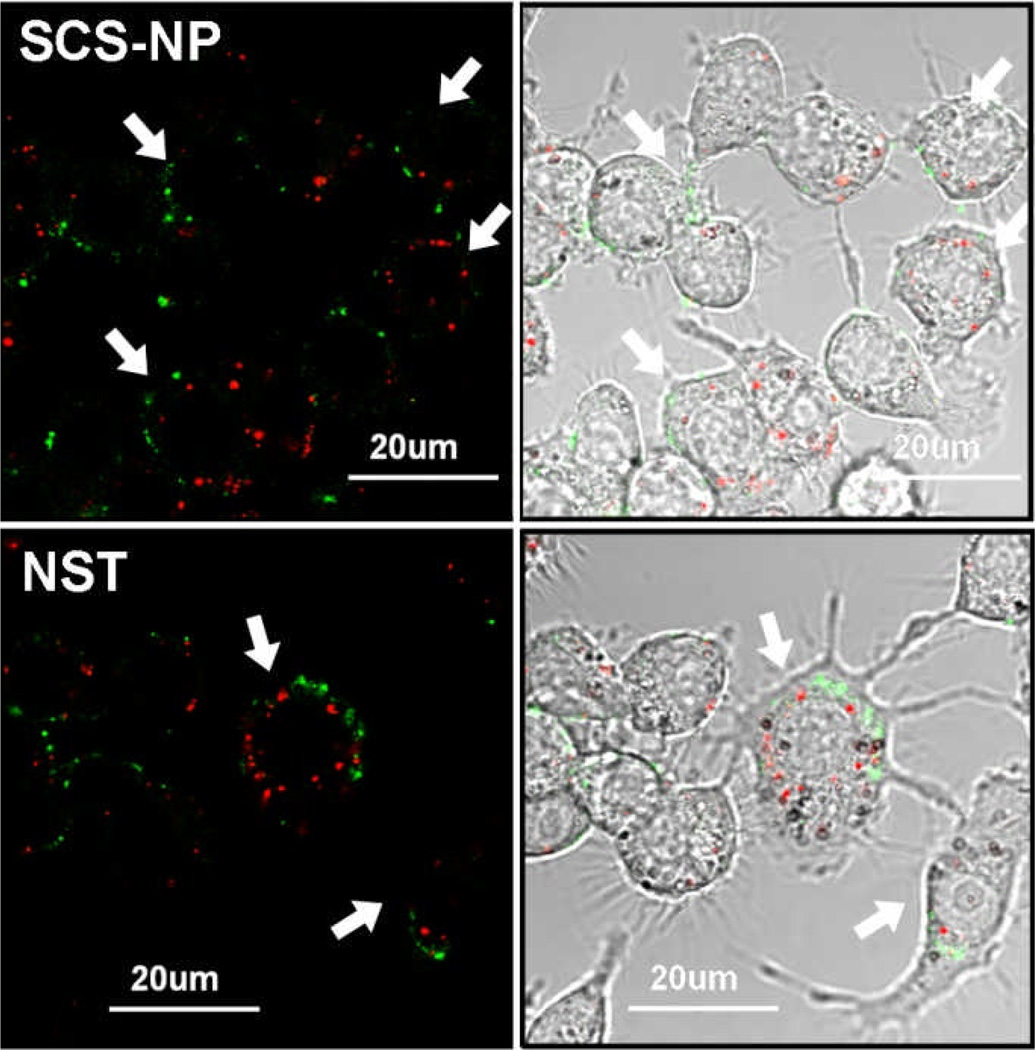
In order to determine ROS production in macrophages following exposure to NPs after a 24-h period, live cells were treated with 6-carboxy-2’,7’-dichlorodihydrofluorescein diacetate (H2DCFDA), a cell-permeant dye that is converted to fluorescent and impermeant DCF upon reaction with intracellular ROS.29 RAW cells treated with H2DCFDA were imaged by confocal fluorescence microscopy, which confirmed intracellular ROS production with SCS-NP or NST uptake, regardless of changes in cell morphology (Fig. 6), but macrophages that displayed high levels of both ROS and NST signals were noticeably larger and exhibited a ramified morphology, again suggestive of activation.
Fig. 6.
Multi-channel confocal microscopy of RAW 264.7 cells (marked by arrows) with internalized NPs (red) and DCF (green), a ROS-sensitive dye. NP and ROS signals imaged respectively by reflectance (λex = 635 nm; 100 nm bandpass filter) and fluorescence (λex = 488 nm; 55 nm bandpass filter). Top, RAW cells treated with SCS-NPs; bottom, cells treated with NSTs. For comparison with positive and negative control images, see ESI (Fig. S4).
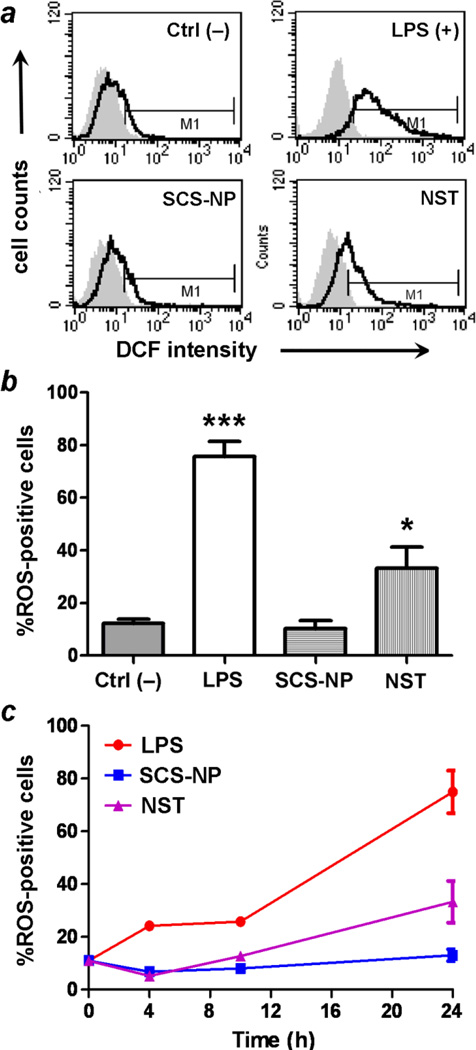
Flow cytometry indicated that RAW cells treated with NSTs displayed significant increases in ROS levels over time compared to untreated cells, similar to those stimulated by LPS, whereas cells treated with SCS-NPs exhibited low ROS levels, comparable to control cells (Fig. 7). A two-tailed t-test indicated that only LPS and NST-treated cells produced statistically significant increases in ROS production, based on their DCF signals. It is worth noting that ROS levels in NST-treated cells were relatively low at earlier time points (4 and 10 h), and mostly produced during the latter half of the experiment (Fig. 7c). This suggests that the appearance of enlarged, ramified macrophages, which occurred as early as 6 h after NST exposure (Fig. 3), is an early indicator of in vitro activation and a precursor to inflammation. The rapid adaptation of macrophages in response to their short-term exposure to BSA-stabilized NSTs is followed by an induction period of at least several hours, resulting in fully activated macrophages capable of releasing inflammatory agents such as TNF-α and ROS. This profile is rather different from LPS activation, which is capable of activating macrophages much more quickly.30 We thus consider the irregularly shaped NSTs as potentiators of macrophage activation.
Fig. 7.
(a) Flow cytometry of ROS production in RAW cells exposed to various stimuli (t = 24 h): control (upper left), LPS (upper right), SCS-NP (lower left), and NST (lower right). (b) ROS production is stimulated strongly by LPS (p < 0.001, ***) and by NSTs (p < 0.05, *), but not by SCS-NPs. (c) ROS production in stimulated macrophage as a function of incubation time. All experiments were performed in triplicate.
In comparison, RAW cells treated with BSA-stabilized SCS-NPs do not produce significant amounts of either TNF-α or ROS. Instead, they adopt an amoeboid geometry as early as 6 h after NP exposure, enabling their gradual desorption from the substrate. A number of unattached RAW cells could be observed after 24 h incubation with SCS-NPs, although a subsequent MTT analysis indicated that the cell population retained their vitality (Fig. 2). To determine whether the transformation of RAW cells into amoeboid form might be an alternate phenotype of macrophage activation,28, 31 SCS-NP treated RAW cells were screened for the release of multiple cytokines (IL-1B, -4, -6, -10, -17A) using an immunoassay kit. However, no measurable levels of these cytokines could be detected at any time over a 24-hour incubation period (data not shown). Thus, while the basis for the transformation of RAW cells into amoeboid form remains ambiguous, it is unlikely to be associated with a pro-inflammatory response.
There are at least two plausible reasons for the differential responses of RAW cells to CSC-NPs and NSTs. First, macrophages express a wide range of pattern recognition receptors (e.g., CD14 and Toll-like receptors) that can facilitate an adaptive immune response to a variety of antigenic factors.32 This includes particle size and shape, as has been shown in the binding and phagocytosis of polymeric microparticles.33, 34 Second, binding of the larger and multibranched NSTs may elicit multivalent recognition by the macrophages, which may in turn induce a stronger activation signal. Further studies are needed to identify specific macrophage receptors or mechanisms for morphology-dependent macrophage activation.
Lastly, we wished to determine whether the magnetomotive activity of SCS-NPs or NSTs had potential to generate pro-inflammatory signals, possibly through biomechanical signal transduction.35, 36 RAW cells incubated with SCS-NPs or NSTs were exposed to a rotating magnetic field gradient (|B| ~ 100 G) for 2 hours, prior to evaluation by flow cytometry for ROS production (Fig. S5, ESI). In this study, the exposure to magnetic field gradients did not appear to have a significant effect, relative either to control populations or to cells treated with LPS (see ESI for more details). Earlier imaging studies of magnetomotive NSTs in macrophages have shown that the large majority of particles become immobilized several hours after internalization,8 which suggests their magnetomotive force to be insufficient for stimulating a biomechanical response. This has some positive implications for applications of Fe3O4@Au NPs and other superparamagnetic species as T2-weighted MRI contrast agents, at least at low loadings.37
Conclusions
Murine RAW cells exhibit remarkable differences in their response to albumin-coated NPs as a function of size and shape following uptake, at particle concentrations well below their threshold for cytotoxicity (<50 µg/mL). The phagocytosis of NSTs resulted in the enlargement of RAW cells, along with marked increases in TNF-α and ROS production relative to control cells. In contrast, the phagocytosis of SCS-NPs promoted changes in macrophage shape from ramified to amoeboid form, but only a weak pro-inflammatory response was observed. Macrophages with internalized Fe3O4@Au SCS-NPs or NSTs appear to be insensitive to rotating magnetic field gradients at the exposure levels used in this study.
Supplementary Material
Acknowledgement
This work was supported by the National Institutes of Health (RC1 CA-147096).
Footnotes
Electronic Supplementary Information (ESI) available: Synthetic details, additional TEM images, absorbance spectra, and DLS analysis of SCS-NPs and NSTs, negative and positive control images for ROS imaging, and effect of magnetic field gradient on ROS production. See DOI: 10.1039/b000000x/
Notes and references
- 1.Wagner V, Dullaart A, Bock A-K, Zweck A. Nat. Biotechnol. 2006;24:1211–1217. doi: 10.1038/nbt1006-1211. [DOI] [PubMed] [Google Scholar]
- 2.Wang H, Huff TB, Zweifel DA, He W, Low PS, Wei A, Cheng J-X. Proc. Nat. Acad. Sci. USA. 2005;102:15752–15756. doi: 10.1073/pnas.0504892102. [DOI] [PMC free article] [PubMed] [Google Scholar]
- 3.Pitsillides CM, Joe EK, Wei X, Anderson RR, Lin CP. Biophys. J. 2003;84:4023–4032. doi: 10.1016/S0006-3495(03)75128-5. [DOI] [PMC free article] [PubMed] [Google Scholar]
- 4.Pissuwan D, Valenzuela SM, Killingsworth MC, Xu X, Cortie MB. J Nanoparticle Res. 2007;9:1109–1124. [Google Scholar]
- 5.Kooi ME, Cappendijk VC, Cleutjens KBJM, Kessels AGH, Kitslaar PJEHM, Borgers M, Frederik PM, Daemen MJAP, van Engelshoven JMA. Circulation. 2003;107:2453–2458. doi: 10.1161/01.CIR.0000068315.98705.CC. [DOI] [PubMed] [Google Scholar]
- 6.Kircher MF, Mahmood U, King RS, Weissleder R, Josephson L. Cancer Res. 2003;63:8122–8125. [PubMed] [Google Scholar]
- 7.Aaron JS, Oh J, Larson TA, Kumar S, Milner TE, Sokolov KV. Opt. Express. 2006;14:12930–12943. doi: 10.1364/oe.14.012930. [DOI] [PubMed] [Google Scholar]
- 8.Song H-M, Wei Q, Ong QK, Wei A. ACS Nano. 2010;4:5163–5173. doi: 10.1021/nn101202h. [DOI] [PMC free article] [PubMed] [Google Scholar]
- 9.Alexis F, Pridgen E, Molnar LK, Farokhzad OC. Mol. Pharmaceutics. 2008;5:505–515. doi: 10.1021/mp800051m. [DOI] [PMC free article] [PubMed] [Google Scholar]
- 10.Chithrani BD, Ghazani AA, Chan WCW. Nano Lett. 2006;6:662–668. doi: 10.1021/nl052396o. [DOI] [PubMed] [Google Scholar]
- 11.Zhang K, Fang H, Chen Z, Taylor J-SA, Wooley KL. Bioconjugate Chem. 2008;19:1880–1887. doi: 10.1021/bc800160b. [DOI] [PMC free article] [PubMed] [Google Scholar]
- 12.Gratton SEA, Ropp PA, Pohlhaus PD, Luft JC, Madden VJ, Napier ME, DeSimone JM. Proc. Nat. Acad. Sci. USA. 2008;105:11613–11618. doi: 10.1073/pnas.0801763105. [DOI] [PMC free article] [PubMed] [Google Scholar]
- 13.Connor EE, Mwamuka J, Gole A, Murphy CJ, Wyatt MD. Small. 2005;1:325–327. doi: 10.1002/smll.200400093. [DOI] [PubMed] [Google Scholar]
- 14.Longmire M, Choyke PL, Kobayashi H. Nanomedicine. 2008;3:703–717. doi: 10.2217/17435889.3.5.703. [DOI] [PMC free article] [PubMed] [Google Scholar]
- 15.Thakor AS, Jokerst J, Zavaleta C, Massoud TF, Gambhir SS. Nano Lett. 2011;11:4029–4036. doi: 10.1021/nl202559p. [DOI] [PMC free article] [PubMed] [Google Scholar]
- 16.Dreaden EC, Alkilany AM, Huang X, Murphy CJ, El-Sayed MA. Chem. Soc. Rev. 2012;41:2740–2779. doi: 10.1039/c1cs15237h. [DOI] [PMC free article] [PubMed] [Google Scholar]
- 17.Dobrovolskaia MA, McNeil SE. Nat. Nanotechnol. 2007;2:469–478. doi: 10.1038/nnano.2007.223. [DOI] [PubMed] [Google Scholar]
- 18.Bartneck M, Keul HA, Singh S, Czaja K, Bornemann JR, Bockstaller M, Moeller M, Zwadlo-Klarwasser G, Groll JR. ACS Nano. 2010;4:3073–3086. doi: 10.1021/nn100262h. [DOI] [PubMed] [Google Scholar]
- 19.Bastús NG, Sánchez-Tilló E, Pujals S, Farrera C, López C, Giralt E, Celada A, Lloberas J, Puntes V. ACS Nano. 2009;3:1335–1344. doi: 10.1021/nn8008273. [DOI] [PubMed] [Google Scholar]
- 20.Albanese A, Sykes EA, Chan WCW. ACS Nano. 2010;4:2490–2493. doi: 10.1021/nn100776z. [DOI] [PubMed] [Google Scholar]
- 21.Oh W-K, Kim S, Choi M, Kim C, Jeong YS, Cho B-R, Hahn J-S, Jang J. ACS Nano. 2010;4:5301–5313. doi: 10.1021/nn100561e. [DOI] [PubMed] [Google Scholar]
- 22.Hutter E, Boridy S, Labrecque S, Lalancette-Heébert M, Kriz J, Winnik FM, Maysinger D. ACS Nano. 2010;4:2595–2606. doi: 10.1021/nn901869f. [DOI] [PubMed] [Google Scholar]
- 23.Leonov AP, Zheng J, Clogston JD, Stern ST, Patri AK, Wei A. ACS Nano. 2008;2:2481–2488. doi: 10.1021/nn800466c. [DOI] [PMC free article] [PubMed] [Google Scholar]
- 24.Mosser DM, Edwards JP. Nat. Rev. Immunol. 2008;8:958–969. doi: 10.1038/nri2448. [DOI] [PMC free article] [PubMed] [Google Scholar]
- 25.Schilling T, Lehmann F, Rückert B, Eder C. J Physiol. 2004;557:105–120. doi: 10.1113/jphysiol.2004.060632. [DOI] [PMC free article] [PubMed] [Google Scholar]
- 26.Han J-M, Jin Y-Y, Kim HY, Park KH, Lee WS, Jeong T-S. Biol. Pharm. Bull. 2010;33:1019–1023. doi: 10.1248/bpb.33.1019. [DOI] [PubMed] [Google Scholar]
- 27.Gauss KA, Nelson-Overton LK, Siemsen DW, Gao Y, DeLeo FR, Quinn MT. J Leukoc. Biol. 2007;82:729–741. doi: 10.1189/jlb.1206735. [DOI] [PubMed] [Google Scholar]
- 28.Gordon S, Taylor PR. Nat. Rev. Immunol. 2005;5:953–964. doi: 10.1038/nri1733. [DOI] [PubMed] [Google Scholar]
- 29.Davies NJ, Hayden RE, Simpson PJ, Birtwistle J, Mayer K, Ride JP, Bunce CM. Cancer Res. 2009;69:4769–4775. doi: 10.1158/0008-5472.CAN-08-4533. [DOI] [PubMed] [Google Scholar]
- 30.West MA, Koons A. J Trauma. 2008;65:893–900. doi: 10.1097/TA.0b013e3181877fde. [DOI] [PubMed] [Google Scholar]
- 31.Masuda T, Croom D, Hida H, Kirov SA. Glia. 2011;59:1744–1753. doi: 10.1002/glia.21220. [DOI] [PMC free article] [PubMed] [Google Scholar]
- 32.Taylor PR, Martinez-Pomares L, Stacey M, Lin H-H, Brown GD, Gordon S. Annu. Rev. Immunol. 2005;23:901–944. doi: 10.1146/annurev.immunol.23.021704.115816. [DOI] [PubMed] [Google Scholar]
- 33.Champion JA, Mitragotri S. Proc. Natl. Acad. Sci. U.S.A. 2006;103:4930–4934. doi: 10.1073/pnas.0600997103. [DOI] [PMC free article] [PubMed] [Google Scholar]
- 34.Doshi N, Mitragotri S. PLoS ONE. 2011;5:e10051. doi: 10.1371/journal.pone.0010051. [DOI] [PMC free article] [PubMed] [Google Scholar]
- 35.Sakamoto H, Aikawa M, Hill CC, Weiss D, Taylor WR, Libby P, Lee RT. Circulation. 2001;104:109–114. doi: 10.1161/hc2701.091070. [DOI] [PubMed] [Google Scholar]
- 36.Pugin J, Dunn I, Jolliet P, Tassaux D, Magnenat J-L, Nicod LP, Chevrolet J-C. Am. J. Physiol. Lung Cell. Mol. Physiol. 1998;275:L1040–L1050. doi: 10.1152/ajplung.1998.275.6.L1040. [DOI] [PubMed] [Google Scholar]
- 37.Kumagai M, Sarma TK, Cabral H, Kaida S, Sekino M, Herlambang N, Osada K, Kano MR, Nishiyama N, Kataoka K. Macromol. Rapid Commun. 2010;31:1521–1528. doi: 10.1002/marc.201000341. [DOI] [PubMed] [Google Scholar]
- 38.Lynch I, Salvati A, Dawson KA. Nature Nanotech. 2009;4:546–547. doi: 10.1038/nnano.2009.248. [DOI] [PubMed] [Google Scholar]
- 39.Soenen SJ, Rivera-Gil P, Montenegro J-M, Parak WJ, De Smedt SC, Braeckmans K. Nano Today. 2011;6:446–465. [Google Scholar]
Associated Data
This section collects any data citations, data availability statements, or supplementary materials included in this article.


