Abstract
Systemic insulin administration causes hypoaminoacidemia by inhibiting protein degradation, which may in turn inhibit muscle protein synthesis (PS). Insulin enhances muscle mitochondrial PS and ATP production when hypoaminoacidemia is prevented by exogenous amino acid (AA) replacement. We determined whether insulin would stimulate mitochondrial PS and ATP production in the absence of AA replacement. Using l-[1,2-13C]leucine as a tracer, we measured the fractional synthetic rate of mitochondrial as well as sarcoplasmic and mixed muscle proteins in 18 participants during sustained (7-h) insulin or saline infusion (n = 9 each). We also measured muscle ATP production, mitochondrial enzyme activities, mRNA levels of mitochondrial genes, and phosphorylation of signaling proteins regulating protein synthesis. The concentration of circulating essential AA decreased during insulin infusion. Mitochondrial, sarcoplasmic, and mixed muscle PS rates were also lower during insulin (2–7 h) than during saline infusions despite increased mRNA levels of selected mitochondrial genes. Under these conditions, insulin did not alter mitochondrial enzyme activities and ATP production. These effects were associated with enhanced phosphorylation of Akt but not of protein synthesis activators mTOR, p70S6K, and 4EBP1. In conclusion, sustained physiological hyperinsulinemia without AA replacement did not stimulate PS of mixed muscle or protein subfractions and did not alter muscle mitochondrial ATP production in healthy humans. These results support that insulin and AA act in conjunction to stimulate muscle mitochondrial function and mitochondrial protein synthesis.
Keywords: insulin, amino acids, protein synthesis, mitochondria, mammalian target of rapamycin
a positive impact of insulin has emerged in recent years on skeletal muscle mitochondrial function, which could provide adaptive postprandial increments in ATP production. The effect of insulin to acutely stimulate muscle mitochondrial gene expression, protein synthesis, enzyme activities, and ATP production has been demonstrated in healthy humans (25) and appears to be impaired in insulin-resistant conditions such as type 2 diabetes (25). Potential interactions between insulin and substrate availability in the regulation of muscle energy metabolism remain, however, largely undetermined despite their potentially major clinical impact and pathophysiological relevance. Importantly, acute insulin infusion invariably lowers plasma amino acid (AA) concentrations by suppressing whole body and muscle protein breakdown (4, 7, 9), and acute mitochondrial effects of insulin were observed when the insulin-induced decline in plasma AA was prevented by exogenous infusion (25). Stimulation of mitochondrial protein synthesis is a potential important contributor to mitochondrial insulin effects (25), and a key role of AA to stimulate muscle protein synthesis both independently (10, 13, 14, 17, 27) and synergistically with insulin (8, 18, 28) has also been well elucidated. Independent effects of dietary AA supplementation to enhance skeletal muscle mitochondrial biogenesis have also been recently demonstrated in vivo in rodents, particularly with branched-chain amino acid (BCAA)-enriched mixtures (6). Potential in vivo interactions between insulin and AA in the regulation of skeletal muscle mitochondrial gene expression and function remainto be defined, however, and whether previously demonstrated insulin effects (25) occur in the absence of AA replacement is not known.
We tested the hypothesis that insulin infusion without exogenous AA does not alter mitochondrial proteins synthesis or ATP production in healthy humans. We further hypothesized there would be no changes to key signaling proteins of the mTOR pathway that regulate protein synthesis in response to amino acids (10, 13, 14, 17, 27) or insulin (21).
METHODS
Study participants and materials.
The study protocol was approved by the Institutional Review Board at the Mayo Clinic. All studies were performed at the Mayo Clinic Clinical Research Unit (CRU). Eighteen healthy participants (10 M/8 F) between the ages of 20 and 30 yr gave informed consent to participate in the study. They were randomly assigned to receive either insulin infusion with glucose replacement or saline infusion (n = 9 each, both groups 5 M/4 F). Characteristics of participants are shown in Table 1. Fat mass and fat-free mass (FFM) were measured by dual X-ray absorptiometry (Lunar DPX-IQ, Madison, WI). l-[1,2-13C]leucine (99 mol % enriched) was purchased from Isotec (Miamisburg, OH). Isotopic and chemical purity were checked by gas chromatography-mass spectrometry. Tracer solutions were tested for sterility and pyrogens and were prepared in a sterile environment. Humulin R insulin (Lilly, Indianapolis, IN) was used for insulin infusion.
Table 1.
Anthropometric parameters in Saline and Insulin groups
| Saline | Insulin | |
|---|---|---|
| Sex | 5M/4F | 5M/4F |
| Age, yr | 26 ± 2 | 24 ± 1 |
| Height, cm | 180 ± 4 | 174 ± 3 |
| Weight, kg | 79 ± 5 | 72 ± 4 |
| BMI, kg/m2 | 24.1 ± 0.8 | 23.5 ± 0.9 |
| Body fat, % | 23 ± 3.3 | 23.9 ± 3.4 |
| Lean body mass, kg | 47.3 ± 7.3 | 50.1 ± 3.5 |
Values are means ± SE. No statistically significant differences were observed among study groups.
Study protocol.
All participants were on a standard weight-maintaining diet (carbohydrate/protein/fat, 55:15:30% by calories) provided from the Mayo Medical Center CRU for 3 consecutive days before each inpatient study period. All participants were admitted to the CRU at 1700 on the day before the study. They ingested a standard meal at 1800 and a standard snack at 2200 to avoid prolonged fasting on the following day. All studies were performed in the postabsorptive state. At 0700 (t = −180 min) of the day following admission, a priming dose of l-[1,2-13C]leucine (2.2 mg/kg FFM) was administered through a peripheral forearm vein, followed by a continuous isotope infusion at the rate of 2.2 mg·kg FFM−1·h−1. At 1000 (t = 0), insulin (1.5 mU·kg FFM−1·min−1) or normal saline infusions began. Arterialized blood glucose was measured every 10 min with a Beckman glucose analyzer (Fullerton, CA), and the glucose (40% solution) infusion rate was adjusted to maintain euglycemia in the insulin-infused group. At 1000, just before the start of insulin or saline infusions (t = 0), 1200 (t = 2 h) and 1700 (t = 7 h), vastus lateralis muscle samples (∼300 mg each) were obtained under local anesthesia (Lidocaine, 2%) with a percutaneous needle as described (25). A portion of fresh muscle was used to measure mitochondrial ATP production at the 0- and 7-h time points, and the remaining tissue was immediately frozen in liquid nitrogen and kept at −80°C until use for analyses. The study was part of a larger protocol designed to investigate the time course of insulin effects on leg protein turnover.
RNA isolation and muscle transcript levels.
Total RNA was extracted from skeletal muscle tissue (∼20 mg) by the guanidinium method (Tri Reagent;, Molecular Research Center, Cincinnati, OH). Total RNA (1 μg) was treated with DNase (Life Technologies, Gaithersburg, MD) and then reverse-transcribed using the TaqMan reagents (PE Biosystems, Foster City, CA) according to the manufacturer's instructions. Transcript levels of selected mitochondrial genes and regulators of mitochondrial gene expression and function were measured using Real Time PCR as referenced (1, 25). In particular, peroxisome proliferator-activated receptor-γ coactivator 1α (PGC-1α), nuclear respiratory factor 1 (NRF1), and mitochondrial transcription factor 1 (tFAM) were selected as energy metabolism master regulators for their previously demonstrated key roles in enhancement of mitochondrial biogenesis and transcriptional gene expression and function (20, 23). Transcript levels of mitochondrial and nuclear encoded subunits of the mitochondrial respiratory chain flux-generating enzyme cytochrome c oxidase (COX) COX III and COX IV were also measured. Primers and probes were selected by using the PRIMER EXPRESS software (PE Biosystems). Probe for the nuclear DNA-encoded COX IV were designed to span over one intron to prevent amplification of potential contaminating DNA. Because the mitochondrial genome does not contain introns, reverse primers for amplification of mitochondrial DNA-encoded COX III were designed to target several mRNA-specific nucleotides including the poly(A)+ tail string (1, 25). The signal for 28S rRNA was used to normalize against differences in RNA isolation and RNA degradation and in the efficiencies of the reverse transcription and PCRs. The final quantitation was achieved with a relative standard curve, and results are expressed as percent average value in the saline-infused group.
Mitochondrial enzyme activities and ATP production.
A 50-mg portion of muscle from the 0-h and 7-h biopsies was kept fresh on ice in saline-soaked gauze for measurement of mitochondrial ATP production. Rapid separation of mitochondria by differential centrifugation was performed as described (25). Aliquots of the final mitochondrial suspension were used to measure mitochondrial ATP production rate with a bioluminescence technique (25). The reaction mixture included a luciferin-luciferase ATP-monitoring reagent (formula SL; BioThema, Dalarö, Finland), substrates for oxidation, and 35 μM ADP. Substrates added were as follows (in mM final concentration): 1 pyruvate plus 1 malate (PM), 0.05 palmitoyl l-carnitine plus 1 malate (PCM), 10 glutamate plus 1 malate (GM), 20 succinate plus 0.1 rotenone (SR), 1 pyruvate plus 0.05 palmitoyl l-carnitine plus 10 α-ketoglutarate plus 1 malate (PPKM), 10 α-ketoglutarate, or 1 N,N,N′,N′-tetramethyl-p-phenylenediamine plus 5 ascorbate (TA), with blank tubes used for background measurement. All reactions for a given sample were monitored simultaneously and calibrated with addition of an ATP standard (BioOrbit 1251 luminometer, Turku, Finland). Activity of mitochondrial enzymes COX (respiratory chain) and citrate synthase (TCA cycle) were measured from tissue aliquots as previously described (25).
Protein synthesis.
A separate ∼150-mg piece of muscle was used to isolate the mitochondrial protein fraction by differential centrifugation as described (2). Muscle mitochondrial proteins were then hydrolyzed overnight in 0.6 mol/l HCl in the presence of cation exchange resin (AG-50; Bio-Rad, Richmond, CA) and subsequently purified, dried (SpeedVac, Savant Instruments), and derivatized as their trimethyl acetyl methyl ester. [13C]leucine enrichment in muscle proteins was determined using a gas chromatograph-combustion isotope ratio mass spectrometer (GC-C-IRMS; Finigan MAT, Bremen, Germany) as described (2). Tissue fluid AA were derivatized as t-butyldimethylsilyl ester derivatives and analyzed for [13C]leucine enrichment with gas chromatograph-mass spectrometer (GC-MS; Hewlett-Packard Engine, Avondale, CA) (26).
The fractional synthetic rate (FSR) for mitochondrial proteins was calculated as follows (25): FSR = (%/h) = (Ef − Ei)/Ep × 1/t × 100, where Ef and Ei represent the enrichments as atom percent excess of 13C derived from the combustion of muscle fraction obtained from the muscle biopsies; Ep is the precursor pool (tissue fluid leucine) enrichment; and t represents the time between biopsies in hours.
Western blotting.
Muscle samples were homogenized in ice-cold cell lysis buffer (Cell Signaling Technology, Beverly, MA) supplemented with protease inhibitors (Mini Complete; Roche, Indianapolis, IN) and incubated on ice for 30 min. After high-speed centrifugation, supernatants from each sample were used for Western analysis (1). The same amount of protein was loaded onto each gel lane for each blot (40–60 μg depending on target protein abundance). Densitometric analysis was performed using a Kodak Image Station 1000 and infrared imaging (Licor Biosciences, Lincoln, NE). Antibodies for phosphorylated and/or total Akt, sestrin-2 (SESN2), mammalian target of rapamycin (mTOR), eukaryotic initiation factor (eIF)2α, p70 S6 kinase (S6K), eIF4E-binding protein-1 (4EBP1), forkhead box subgroup O (FOXO)3A, beclin, and glyceraldehyde-3-phosphate dehydrogenase (GAPDH) were from Cell Signaling Technology. The specific phosphorylation sites measured were: Thr37/46-4EBP1, Thr308-Akt, Ser2448-mTOR, Thr389-S6K, Ser51-EIF2α, and Thr32-FOXO3A. Results for Akt, mTOR, EIF2α, S6K, 4EBP1, and FOXO3A were expressed as ratios between phosphorylated and total protein. Total p62, beclin, and SESN2 levels were normalized for GAPDH protein content.
Substrates and hormones.
Blood glucose was measured by the glucose oxidase method using a glucose analyzer (Beckman Instruments, Fullerton, CA). Plasma insulin was measured by a chemoluminescent sandwich assay (based on a kit from Sanofi Diagnostics, Chaska, MN). Plasma AA concentrations were measured as recently described (15). Briefly, plasma samples and AA calibration standards were prepared with MassTrak Amino Acid Analysis Solution (AAA) from Waters according to instructions, with slight modifications for detection on a mass spectrometer. A solution containing l-[U-13C4]aspartic acid, l-[U13C3]alanine, l-[U13C4]threonine, l-[U-13C5]proline, l-[U-13C5]valine, [U-13C6]leucine, [U-13C6]phenylalanine (Cambridge Isotope Laboratories), [13C6]tyrosine (Isotec), l-arginine (15N2,2H2; MassTrace), and norvaline (Sigma) in 0.01 N HCl was used as internal standard. Frozen plasma samples were thawed, spiked with internal standard, and then deproteinized with cold MeOH followed by centrifugation at 10,000 g for 5 min prior to derivatization with 6-aminoquinolyl-N-hydroxysuccinimidyl carbamate. High-resolution separation was done using an Acquity UPLC system (15). Mass detection was completed on a TSQ Ultra Quantum from Thermo Finnigan running in electrospray ionization positive mode (15).
Statistical analysis.
Multiple measurement ANOVA was used to compare results in insulin- and saline-infused groups. Pairwise comparisons were made with Student's t-test. P values < 0.05 were considered statistically significant.
RESULTS
Plasma glucose, insulin, and AA concentrations.
In the Insulin group, mean plasma insulin concentration was maintained at a similar elevated concentration above baseline following 2 and 7 h of infusion (Table 2). Plasma glucose was measured at 15-min intervals throughout the study and was maintained within 10% of the baseline concentration (only 2-h and 7-h values shown in Table 2). Plasma concentrations of several AAs declined during insulin infusion but not saline infusion (Table 3). The decline in AA included most essential AAs, including the BCAAs. Insulin also reduced glutamine, aspartic acid, glutamic acid, and arginine. These changes were by design at variance with a previous study (25), in which insulin and AA infusions were combined to prevent the fall in plasma AA concentrations.
Table 2.
Arterial plasma insulin and glucose concentrations at the start (t = 0 h) and after 2 and 7 h of Saline or Insulin infusions
| Saline |
Insulin |
|||||
|---|---|---|---|---|---|---|
| Time | 0 h | 2 h | 7 h | 0 h | 2 h | 7 h |
| Insulin, μIU/ml | 3 ± 2 | 4 ± 2 | 2 ± 2 | 4 ± 2 | 50 ± 4* | 48 ± 4* |
| Glucose, mg/dl | 86 ± 2 | 84 ± 3 | 82 ± 3 | 88 ± 3 | 90 ± 3 | 89 ± 3 |
Values are means ± SE.
P < 0.05 vs. t = 0 and corresponding Saline.
Table 3.
Arterial plasma concentrations of essential and nonessential amino acids and selected amino acid metabolites (μmol/l) in Saline and Insulin groups at the start (t = 0 h) and after 2 and 7 h of Saline or Insulin infusions
| Saline |
Insulin |
|||||
|---|---|---|---|---|---|---|
| Time | 0 h | 2 h | 7 h | 0 h | 2 h | 7 h |
| Leucine | 135 ± 7 | 145 ± 8 | 168 ± 4 | 142 ± 8 | 83 ± 4* | 69 ± 3* |
| Isoleucine | 55 ± 3 | 55 ± 4 | 62 ± 3 | 59 ± 4 | 23 ± 2* | 14 ± 2* |
| Valine | 204 ± 12 | 195 ± 11 | 188 ± 9 | 212 ± 12 | 143 ± 8* | 93 ± 6* |
| Phenylalanine | 53 ± 1 | 56 ± 2 | 55 ± 2 | 54 ± 2 | 45 ± 2* | 45 ± 2* |
| Tyrosine | 46 ± 3 | 47 ± 3 | 46 ± 2 | 49 ± 3 | 35 ± 3* | 34 ± 3* |
| Lysine | 156 ± 5 | 160 ± 9 | 144 ± 7 | 161 ± 5 | 137 ± 4* | 108 ± 4* |
| Arginine | 74 ± 4 | 81 ± 6 | 68 ± 5 | 81 ± 4 | 61 ± 4* | 46 ± 4* |
| Methionine | 16 ± 1 | 16 ± 1 | 14 ± 1 | 18 ± 1 | 11 ± 1* | 7 ± 1* |
| Glutamine | 501 ± 24 | 554 ± 30 | 516 ± 29 | 558 ± 23 | 483 ± 30* | 480 ± 27* |
| Alanine | 173 ± 13 | 169 ± 13 | 147 ± 12 | 192 ± 16 | 229 ± 8* | 258 ± 11* |
| Aspartic acid | 2.1 ± 0.2 | 3.3 ± 1.3 | 1.4 ± 0.2 | 2 ± 0.1 | 1.2 ± 0.1* | 1 ± 0.1* |
| Glutamic acid | 39 ± 3 | 36 ± 3 | 32 ± 4 | 36 ± 3 | 29 ± 3* | 26 ± 2* |
| Serine | 76 ± 5 | 84 ± 9 | 72 ± 5 | 99 ± 4 | 72 ± 5* | 59 ± 6* |
| Glycine | 161 ± 7 | 170 ± 10 | 156 ± 10 | 200 ± 24 | 192 ± 26 | 86 ± 28* |
| Histidine | 66 ± 5 | 71 ± 5 | 67 ± 4 | 75 ± 3 | 63 ± 3* | 62 ± 4* |
| Threonine | 26 ± 2 | 24 ± 1 | 26 ± 2 | 24 ± 1 | 26 ± 2 | 24 ± 1 |
| 3-Methylhystidine | 5 ± 0.4 | 5 ± 0.4 | 4.6 ± 0.5 | 5 ± 0.5 | 4.5 ± 0.4 | 3.7 ± 0.4* |
Values are means ± SE.
P < 0.05 vs. t = 0 and corresponding change in Saline group.
Mitochondrial-energy metabolism gene transcript levels.
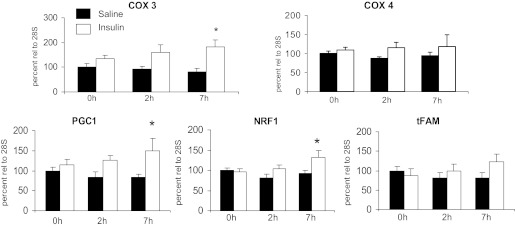
Transcript levels of mitochondrial-energy metabolism genes did not change compared with basal values after 2 h of insulin or saline infusion, with similar results in the two groups (Fig. 1). However, at 7 h there were increases in the mRNAs for COX III, PGC-1α, and NRF1 (P < 0.05 vs. basal and changes in saline). A similar trend did not reach statistical significance for tFAM.
Fig. 1.
Effects of sustained insulin or saline infusions on transcript levels of mitochondrial genes and nuclear-encoded regulators of mitochondrial biogenesis. See methods for definitions. *P < 0.05, Insulin vs. Saline.
Mitochondrial enzyme activities and ATP production rate.
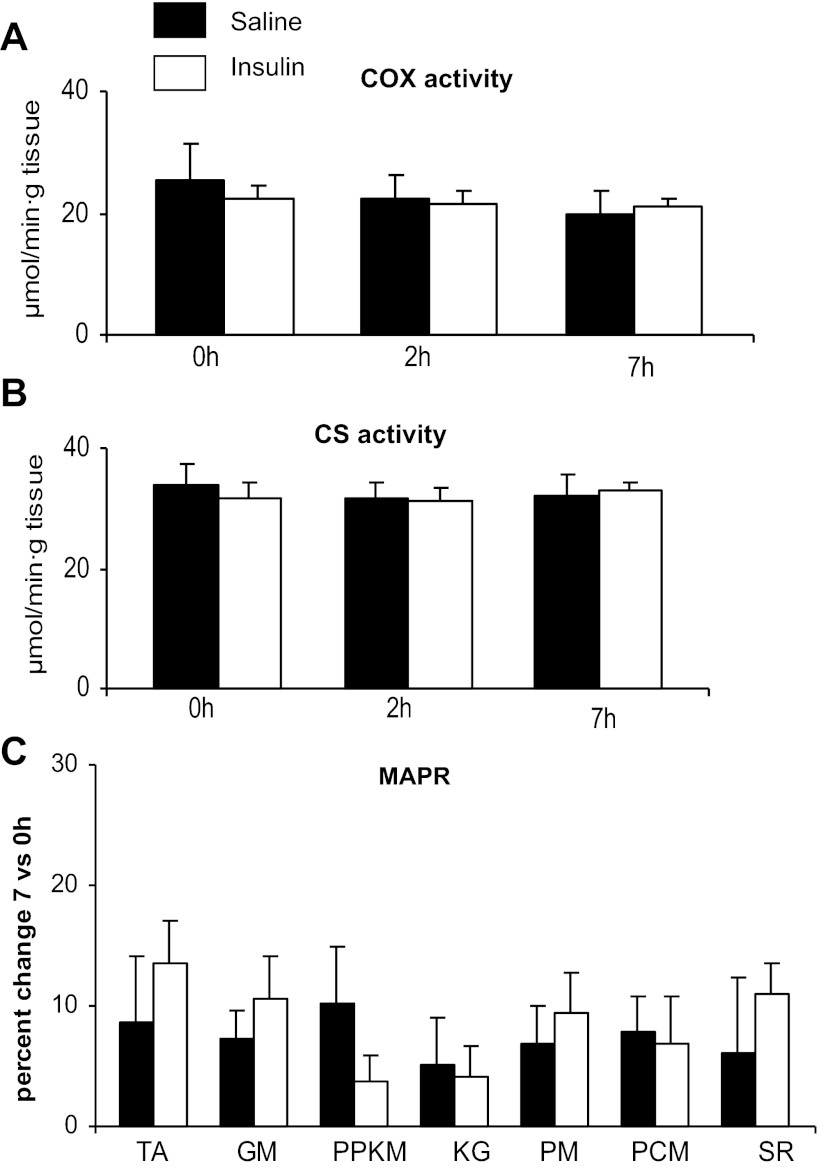
Unlike the changes observed for energy metabolism transcripts, insulin infusion did not result in changes in the activity of COX or citrate synthase activities and ATP production was unchanged (Fig. 2).
Fig. 2.
Effects of sustained insulin or saline infusions on mitochondrial cytochrome c oxidase (COX; A) and citrate synthase (CS; B) enzyme activity and percent changes in mitochondrial ATP production rate (MAPR) measured using different substrates (see methods for definitions; C); 2-h measurements were not available for ATP production.
Protein FSR.
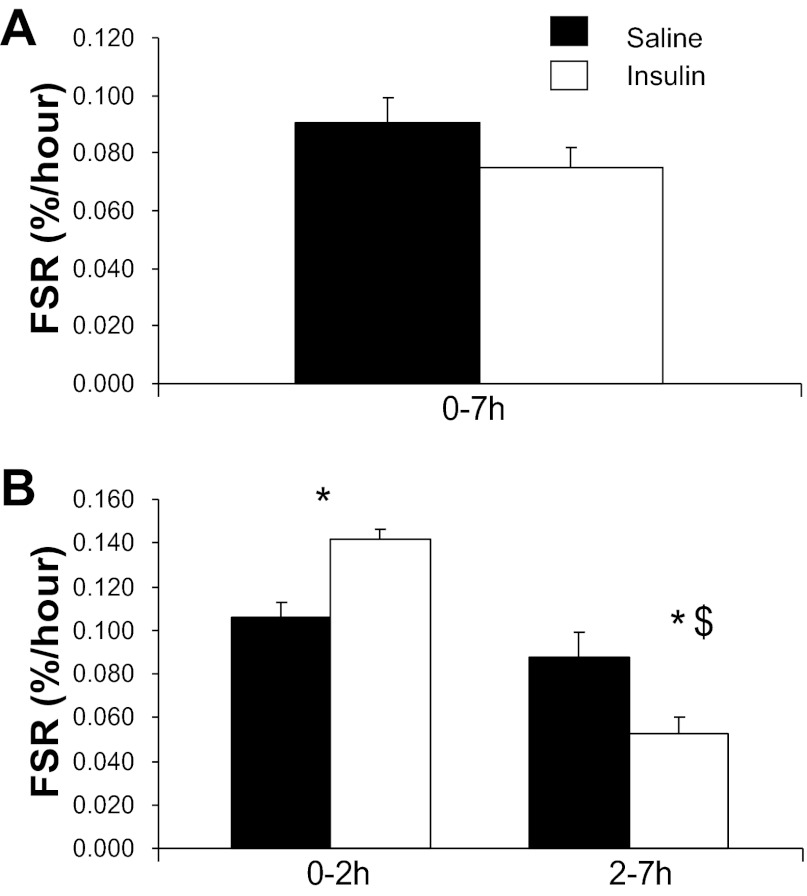
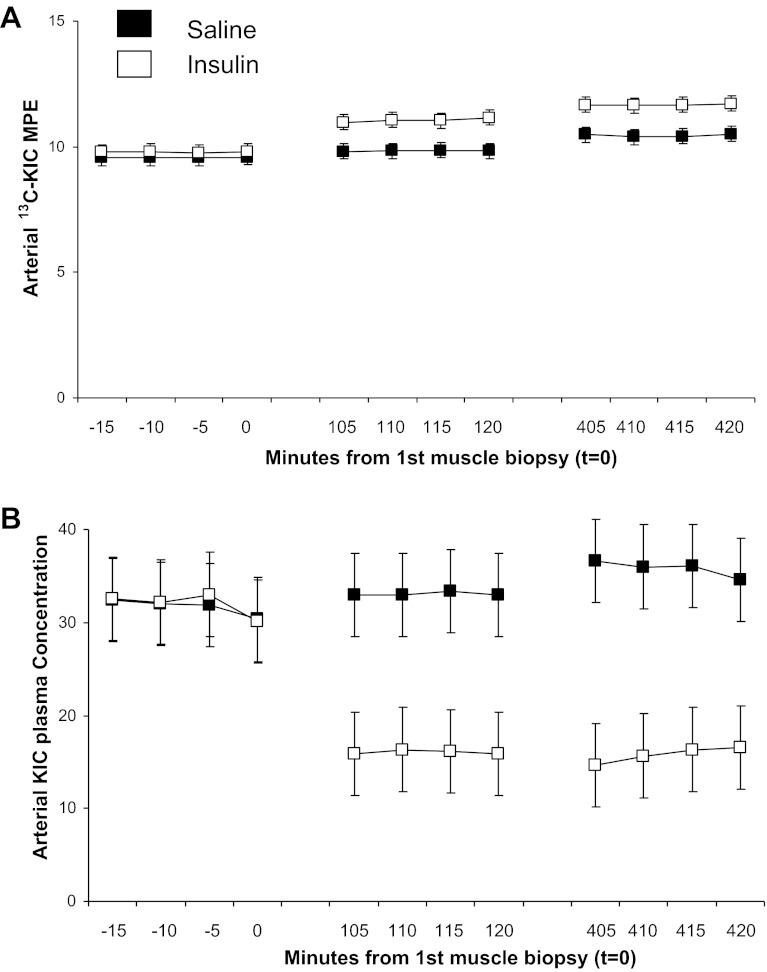
Under the current experimental conditions, insulin and saline groups had similar mitochondrial protein FSR when averaged over the entire 7-h infusion period (Fig. 3). However, insulin effects varied over time with an early stimulation as shown by a higher FSR in the insulin vs. saline group from 0 to 2 h, followed by reduction of mitochondrial protein FSR from 2 to 7 h that was greater in the insulin group than with the saline group. The increments in [13C]leucine atom percent enrichment (APE) in the mitochondrial protein fraction were consistent with changes in FSR with the following values: insulin group: 0.0262 ± 0.0026 and 0.0287 ± 0.05 for the 0–2 and 2–7 h times, respectively; saline group (both P < 0.05 vs. corresponding Insulin): 0.0178 ± 0.008 and 0.0392 ± 0.049 for the 0–2 and 2–7 h times, respectively. The tissue fluid enrichment, used to calculate the FSR, increased during the study (Saline group: 8.35 ± 0.35, 8.77 ± 0.34, and 9.77 ± 0.28 molar percent excess for 0, 2, and 7 h; Insulin group: 9.10 ± 0.32, 10.22 ± 0.61, and 11.07 ± 0.65 molar percent excess at the corresponding times). This significant increase (P < 0.05) in tissue fluid enrichment is a a potential limitation for calculation of FSR. We are examining the precursor-to-product relationship, and the mean tissue fluid values from three biopsy samples should truly represent the precursor enrichment from which the incorporation of phenylalanine occurs to the muscle protein. Moreover a similar directional changes in tissue fluid enrichment in two experimental groups, Saline and Insulin, occurred that support that the differences observed in FSR between the two study groups is biological. Moreover, using relative steady-state conditions of both arterial [13C]KIC or [13C]Leu enrichment as the precursor pools for calculation of FSRs, we have shown similar changes in FSR values as on using tissue fluid enrichment. It is possible that the increase in tissue fluid enrichment was due, at least in part, to an insulin-induced decline in protein breakdown in the insulin-infused group. However, a similar magnitude of changes in the two experimental groups does not support a major differential role for altered protein breakdown in the increase of tissue fluid enrichment. Importantly, mitochondrial, sarcoplasmic, and mixed muscle protein FSRs were calculated using arterial 13C enrichment of the leucine deamination product KIC. [13C]KIC plasma enrichment reached near-steady-state conditions before each biopsy (Fig. 4A), whereas plasma KIC concentration, similar to leucine, declined substantially at 2 h of insulin infusion without marked subsequent alterations (Fig. 4B). Changes in FSRs over time were superimposable to those calculated using muscle tissue fluid [13C]leucine enrichment for mitochondrial protein FSR (Saline group: 0.0816 ± 0.0076, 0.0932 ± 0.005, 0.0787 ± 0.0103%/h; Insulin group: 0.0698 ± 0.0052, 0.1289 ± 0.0122, 0.0501 ± 0.0084%/h for the 0–7, 0–2, and 2–7 h periods, respectively; P > 0.05 among groups for 0–7 h values, P < 0.05 for 0–2 and 2–7 h values), sarcoplasmic protein FSR (Saline group: 0.0527 ± 0.0049, 0.0606 ± 0.0075, 0.0507 ± 0.0048%/h; Insulin group: 0.0447 ± 0.0029, 0.0774 ± 0.0114, 0.0339 ± 0.0038%/h for 0–7, 0–2, and 2–7 h periods, respectively; P < 0.05 for 2–7 h values), and mixed muscle proteins (Saline group: 0.0601 ± 0.0048, 0.0691 ± 0.0101, 0.0577 ± 0.005%/h; Insulin group: 0.0540 ± 0.0045, 0.0840 ± 0.0103, 0.0447 ± 0.0039%/h for 0–7, 0–2, and 2–7 h periods, respectively).
Fig. 3.
Effects of sustained insulin or saline infusions (0–7 h or 0–2 and 2–7 h) on skeletal muscle fractional synthetic rate (FSR) of mitochondrial proteins. Values were calculated using leucine isotopic model as described in text. *P < 0.05, Insulin vs. Saline; $P < 0.05, 0–2 h vs. 2–7 h.
Fig. 4.
Time course of arterial plasma [13C]ketoisocaproic acid (13CKIC) enrichment (A) and plasma concentration (B) before each biopsy.
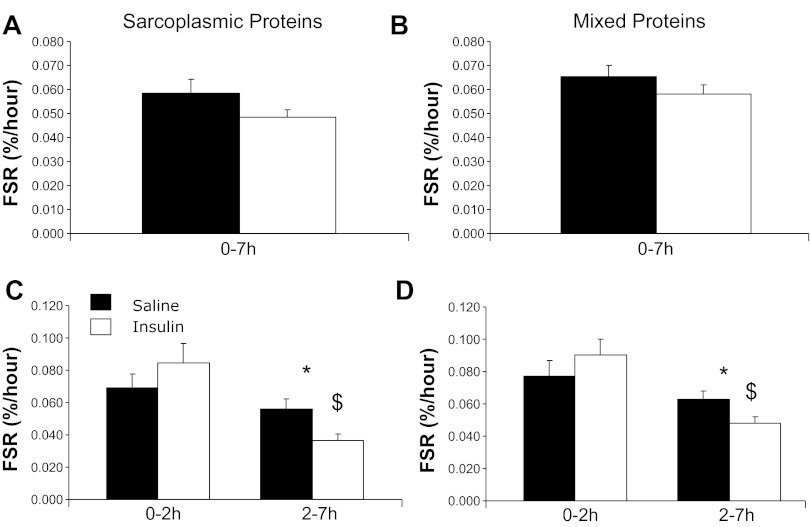
The pattern of FSR values over time and between groups observed for the sarcoplasmic and total mixed muscle protein fractions was similar to the mitochondrial FSR, as there were no differences between the groups when calculating the whole 7-h study period, whereas there was a nonstatistically significant elevation of FSR in the Insulin group at 2 h followed by a significantly greater decline from 2–7 h (Fig. 5).
Fig. 5.
Effects of sustained insulin or saline infusions (0–7 h or 0–2 and 2–7 h) on skeletal muscle FSR of sarcoplasmic (A and C) or mixed (B and D) muscle proteins. Values were calculated using leucine isotopic model as described in text. *P < 0.05, Insulin vs. Saline; $P < 0.05, 0–2 h vs. 2–7 h.
Insulin-modulated, AA-dependent anabolic signaling (Akt-mTOR-p70S6K-4EBP1).
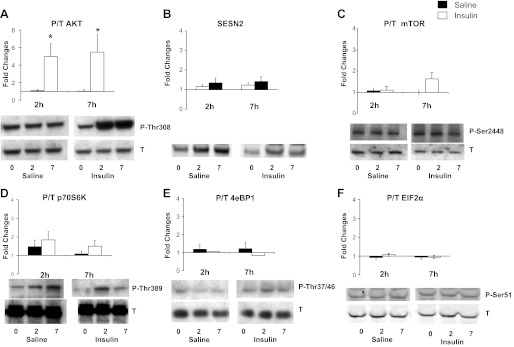
Insulin resulted in an approximately fivefold increase of Akt phosphorylation after both 2 and 7 h of infusion, with no change in the saline-infused group (P < 0.05 insulin vs. basal and saline; Fig. 6). However, no changes were observed in the insulin-infused group in activation of mTOR pathway, including SESN2 levels and phosphorylation of mTOR, p70S6K, and 4EBP1 at either measurement time. No difference in response was observed either compared with the saline-infused individuals. EIF2α phosphorylation remained unchanged during hyperinsulinemia under the current experimental conditions.
Fig. 6.
Effects of insulin or saline infusions on phosphorylation of skeletal muscle Akt (A), SESN2 (B), mTOR (C), p70 S6 kinase (D), 4EBP1 (E), EIF2α (F). See methods for definitions. Except for SESN2 (total protein/GAPDH), data are expressed as ratio of phosphorylated over total (P/T) protein and as fold changes at 2-h and 7-h infusions. *P < 0.05, vs. Basal (Insulin vs. Saline).
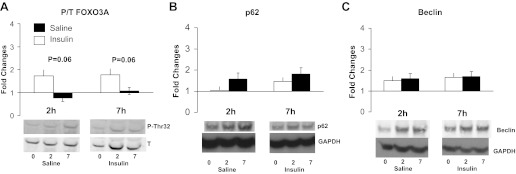
Finally, we also aimed at determining whether regulators of protein breakdown (24) and autophagy (12) were altered during hyperinsulinemia with lowered AA concentrations. Acute hyperinsulinemia and Akt activation were associated with a borderline suppression of FOXO3A phosphorylation, whereas no changes occurred in protein content of the autophagy markers beclin or p62 (Fig. 7).
Fig. 7.
Effects of insulin or saline infusions on phosphorylation of skeletal muscle FOXO3A (A), total p62 (B), or total beclin protein levels (C). Data for p62 and beclin are expressed as total protein over GAPDH protein levels; FOXO3A is expressed as ratio of phosphorylated over total protein, and all panels are expressed as fold changes at 2-h and 7-h infusions. *P < 0.05, vs. Basal (Insulin vs. Saline).
DISCUSSION
The present study has demonstrated that insulin infusion for 7 h in the absence of amino acid replacement failed to stimulate muscle mitochondrial protein synthesis enzyme activities and ATP production despite enhanced mRNA expression of PGC-1α, NRF1, and COX III subunit. Insulin also enhanced phosphorylation of Akt but did not change phosphorylation of regulators of protein translation, including mTOR, p70S6K, 4EBP1, and EIF2α.
Of interest, insulin and amino acids have been shown to enhance skeletal muscle mitochondrial function under different experimental conditions (6, 25). However, the in vivo interactions of these two important regulators of protein synthesis are limited. In a previous report, insulin infusion acutely stimulated mitochondrial transcript levels, mitochondrial protein synthesis, and ATP production in skeletal muscle from healthy young adults (25). Those stimulatory effects were observed in the presence of concomitant exogenous amino acid infusion to prevent insulin-induced hypoaminoacidemia (25). In contrast, in the current study, insulin infusion without exogenous amino acid replacement failed to enhance mitochondrial enzyme activities and ATP production. These combined observations support the idea that maintenance of amino acid availability is a key limiting factor for acute stimulatory effects of insulin on muscle mitochondrial function in vivo in humans. Elevations of plasma insulin concentration invariably occur following high-carbohydrate or mixed meals, and the current results have therefore relevant nutritional implications, since they support 1) the need for adequate amino acid supply to maintain adaptive insulin effects on muscle postprandial energy metabolism, and 2) the possibility to modulate mitochondrial responses to insulin and meal ingestion by modulating amino acid availability.
In our prior study that demonstrated an increase in mitochondrial protein synthesis during hyperinsulinemia with amino acid replacement (25), we also reported that there was a lack of stimulation of mitochondrial protein synthesis and mitochondrial function under the same conditions in people with type 2 diabetes (25). In the current study, sustained hyperinsulinemia with low amino acid availability did not increase mitochondrial protein synthesis or function in healthy nondiabetic people. The present results and previous observations (25) support a relevant role of mitochondrial protein renewal in the acute regulation of mitochondrial function by nutritional stimuli. This conclusion is also indirectly supported by preserved transcripts for mitochondrial genes, suggesting that pretranslational steps of gene expression do not limit mitochondrial responses and might indeed represent a target of insulin action independent of amino acid availability.
We investigated the Akt-mTOR signaling pathway as a mediator of the interaction between insulin and amino acids to stimulate skeletal muscle protein anabolism (8, 18, 28). Insulin infusion caused a marked sustained stimulation of Akt phosphorylation; yet its downstream stimulatory effects on mTOR phosphorylation did not occur, nor did we detect changes in SESN2, a negative upstream regulator of mTOR (3). It is possible that hypoaminoacidemia restricted the mTOR activation, as several studies have demonstrated that activation of the mTOR system requires combined and balanced effects of several essential and nonessential amino acids (17). The BCAAs (and leucine in particular) can modulate skeletal muscle mTOR signaling (13) and have been proposed to stimulate mixed muscle and mitochondrial protein synthesis (11, 28). In support, BCAA supplementation enhanced mitochondrial biogenesis in rodent muscle (6). Importantly, mTOR signaling has been reported to upregulate mitochondrial function and to positively modulate PGC-1α expression through mechanisms at least partly independent of the p70S6K-4EBP1 protein synthetic pathway (5, 24). In the current study, we also investigated the activation of the eIF2 complex that can stimulate protein synthesis in response to amino acids (10, 14). We did not detect changes to eIF2α phosphorylation, which is consistent with the lack of stimulation of other major amino acid-dependent protein-anabolic pathways.
Mixed skeletal muscle protein FSR was not changed during the 7-h study period and is in agreement with lack of stimulation of mTOR and EIF2 pathways. An additional intriguing finding was the apparent time-dependent pattern of response in protein FSR. The most likely explanation for early higher FSR is faster tracer incorporation into newly synthesized mitochondrial proteins stimulated by hyperinsulinemia before the substantial amino acid decline occurred. The prolonged decline in amino acid availability throughout the second part of the study likely prevented the maintenance of protein FSR, while hyperinsulinemia could have contributed to maintain phosphorylation levels of translation initiation regulators. Amino acid withdrawal activates autophagy (16, 19); yet the activation signal could have been overridden by the hyperinsulinemia conditions to cause no detectable change in static autophagy markers. Further studies are needed to directly test the interaction between insulin and changing amino acid concentrations on skeletal muscle protein synthesis and autophagy.
It should be pointed out that a modest increase in muscle mitochondrial ATP production has also been reported when insulin levels were increased from postabsorptive to high postprandial levels without exogenous amino acid infusion (1, 25). In those studies, endogenous insulin secretion was suppressed by somatostatin to achieve comparable plasma insulin in healthy and diabetic people (1, 25), and this difference likely contributed to the observed discrepancies. Growth hormone (GH) was also infused to prevent its expected fall during somatostatin suppression of pancreatic secretion (1, 25). We (22) recently demonstrated that GH acutely enhances muscle ATP production in humans, while a potential involvement of IGF-I was not directly demonstrated. Arterial plasma GH was measured in the current study, showing no statistically significant differences between saline and insulin infusions despite a trend toward higher concentration in insulin-treated participants at the end of the study (Saline: 1.59 ± 0.65, Insulin 4.79 ± 2.12, P = 0.14). Changes in circulating GH and indirectly in IGF-I were therefore unlikely to play a key role in changes in muscle mitochondrial protein synthesis and function in the current study.
In conclusion, the current findings demonstrate that, in the absence of exogenous amino acid supply, physiological hyperinsulinemia and decline in metabolites of amino acids fail to stimulate mitochondrial enzyme activities and ATP production. These alterations are associated with lack of activation of amino acid-dependent protein-anabolic pathways and mitochondrial protein synthesis. The data support novel interactions between insulin, systemic amino acid availability, and muscle mitochondrial function in vivo in humans, which could be at least partly mediated by modulation of mitochondrial protein synthesis.
GRANTS
This work was supported by National Institutes of Health Grants R01 DK-41973, UL1 TR-00135, and T32 DK-07352, and a David Murdock Dole Professorship.
DISCLOSURES
No conflicts of interest, financial or otherwise, are declared by the author(s).
AUTHOR CONTRIBUTIONS
Author contributions: R.B., K.R.S., J.M.C.-S., and K.S.N. conception and design of research; R.B., K.R.S., and J.M.C.-S. performed experiments; R.B., K.R.S., Y.A., J.M.C.-S., M.M.R., and K.S.N. analyzed data; R.B., Y.A., J.M.C.-S., and K.S.N. interpreted results of experiments; R.B., M.M.R., and K.S.N. prepared figures; R.B. and M.M.R. drafted manuscript; R.B., K.R.S., Y.A., J.M.C.-S., M.M.R., and K.S.N. edited and revised manuscript; R.B., M.M.R., and K.S.N. approved final version of manuscript.
ACKNOWLEDGMENTS
We are grateful to the staff at the Mayo Clinic GCRC for support in conducting the studies and to staff at the Mass Spectrometry Laboratory for skillfully performing isotopic analyses.
Current address for Rocco Barazzoni: Clinica Medica, Department of Medical, Surgical and Health Sciences, University of Trieste, Trieste, Italy.
REFERENCES
- 1. Asmann YW, Stump CS, Short KR, Coenen-Schimke JM, Guo Z, Bigelow M, Nair KS. Skeletal muscle mitochondrial functions, mitochondrial DNA copy numbers, and gene transcript profiles in type 2 diabetic and nondiabetic subjects at equal levels of low or high insulin and euglycemia. Diabetes 55: 3309–3319, 2006 [DOI] [PubMed] [Google Scholar]
- 2. Balagopal P, Ford GC, Ebenstein DB, Nadeau DA, Nair KS. Mass spectrometric methods for determination of [13C]leucine enrichment in human muscle protein. Anal Biochem 239: 77–85, 1996 [DOI] [PubMed] [Google Scholar]
- 3. Budanov AV, Karin M. p53 Target genes sestrin1 and sestrin2 connect genotoxic stress and mTOR signaling. Cell 134: 451–460, 2008 [DOI] [PMC free article] [PubMed] [Google Scholar]
- 4. Chow LS, Albright RC, Bigelow ML, Toffolo G, Cobelli C, Nair KS. Mechanism of insulin's anabolic effect on muscle: measurements of muscle protein synthesis and breakdown using aminoacyl-tRNA and other surrogate measures. Am J Physiol Endocrinol Metab 291: E729–E736, 2006 [DOI] [PubMed] [Google Scholar]
- 5. Cunningham JT, Rodgers JT, Arlow DH, Vazquez F, Mootha VK, Puigserver P. mTOR controls mitochondrial oxidative function through a YY1-PGC-1[agr] transcriptional complex. Nature 450: 736–740, 2007 [DOI] [PubMed] [Google Scholar]
- 6. D'Antona G, Ragni M, Cardile A, Tedesco L, Dossena M, Bruttini F, Caliaro F, Corsetti G, Bottinelli R, Carruba MO, Valerio A, Nisoli E. Branched-chain amino acid supplementation promotes survival and supports cardiac and skeletal muscle mitochondrial biogenesis in middle-aged mice. Cell Metab 12: 362–372, 2010 [DOI] [PubMed] [Google Scholar]
- 7. Denne SC, Liechty EA, Liu YM, Brechtel G, Baron AD. Proteolysis in skeletal muscle and whole body in response to euglycemic hyperinsulinemia in normal adults. Am J Physiol Endocrinol Metab 261: E809–E814, 1991 [DOI] [PubMed] [Google Scholar]
- 8. Fujita S, Rasmussen BB, Cadenas JG, Grady JJ, Volpi E. Effect of insulin on human skeletal muscle protein synthesis is modulated by insulin-induced changes in muscle blood flow and amino acid availability. Am J Physiol Endocrinol Metab 291: E745–E754, 2006 [DOI] [PMC free article] [PubMed] [Google Scholar]
- 9. Gelfand RA, Barrett EJ. Effect of physiologic hyperinsulinemia on skeletal muscle protein synthesis and breakdown in man. J Clin Invest 80: 1–6, 1987 [DOI] [PMC free article] [PubMed] [Google Scholar]
- 10. Gietzen DW, Ross CM, Hao S, Sharp JW. Phosphorylation of eIF2+: is involved in the signaling of indispensable amino acid deficiency in the anterior piriform cortex of the brain in rats. J Nutr 134: 717–723, 2004 [DOI] [PubMed] [Google Scholar]
- 11. Guillet C, Zangarelli A, Mishellany A, Rousset P, Sornet C, Dardevet D, Boirie Y. Mitochondrial and sarcoplasmic proteins, but not myosin heavy chain, are sensitive to leucine supplementation in old rat skeletal muscle. Exp Gerontol 39: 745–751, 2004 [DOI] [PubMed] [Google Scholar]
- 12. Hua Y, Zhang Y, Ceylan-Isik A, Wold L, Nunn J, Ren J. Chronic Akt activation accentuates aging-induced cardiac hypertrophy and myocardial contractile dysfunction: role of autophagy. Basic Res Cardiol 106: 1173–1191, 2011 [DOI] [PubMed] [Google Scholar]
- 13. Kimball SR, Jefferson LS. New functions for amino acids: effects on gene transcription and translation. Am J Clin Nutr 83: 500S–507S, 2006 [DOI] [PubMed] [Google Scholar]
- 14. Kobayashi H, Borsheim E, Anthony TG, Traber DL, Badalamenti J, Kimball SR, Jefferson LS, Wolfe RR. Reduced amino acid availability inhibits muscle protein synthesis and decreases activity of initiation factor eIF2B. Am J Physiol Endocrinol Metab 284: E488–E498, 2003 [DOI] [PubMed] [Google Scholar]
- 15. Lanza IR, Zhang S, Ward LE, Karakelides H, Raftery D, Nair KS. Quantitative metabolomics by H-NMR and LC-MS/MS confirms altered metabolic pathways in diabetes. PLoS ONE 5: e10538, 2010 [DOI] [PMC free article] [PubMed] [Google Scholar]
- 16. Mizushima N, Yamamoto A, Matsui M, Yoshimori T, Ohsumi Y. In vivo analysis of autophagy in response to nutrient starvation using transgenic mice expressing a fluorescent autophagosome marker. Mol Biol Cell 15: 1101–1111, 2004 [DOI] [PMC free article] [PubMed] [Google Scholar]
- 17. Nicklin P, Bergman P, Zhang B, Triantafellow E, Wang H, Nyfeler B, Yang H, Hild M, Kung C, Wilson C, Myer VE, MacKeigan JP, Porter JA, Wang YK, Cantley LC, Finan PM, Murphy LO. Bidirectional transport of amino acids regulates mtor and autophagy. Cell 136: 521–534, 2009 [DOI] [PMC free article] [PubMed] [Google Scholar]
- 18. Nygren J, Nair KS. Differential regulation of protein dynamics in splanchnic and skeletal muscle beds by insulin and amino acids in healthy human subjects. Diabetes 52: 1377–1385, 2003 [DOI] [PubMed] [Google Scholar]
- 19. Onodera J, Ohsumi Y. Autophagy is required for maintenance of amino acid levels and protein synthesis under nitrogen starvation. J Biol Chem 280: 31582–31586, 2005 [DOI] [PubMed] [Google Scholar]
- 20. Puigserver P, Spiegelman BM. Peroxisome proliferator-activated receptor-gamma coactivator 1 alpha (PGC-1 alpha): transcriptional coactivator and metabolic regulator. Endocr Rev 24: 78–90, 2003 [DOI] [PubMed] [Google Scholar]
- 21. Scott PH, Brunn GJ, Kohn AD, Roth RA, Lawrence JC. Evidence of insulin-stimulated phosphorylation and activation of the mammalian target of rapamycin mediated by a protein kinase B signaling pathway. Proc Natl Acad Sci USA 95: 7772–7777, 1998 [DOI] [PMC free article] [PubMed] [Google Scholar]
- 22. Short KR, Moller N, Bigelow ML, Coenen-Schimke J, Nair KS. Enhancement of muscle mitochondrial function by growth hormone. J Clin Endocrinol Metab 93: 597–604, 2008 [DOI] [PMC free article] [PubMed] [Google Scholar]
- 23. Southgate RJ, Bruce CR, Carey AL, Steinberg GR, Walder K, Monks R, Watt MJ, Hawley JA, Birnbaum MJ, Febbraio MA. PGC-1alpha gene expression is down-regulated by Akt-mediated phosphorylation and nuclear exclusion of Fox01 in insulin-stimulated skeletal muscle. FASEB J 19: 2072–2074, 2005 [DOI] [PubMed] [Google Scholar]
- 24. Stitt TN, Drujan D, Clarke BA, Panaro F, Timofeyva Y, Kline WO, Gonzalez M, Yancopoulos GD, Glass DJ. The IGF-1/PI3K/Akt pathway prevents expression of muscle atrophy-induced ubiquitin ligases by inhibiting FOXO transcription factors. Mol Cell 14: 395–403, 2004 [DOI] [PubMed] [Google Scholar]
- 25. Stump CS, Short KR, Bigelow ML, Schimke JC, Nair KS. Effect of insulin on human skeletal muscle mitochondrial ATP production, protein synthesis, and mRNA transcripts. Proc Natl Acad Sci USA 100: 7996–8001, 2003 [DOI] [PMC free article] [PubMed] [Google Scholar]
- 26. Toffolo G, Albright RA, Joyner MJ, Dietz NM, Cobelli C, Nair KS. Model to assess muscle protein turnover: domain of validity using amino acyl-tRNA vs. surrogate measures of precursor pool. Am J Physiol Endocrinol Metab 285: E1142–E1149, 2003 [DOI] [PubMed] [Google Scholar]
- 27. Walker DK, Dickinson JM, Timmerman KL, Drummond MJ, Reidy PT, Fry CS, Gundermann DM, Rasmussen BB. Exercise, amino acids, and aging in the control of human muscle protein synthesis. Med Sci Sports Exerc 43:, 2011 [DOI] [PMC free article] [PubMed] [Google Scholar]
- 28. Zanetti M, Barazzoni R, Kiwanuka E, Tessari P. Effects of branched-chain-enriched amino acids and insulin on forearm leucine kinetics. Clin Sci 97: 437–448, 1999 [PubMed] [Google Scholar]


