

Abstract
Cerebellar climbing fibers (CFs) provide powerful excitatory input to Purkinje cells (PCs), which represent the sole output of the cerebellar cortex. Recent discoveries suggest that CFs have information-rich signaling properties important for cerebellar function, beyond eliciting the well known all-or-none PC complex spike. CF morphology has not been quantitatively analyzed at the same level of detail as its biophysical properties. Because morphology can greatly influence function, including the capacity for information processing, it is important to understand CF branching structure in detail, as well as its variability across and within arbors. We have digitally reconstructed 68 rat CFs labeled using biotinylated dextran amine injected into the inferior olive and comprehensively quantified their morphology. CF structure was considerably diverse even within the same anatomical regions. Distinctly identifiable primary, tendril, and distal branches could be operationally differentiated by the relative size of the subtrees at their initial bifurcations. Additionally, primary branches were more directed toward the cortical surface and had fewer and less pronounced synaptic boutons, suggesting they prioritize efficient and reliable signal propagation. Tendril and distal branches were spatially segregated and bouton dense, indicating specialization in signal transmission. Furthermore, CFs systematically targeted molecular layer interneuron cell bodies, especially at terminal boutons, potentially instantiating feedforward inhibition on PCs. This study offers the most detailed and comprehensive characterization of CF morphology to date. The reconstruction files and metadata are publicly distributed at NeuroMorpho.org.
Introduction
Climbing fibers (CFs), the axon terminals of inferior olivary neurons, arborize in the molecular layer of the cerebellar cortex, where they each wrap around a single Purkinje cell (PC). CFs exert powerful excitation onto PCs, the sole output of the cerebellar cortex. Moreover, they can evoke plasticity in parallel fiber synapses (Ito et al., 1982), the only other excitatory input to PCs. CFs can therefore influence all signals downstream from the cerebellar cortex.
The role of CFs in cerebellar function is intensely debated. Recent experiments revealed that CF signal variation carries information, beyond all-or-none signaling, that conveys timing and provides a sophisticated mechanism for plasticity (Maruta et al., 2007; Mathy et al., 2009). CF morphology provides rich empirical evidence to be analyzed across populations as well as branch by branch within the individual tree. Size and branching complexity distinguish neuron types and often reflect functional adaptations. Axonal branch topology and bouton distributions define synaptic connectivity and affect spike propagation (Manor et al., 1991; Raastad and Shepherd, 2003; Sasaki et al., 2012).
Previous quantification of CF morphology has been limited, as either CFs were not digitally reconstructed (Sugihara et al., 1999; Nishiyama et al., 2007; Cesa et al., 2011) or primarily served as comparative controls to experimental manipulation (Rossi et al., 1993; Bravin et al., 1999). CFs within the lobule sulcus extend less toward the cortical surface than CFs in the bank or gyrus (Nishiyama and Linden, 2004), but no other morphologically distinct CF subtypes are known. In contrast, there are regional differences in compartmentalization (Sugihara et al., 2001) and molecular expression (Hawkes and Leclerc, 1987; Sawada et al., 2008). CFs also consist of recognizably different branch types, including thick primary and beaded-thread-like tendril branches (Ramon y Cajal, 1909–1911; Sugihara et al., 1999). These branches may be functionally distinct, but their morphologies have yet to be quantitatively differentiated.
Molecular layer interneurons play an important role in cerebellar circuit dynamics. CFs can evoke long-term depression in interneurons, influencing PC inhibition (Mittmann and Häusser, 2007). Additionally, interneurons can modify CF-induced calcium dynamics in PCs (Callaway et al., 1995), providing a potential mechanism for dendritic compartmentalization of the CF signal. CFs are also believed to contact interneuron somata (Scheibel and Scheibel, 1954; Palay and Chan-Palay, 1974; Sugihara et al., 1999), but this aspect has not yet been quantified.
Here we have digitally reconstructed 68 rat CFs labeled with biotinylated dextran amine to fully characterize their morphology at the tree, branch, and bouton levels. We demonstrate substantial diversity that cannot be attributed to differences across anatomical regions or to distinct CF subclasses. Moreover, we introduce a simple morphometric definition that quantitatively distinguishes different branch types including primary and tendril, revealing their distinct spatial patterns. Furthermore, we report significant differences in the density, structure, and distribution of terminal and en passant boutons across CFs and branch types. Finally, we show that CFs overlap with interneuron somata beyond chance expectation, suggesting targeted circuit formation. Altogether, these results provide a comprehensive structural foundation to understand CF function.
Materials and Methods
Histological procedures.
Surgical and labeling procedures were described previously (Sugihara et al., 1999, 2000). The experimental protocols were approved by the Institutional Animal Care and Use Committee of Tokyo Medical and Dental University. A 5-month-old Long–Evans male rat weighing 320 g was anesthetized with an intraperitoneal injection of ketamine (42 mg) and xylazine (2.5 mg) and placed in a stereotaxic apparatus with the head 45° nose down. The foramen magnum was opened, and the inferior olive was approached with glass injection pipette from the dorsal surface of the caudal medulla. Biotinylated dextran amine (BDA; catalog #D-1956, 10,000 MW; Invitrogen) was dissolved in saline at a concentration of 10%. A glass micropipette (tip diameter, 4 μm) filled with this solution was inserted into the right inferior olive, and pressure injections (0.05 μl) were made in three points. The CFs described in this study were labeled by an injection centered in the medial area of the caudal part of the medial accessory olive (subnucleus c; Sugihara and Shinoda, 2004).
After a survival period of 8 d, the animal was deeply anesthetized with ketamine (150 mg/kg) and xylazine (12 mg/kg), and perfused through the ascending aorta. Chilled perfusate (400 ml, 4°C) containing 0.8% NaCl, 0.8% sucrose, and 0.4% glucose in 0.05 m phosphate buffer, pH 7.4, was followed by cold fixative (200 ml, 4°C) containing 5% paraformaldehyde, 1% picric acid, 0.23% NaOH, and 4% sucrose in 0.05 m sodium phosphate buffer (pH 7.4, ∼4°C, ∼200 ml) delivered over 30 min. The cerebellum and medulla oblongata were dissected and kept in the same fixative overnight at 4°C, then in 30% sucrose plus phosphate buffer saline (PBS; 0.01 m, pH 7.4), for 2 d. The brain was embedded in 10% gelatin containing 20% sucrose plus PBS at 31°C. The gelatin block was hardened in the fixative to which 30% sucrose was added for 2 d (4°C). Parasagittal sections of 50 μm thickness were then cut with a freezing microtome. Serial sections were collected in multicellular containers with PBS, incubated with biotinylated horseradish peroxidase-avidin complex (50 μl in 10 ml PBS plus 0.15% Triton X-100) (Elite ABC kit KT-6100, Vector Laboratories) for 48 h. The sections were then rinsed in Tris buffer (50 mm, pH 7.4) and incubated with cobalt acetate (0.5%) dissolved in Tris buffer for 10 min. Sections were rinsed with Tris buffer for 1 h and then with PBS for 15 min. BDA was then visualized by incubating the sections for 60 min in a solution containing diaminobenzidine (0.5 mg/ml), glucose oxidase (Itoh et al., 1979; 0.01 mg/ml; G-6125, Sigma-Aldrich), ammonium chloride (4 mg/ml), and β-d(+)-glucose (1 mg/ml) in PBS followed by PBS washes. After counterstaining with thionine, which nonselectively stains chromatin in cell bodies, the sections were mounted on chrome alum-gelatinized slides, dried overnight, and coverslipped with Permount. Each of the 12 sections contains 6–9 completely labeled CFs all within lobules 6 and 7. Figure 1A–D shows representative histological material. The sampled volume encompasses ∼15% of the vermis or 6% of the total cerebellar cortex.
Figure 1.

CF histology. A–D, Rat cerebellar climbing fibers anterogradely labeled with BDA. Yellow boxes indicate regions magnified in subsequent panel. Somata are counterstained with thionine (blue). E, CF digital reconstruction and branch types: primary (purple), tendril (red), retrograde (cyan), and distal (green). Radius thickened 1.5× for clearer visualization.
Image acquisition and digital reconstruction.
The approximately planar span and sagittal orientation of adult CFs increases the probability of finding complete trees entirely confined within an individual slice. Only and all CFs with clear and complete labeling within a single tissue section were selected for reconstruction. Every selected CF was visually checked for structural truncation, including searching adjacent slices to verify that no branches were lost due to sectioning. Each CF was captured as a stack of images under Köhler illumination using an Olympus AX70 microscope equipped with a motorized stage and Optronics Microfire mounted digital camera. Images were acquired every 0.33 μm in depth with a 100× (NA = 1.3) oil-immersion objective and an additional 200% electronic zoom factor. Image stacks were blindly deconvolved with AutoDeblur (AutoQuant Imaging) and CFs were digitally traced with Neurolucida (MBF Bioscience). Variations of this method were also tested to seek an optimal procedure. A small number of CFs were reconstructed with Neuromantic (Myatt et al., 2012; http://www.reading.ac.uk/neuromantic) or with Neuron_Morpho (Brown et al., 2005) or else traced directly from the slide through the camera live feed rather than from the image stack. Similar to previous findings (Brown et al., 2005; Anderson et al., 2010), each of these alternatives produced equivalent reconstructions, so all CFs were pooled together in a collective sample (N = 68).
After reconstruction, CFs were semi-automatically checked for tracing errors such as 0 μm diameter points (Halavi et al., 2008; http://neuromorpho.org/neuroMorpho/StdSwc1.21.jsp). Verified errors were then fixed before morphological analysis. A sample of CF reconstructions (N = 35) was visually inspected for accuracy by carefully comparing and overlaying the digital morphology with the live microscope images. Resultant modifications were negligible and did not alter results, suggesting high precision levels. Digital reconstructions consisted of ASCII files representing each tracing point (∼2500 per CF) with an identity number, a “type” tag (axon, en passant bouton, etc., see below), the X, Y, and Z position, local radius, and the identity of the preceding tracing point (“parent”) in the path to the CF origin (Ascoli et al., 2001). Every point can be viewed as the end of a cylinder or truncated cone, called a “compartment” (see also diademchallenge.org/faq.html). Each compartment has a unique parent (except the origin, which has none), and can have 0, 1, or 2 daughters, respectively, corresponding to a terminal tip, continuation of the branch, or bifurcation. A series of compartments between two bifurcations or between a bifurcation and a termination is called a “branch” (internal or terminal, respectively). Figure 1E shows a representative complete reconstruction, and Figure 2 displays all reconstructed CFs.
Figure 2.

Collage of all 68 CF digital reconstructions. Radius thickened 1.5× for clearer visualization.
To correct for tissue shrinkage, each of the 12 slices (nominally sectioned at 50 μm) was sampled in at least three locations for actual mounted thickness, yielding a measure of 14 ± 1 μm across the entire sample. All reconstruction z values were increased by the same constant factor of 3.5 (≈50/14), since variability was similar within and between sections.
Bouton and interneuron analysis.
Boutons were identified based on large and abrupt diameter increase as well as increased intensity and range of focus relative to adjacent regions along the branch (Shepherd et al., 2002). Both a conservative and a liberal choice of thresholds for diameter and intensity change were tried. The former method resulted in counting 77 ± 9.0% of the boutons labeled in the latter. However, all relative differences detected by our analyses were preserved, and all conclusions reached in this study remain consistent across the two methods. The liberal criterion resulted in a total bouton count similar to past studies (Rossi et al., 1993; Sugihara et al., 1999; see Results).
We define interbouton distance (IBD) as the axonal length from a bouton to the previous bouton toward the CF origin along the branch path, similar to previous measures of dendritic spine distances (Konur et al., 2003). Distances between boutons that crossed branch types (e.g., primary and tendril, see below) were not included in the results presented here. However, we verified that including these distances in the analysis did not alter any of the conclusions. Two IBDs were measured: between bouton centers (IBD_center) and from one bouton end to the next bouton beginning (IBD_edge). To test whether boutons were regularly spaced, two surrogate datasets were generated by randomly shuffling the bouton positions along the tree. In the first surrogate dataset, boutons were randomized as points (i.e., without regard to bouton length), and IBD_center was measured. In the second, randomization was performed taking into account bouton lengths so as to avoid their spatial overlap, and both IBD_center and IBD_edge were used as IBDs.
Boutons overlapping with somata of molecular layer interneurons in the image plane within reciprocal focal depth of 1 μm were counted as potential contacts. The 1 μm threshold accounts for light diffraction as well as extrasynaptic glutamate transmission (Szapiro and Barbour, 2007; Okubo and Iino, 2011). To provide a control for potential contacts with interneuron cell bodies, boutons were virtually detached from the CF tree and their positions randomly shuffled in the molecular layer within the 3D bounding box of the given CF, without allowing multiple boutons to spatially overlap. Retrograde boutons, those located within the PC layer (Scheibel and Scheibel, 1954; Palay and Chan-Palay, 1974; Sugihara et al., 1999), were accordingly omitted from this particular analysis.
Synaptic contact of CF boutons to NG2-expressing cells has been reported (Lin et al., 2005). In the present study, we cannot distinguish CF boutons that make synaptic contact to NG2-expressing cells because these glial components were not specifically labeled in our preparation. Therefore, some of the cells that we counted as molecular layer interneurons may actually consist of NG2-expressing cells. However, the fraction of counted cell bodies corresponding to glial cells is likely very small, because NG2-expressing cells are much less numerous than molecular layer interneurons (Lin et al., 2005, their Fig. S1), and CF boutons make contact onto glial processes, not cell bodies (Lin et al., 2005).
Comparison of CFs to other neuron types.
Several digital reconstructions of neuronal morphology were downloaded from NeuroMorpho.org (version 5.3) for comparative analyses. All datasets from rodent brain were considered potentially relevant if they consisted of five or more cells with substantial axon tracing. A total of 218 axons over 11 datasets met these criteria: 51 rat temporal sulcus neurons (Helmstaedter et al., 2009), 7 rat prefrontal cortex neurogliaform cells (Povysheva et al., 2007), 54 basket, 30 Martinotti, 15 bitufted, 6 bipolar, and 5 double bouquet cells, all from rat somatosensory cortex (Wang et al., 2002), and 6 rat somatosensory spiny stellate cells (Staiger et al., 2004), 13 rat hippocampal dentate gyrus interneurons (Mott et al., 1997), 13 rat hippocampal CA3b interneurons (Ascoli et al., 2009), and 18 mouse visual cortical cells (Dumitriu et al., 2007). For CF comparison, the average of each morphometric was first computed within every dataset, and the mean and SD of these averages across datasets (N = 11) were used for a one-sample t test against the CF average of the same morphometric.
The dendritic trees of 10 PCs from four studies were also downloaded from NeuroMorpho.org (Rapp et al., 1994; Roth and Häusser, 2001; Vetter et al., 2001; Martone et al., 2003). In these reconstructions, dendrites were considered CF targets if their diameter was 1.7 times larger than the mean, consistent with anatomical measurements distinguishing smooth from spiny Purkinje dendrites (Larramendi and Victor, 1967). With this criterion, the height extent of “smooth” (CF-targeted) dendrites in the 10 PCs was 84 ± 11% of the total dendritic tree, similar to the experimentally reported value of 86% (Ichikawa et al., 2002).
Statistical analysis and glossary of morphometrics.
Morphometric analysis was performed using the freeware program L-Measure (Scorcioni et al., 2008; http://krasnow1.gmu.edu/cn3), the commercial Neurolucida Explorer (MBF Bioscience), and Microsoft Excel 2007. Excel Solver 2007 was used for linear discriminant analysis of bifurcation types, performing 1000 iterations for parameter optimization. For analysis consistency, the origin of each CF was always considered as the first bifurcation. Unless stated otherwise, values are reported as mean ± SD and two-tailed t test was performed for significance (one- or two-sample, paired or unpaired, depending on analysis). The conventional power (p < 0.05) was used after correcting for multiple comparisons as appropriate, namely with Bonferroni's method for sets of independent parameters (Bonferroni, 1936) and by false discovery rate for partially interdependent measures (Benjamini and Hochberg, 1995). Kolmogorov–Smirnov test was used to test whether data could be rejected as being normally distributed. All linear correlation values (R) were measured using Pearson's correlation coefficient. To test if CF subtypes could be identified by combinations of morphological properties, we used principal component and cluster analyses, following previously established protocols for neuron morphological classification (Tsiola et al., 2003; McGarry et al., 2010). Silhouette width (Rousseeuw, 1987) was used to quantify degree of clustering. Significant clustering was based on comparison to randomly shuffled principal components (N = 5 repeated trials, two-tailed Wilcoxon signed-rank test).
A proportion of reconstructed CFs was randomly sampled to measure the number of bouton/interneuron soma overlaps and interneuron density across the molecular layer, as well as the proportion of retrograde boutons overlapping with Purkinje somata. Running mean and SD were logged as sample size increased. The sample size was deemed sufficient when three consecutive means and SDs were within 5% of each other.
The morphological measures are defined as the following. Branch order is the number of bifurcations between a given branch and the CF origin. The branch path length, sum of all compartment lengths that make up a branch, is defined as the region between two bifurcations or a bifurcation and a termination. The sum of all branch path lengths for a CF equals its tree length. Branch path tortuosity is the difference between Euclidean and path distance (see below) from the beginning to the end of a branch, normalized by path distance (1 − Euclidean Distance/Path Distance). Branching angle is the angle between a bifurcation and the end points of its daughter branches. Caulescence is the prominence of the main path, i.e., the path across bifurcations from the CF origin to a termination that always leads to the greatest length at each bifurcation (Brown et al., 2008). It is measured by ∑ |l − r|/∑ (l + r), where l and r are the total lengths of daughter subtrees from their mutual bifurcation to their terminations, and the sum is taken over all bifurcations of the main path. The daughter diameter ratio is the ratio of the diameter of the larger to the smaller daughter branch originating from the same bifurcation. Diameter is measured at the first compartment of each branch. The daughter/parent diameter ratio is the ratio of the diameter of the larger daughter to its parent branch, and diameter is measured at the first compartment of the daughter and the last compartment of the parent branch. Fractal dimension is the space-filling ability of the tree, also known as Hausdorff dimension, measured with the box-counting method (Samsonovich and Ascoli, 2006). The returned value is between 1 and 3, where 1 means the structure does not fill space more than a straight line, and 3 means it fills space as well as a 3D solid. Height, width, and depth are Euclidean dimensions containing 95% of the CF tree along its three principal components ordered from largest to smallest, respectively. Interneuron density is the number of interneuron somata per μm3 scaled by a convenience factor of 1000. Path distance is the distance along the path from the CF origin. This metric is termed “distance” to differentiate it from size-based metrics such as tree length and branch path length. Polar direction is the weighted average of the arbor orientation. The sine of each of 18 20° bins is multiplied by the proportion of CF length it contains, then averaged across bins. Polar magnitude is the weighted average of the orientation absolute extent. The cosine of each of the 18 bins is multiplied by the proportion of CF length it contains, then averaged across bins. Roundness is the ratio between the surface area of the soma and the spherical area corresponding to its maximum diameter. The returned value is between 0 and 1, where 1 corresponds to perfectly circular cross sections. Terminal degree is the number of terminal tips in a subtree. Tree length, surface area, and volume are the summed lengths, surface areas, and volumes over all compartments for the entire tree. Vertex ratio is the ratio between the numbers of bifurcations with two versus one immediately terminating daughter branches. Values >1 or <0.5 are characteristic of symmetric or asymmetric trees, respectively. Intermediate values are indicative of random trees and can shed light on the growth process (Berry and Flinn, 1984). Wiring density is the ratio between tree length and total invaded volume (the product of height, width, and depth), scaled by a convenience factor of 1000.
Availability of additional histological material.
This work opens the possibility for many future animal model or developmental comparisons, both by providing necessary baseline data (which are also useful to generate quantitative hypotheses) and by elucidating the morphologically relevant features (thus aiding future research designs). We already have available preparations of similarly labeled CFs in two animal models at the moment: 3-aminopyridine-treated rats (denervation–reinnervation model), whose CFs show significant growth and sprouting (Aoki and Sugihara, 2012), and x-ray-irradiated rats (Sugihara et al., 2000). While digitally reconstructing these morphologies is beyond the scope of the present report, we are eager to send the histological slides to anyone willing to analyze them upon request.
Results
CF morphometry reveals high wiring density, branching asymmetry, and diversity
The height, width, and depth of CFs were small given the number of branches and length (Table 1). This was captured by their considerable wiring density, on average 26 times higher than for other axon types (see Materials and Methods), suggesting that each individual CF is tightly packed within its target field. In contrast, fractal dimension, which might be expected to increase with wiring density as more space is filled, was similar to other axon types despite their lower wiring density. Thus, CFs are not spatially spread out, but instead cluster heterogeneously within the volume they invade.
Table 1.
CF tree (top) morphological properties
| Tree level metrics (N = 68) | Mean ± SD (range) | CV |
|---|---|---|
| Height (μm) | 155 ± 35 (90–242) | 0.23 |
| Width (μm) | 79 ± 26 (56–164) | 0.33 |
| Depth (μm) | 12 ± 7.3 (4.5–50) | 0.60 |
| Number of branches | 328 ± 138 (117–675) | 0.42 |
| Tree length (μm) | 2318 ± 680 (1104–4149) | 0.29 |
| Tree surface area (μm2) | 3737 ± 1430 (1154–9263) | 0.38 |
| Tree volume (μm3) | 703 ± 456 (124–2597) | 0.65 |
| Wiring density (μm−2) | 25 ± 21 (3.1–103) | 0.82 |
| Fractal dimension | 1.23 ± 0.06 (1.09–1.43) | 0.048 |
| Max branch order | 37 ± 11 (15–65) | 0.31 |
| Vertex ratio | 0.48 ± 0.12 (0.29–1.04) | 0.26 |
| Caulescence | 0.86 ± 0.05 (0.59–0.94) | 0.063 |
The vertex ratio revealed low branching symmetry resulting from a large proportion of CF bifurcations with a terminating branch stemming off a continuing tree rather than bifurcations splitting into two terminating branches or into two continuing subtrees. Indeed the CF average vertex ratio (Table 1) was significantly lower than for other axon types (0.65 ± 0.11, p < 0.001). Additionally, caulescence, measuring the prominence of the main path within the arbor (Brown et al., 2008), was significantly larger for CFs (Table 1) than for other axon types (0.61 ± 0.10, p < 10−4). Low vertex ratio and high caulescence provide quantitative measures that extend previous qualitative descriptions of CF as “primary” stalks giving rise to collateral “tendril” offshoots (Palay and Chan Palay, 1974; Sugihara et al., 1999).
The cerebellum is regarded as structurally modular, with a repeating microcircuit (Eccles et al., 1967; Ito, 1984) that performs common computational operations across regions (Raymond et al., 1996; Wolpert et al., 1998). Given the relationship between morphology and connectivity, and the one-to-one mapping between CFs and PCs, one might assume CF morphology to be stereotypical as well, simplistically reducing the CF role as a single large distributed synapse on the PC (Llinás and Nicholson, 1976). On the contrary, the statistical variability of numerous metrics (Tables 1 and 2) demonstrates considerable morphological diversity. Even measures with relatively smaller coefficients of variation (CVs) showed wide value ranges. To appreciate the potential biological implication of this observation, CFs can again be compared with other axon types (see Materials and Methods). Although other axons project to numerous cells and presumably have complex functional states in relation to their larger networks, their morphological variability was comparable or smaller than that of CFs in almost all morphological properties reported in Tables 1 and 2 (data not shown). CF variability was also similar to that of 10 PC dendrites, even if these were pooled from different rats, mice, and guinea pigs, while CFs were all from a single subject. The only morphometric with clearly smaller variability in CFs was caulescence, suggesting that CFs systematically exhibit a prominent main path.
Table 2.
CF tree branch (bottom) morphological properties
| Branch level metrics (N > 10,000) | Mean ± SD (range 2.5–97.5%) | CV |
|---|---|---|
| Branch path length (μm) | 7.1 ± 7.6 (0.51–28) | 1.1 |
| Branch path tortuosity | 0.19 ± 0.17 (0–0.59) | 0.88 |
| Branching angle (°) | 87 ± 42 (13–165) | 0.48 |
| Daughter diameter ratio | 1.9 ± 1.1 (1.0–4.8) | 0.57 |
| Daughter/parent diameter ratio | 0.70 ± 0.42 (0.21–1.7) | 0.60 |
CF arbors have preferential orientation and bimodal distribution
Morphometric distributions across tree location and distance relate to synaptic and growth patterns. The polar histogram of tree length indicates preferential CF growth toward the cortical surface (Fig. 3A,B). Polar direction (−2 ± 14°) was not significantly different from perpendicular to the PC layer, and was quite invariant given a maximum potential spread of 360°. Correspondingly, the polar magnitude (Fig. 3B, blue arrow) was significantly positive (0.37 ± 0.09, p < 10−4, one-sample t test, N = 68). For context, the minimum and maximum values of this measure are −1 (the whole tree exactly aligned away from the cortical surface) and 1 (all toward the cortical surface), with 0 being nonpolar or symmetrically polar. Therefore, CFs are significantly polar. This contrasts with their absolute orientation, which was nearly isotropic due to pronounced cortical foliation (data not shown).
Figure 3.

Morphometric distributions across distance. A, Representative CF orientation toward the cortical surface, through the molecular layer (M-L; red) and perpendicular to the PC layer (PC-L; yellow). B, Polar histogram of the fraction of CF length in each angular bin. The inner circle represents uniform spatial distribution. The second and third concentric circles demark fractional lengths twice and three times the bin average, respectively. Black and gray lines are mean and mean + SD of fractional length across CFs. For example, length in the 0° bin is on average more than twice as large as in the 60° bin. The vertical blue tick on the outer circle near the 0° label and the blue dashed lines represent, respectively, mean and SDs of polar direction across CFs. The polar magnitude mean and SD (blue and dotted arrows, respectively) are 0.37 ± 0.09, where equal directionality across all bins would yield a value of 0 (at the circle center), and all length being within the 0° bin would yield a value of 1 (outermost concentric circle). C, Variable but consistently bimodal length distribution across path distance for four representative CFs (different colors). The average across all CFs (thick gray) is unimodal. D, Constant branch path length (N = 22,254) and bifurcation angle (N = 11,127) across path distance. Internal branches are significantly longer than terminal branches at path distances between 75 and 275 μm. Error bars indicate SDs. The number of branches ranges by bin from 207 to 2197. Solid and dashed lines represent grand mean and SD, respectively.
Even though CFs were spatially directed, their length distribution across path distance toward the cortical surface was considerably heterogeneous and generally bimodal (Fig. 3C). To quantify the bimodal distribution, the length of each CF as a function of path distance was fitted by least-square error with the sum of two Gaussians. The average coefficient of determination R2 for the bimodal best fits was 0.77 ± 0.09, indicating that a mix of two Gaussians on average explained nearly 80% of the dependence of CF length on path distance. The average path distances for the two modes were 109 ± 40 and 257 ± 43 μm (N = 68), respectively. This suggests location variability within each mode, but the large separation between modes confirmed CF bimodality overall. The first mode (closer to the origin) was wider (SDs of first and second modes, respectively, 62 ± 26 and 43 ± 20 μm, N = 68) and contributed 54 ± 24% of the Gaussian mix, where 50% would be equal mode proportions and 0% or 100% would indicate unimodality. This bimodal length distribution may relate to functionally and morphologically distinct subtrees within the same CF (see below, Morphological analysis of bifurcation and branch types) (see Fig. 5F). Interestingly, the length distribution for all CFs averaged together (Fig. 3C, gray line) concealed individual CF bimodality, and the best fit for this overall distribution was unimodal.
Figure 5.
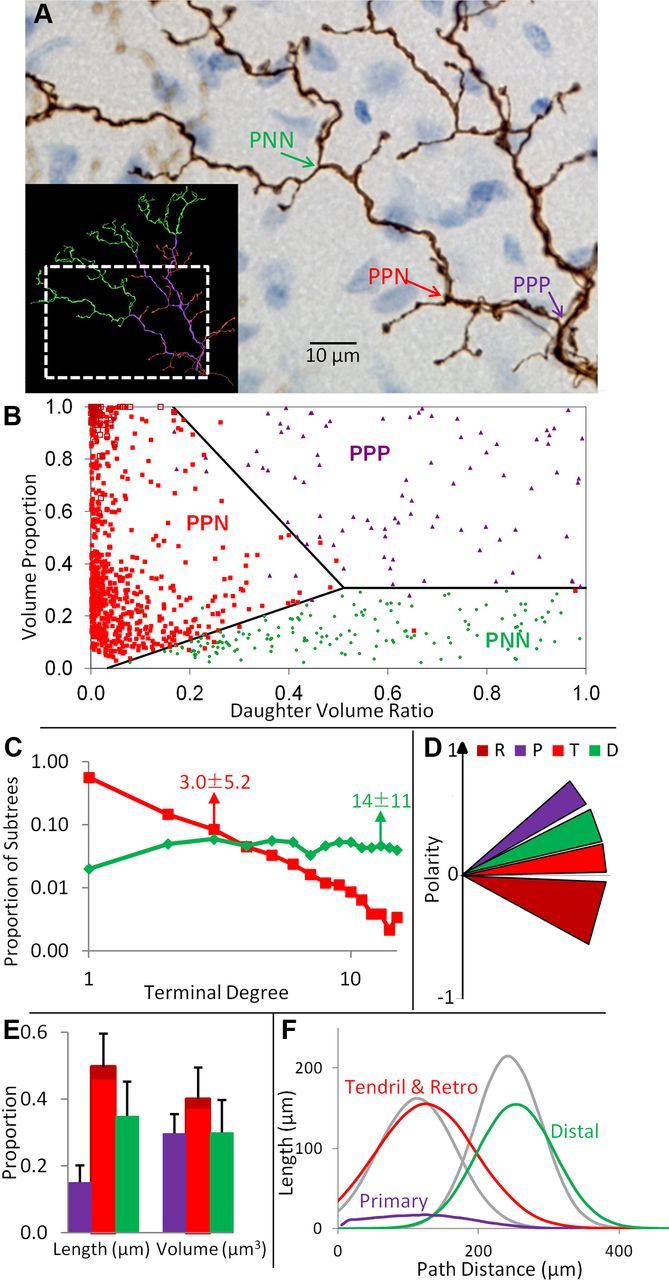
Operational definition and analysis of branch types. A, Representative examples of the three bifurcation types in primary stalks: splitting into two primary daughters (PPP), into one primary and one nonprimary (PPN), and into two nonprimary daughters (PNN). B, Optimal linear separators for bifurcation types (sample sizes: PPN, 763; PPP, 88; PNN, 155). Functions defining separators were as follows, where DVR is the daughter volume ratio, VP is the volumetric proportion, the ∩ symbol indicates AND Boolean logic, and y is the classification for bifurcation i: yi = [(PPP = (VPi > 0.31) ∩ (VPi > −2.01 × DVRi + 1.33); PNN = (VPi < 0.31) ∩ (VPi < −2.01 × DVRi + 1.33); PPN = (DVRi < 0.51) ∩ (−0.65 × DVRi − 0.02 < VPi < −2.01 × DVRi + 1.3)]. C, Log-log frequency distributions of terminal degree (number of terminations) of nonprimary subtrees stemming from PPN (red) and PNN (green) bifurcations. Arrows point to means ± SDs. D, All branch types differ in polarity relative to the vector from the CF origin to the primary tree center of mass (y-axis), whereas values of 1, 0, and −1 would, respectively, indicate directions parallel, orthogonal, and antiparallel to the primary vector. The width of each wedge indicates SD. R, retrograde; P, primary; T, tendril; D, distal. E, Relative branch type contributions to CF size. Error bars indicate SDs (N = 68). F, Tendril and retrograde branches combined and distal branches largely underlie CF bimodality (compare Fig. 3C). The branch type length distributions across path distance are compared with the two modes extracted from the whole trees (gray lines).
Branch path length did not change systematically across path distance (Fig. 3D, top), with large and fairly constant variability. These characteristics applied similarly for individual CFs (data not shown) and when all branches were pooled together across trees. Internal branches were generally longer than terminal branches across path distance. The large CV for scalar branch path length (1.0 and 1.2 for internal and terminal, respectively; Table 2) suggests that branches are emitted irregularly. The distribution of branching angles (Fig. 3D, bottom), and thus CF polarity, was also constant across distance, both in individual CFs (data not shown) and at the population level. CF distributions of several other metrics (Table 2) were also analyzed as a function of path distance, both absolute and normalized by the maximum distance for each CF. As for branch path length and branching angle, the variability of these other metrics at different distances was equal to or greater than when pooling all branches together from the entire tree. Therefore, CF variability is not explained by systematic morphological differences across distance.
CF morphology is largely independent of regional location
To check if CF morphology varied by anatomical location, we measured a comprehensive battery of (25) morphometrics from several pairwise regional groups; namely, right–left, medial–lateral, lobules 6–7, rostral–caudal within lobules, and sulcus-bank/gyrus (Fig. 4A). No significant differences were found for any comparison (Fig. 4B), except for CFs located in the sulcus, which had lower polar magnitude than those located in the bank or gyrus. This result quantitatively extends previous observations that CFs in the sulcus distributed their extent further away from the cortical surface compared with CFs along the bank or gyrus (Nishiyama and Linden, 2004). No other morphometrics differed between these two groups, including polar direction, which indicated direction of growth similarly perpendicular to the PC layer (0 ± 5° and −3 ± 14° for sulcus and bank/gyrus, respectively). However, the small sample size for CFs in the sulcus warrants cautious interpretation. For all regions and morphometrics, CVs were generally as high as or higher than those provided in Tables 1 and 2.
Figure 4.

Morphological comparison across anatomical subregions. A, Gray cerebellar surface renderings (modified from http://www.nesys.uio.no/Database/5-Precerebellar_atlas) with depictions of analyzed regions and corresponding CF grouping symbols. Left and right groups are divided at the vermal midline. Medial and lateral groups, respectively, include CFs less than or >150 μm away from the vermal midline from either direction. B, Pairwise comparisons of regional groups. No significant differences are found between regional groups except for lower polar magnitude of sulcus CFs than for bank/gyrus CFs. Error bars indicate SDs; gray shading signifies population SD around the mean.
To test for distinct morphological subtypes other than by regional location, we analyzed the frequency distribution of all individual morphometrics. None appeared bimodal or multimodal (data not shown), nor were they significantly different from Gaussian (Kolmogorov–Smirnov, two-tailed). Principal component and cluster analyses were performed next to seek multivariate morphometric subgroups (Dumitriu et al., 2007). Clusters of the first six principal components (accounting for >95% of overall variance) were compared with five samples obtained by randomly shuffling principal component values across CFs. The actual data did not appear any more clustered than the shuffled controls, and their average silhouette width was not significantly different (0.13 vs 0.13 ± 0.02, respectively, for actual vs randomized data, N = 5, p > 0.9). Finally, no individual principal component could be rejected from being normally distributed across CFs (Kolmogorov–Smirnov, two-tailed). Altogether these results suggest that this CF population, beyond one regional difference for a single morphological property, does not consist of morphologically distinct subtypes. Instead, morphological diversity appears as an inherent CF property within and across regional groupings.
Morphological analysis of bifurcation and branch types
Two morphologically distinct branch types are readily recognized in CFs: “primary” (P) thick, relatively smooth, stalks and “nonprimary” (N) beaded threads with large, dense boutons separated by thin axonal segments (Palay and Chan-Palay, 1974; Sugihara et al., 1999). The CF origin crossing the Purkinje-molecular layer boundary is always a primary branch. Moreover, nonprimary branches never give rise to primary daughters. Based on these descriptive observations, we devised an operational procedure to systematically identify and quantitatively define distinct CF branch types. Starting from the origin, we first differentiated primary bifurcations based on their daughters (Fig. 5A): bifurcations splitting into two P daughters (PPP), bifurcations splitting into one P and one N daughter (PPN), and bifurcations splitting into two N daughters (PNN). When either daughter type was ambiguous, we tagged bifurcations as “uncertain” (252 of 2651 total bifurcations, ∼10%).
The “certain” bifurcations displayed dramatic differences in two specific morphometrics, namely the volume proportion, or total volumetric fraction of the two stemming subtrees relative to the entire CF, and the daughter subtree volume ratio, which measures the volumetric imbalance between the two subtrees. Specifically, the volume proportion was much higher for PPP than PNN bifurcations (0.68 ± 0.22 vs 0.14 ± 0.07, p < 10−4), while the daughter volume ratio was much lower for PPN (0.06 ± 0.09) than for either of the other two bifurcation types (PPP: 0.63 ± 0.22, p < 10−4; PNN: 0.50 ± 0.24, p < 10−4). Thus, the two subtrees of PPP bifurcations have similar tree volumes, and together constitute a substantial proportion of the total CF volume. The primary subtree of PPN bifurcations was substantially larger than the other, and their joint volume varies over a large range. The two subtrees of PNN bifurcations also had similar tree volumes, but their sum only amounted to a small proportion of the CF tree. Linear discriminant analysis demonstrated that these two characteristics almost perfectly separate the three bifurcation types, with <2% of incorrect assignments (Fig. 5B). Given the effectiveness of volumetric proportion and daughter volumetric ratio to operationally distinguish CF bifurcation (and thus branch) types, the uncertain cases were assigned accordingly. All other morphometrics unrelated to those that differ by definition were similar for all tree bifurcation types, including branching angle (Fig. 3D).
Morphological comparisons of distinct branch types may reveal potential functional differences. First we compared the size of nonprimary subtrees arising from distinct bifurcations. Nonprimary subtrees stemming from PPN bifurcations had significantly fewer terminal tips (Fig. 5C) than those from PNN bifurcations (3.0 ± 5.2 vs 14 ± 11, p < 10−4), suggesting that they might constitute different types of subtrees. We therefore distinguished the subtrees that originate from PNN bifurcations, calling their branches “distal” in light of the location along the CF tree. We call most nonprimary subtrees of PPN bifurcations “tendrils,” consistent with their previously described thinner, bouton-dense branches (Scheibel and Scheibel, 1954; Palay and Chan-Palay, 1974; Sugihara et al., 1999). The low number of branches per tendril subtree suggests that the nets around P branches are typically composed of numerous small arbors. The remaining subtrees of PPN bifurcations extend branches back into the PC layer, therefore potentially synapsing with Purkinje somata, and are referred to as “retrograde.” The same morphometrics separating PPN from PPP and PNN bifurcations also discriminated between PPN bifurcations giving rise to retrograde and tendril subtrees. Specifically, retrograde-stemming bifurcations (Fig. 5B, unfilled maroon squares in the upper left corner) had higher volume proportion (0.97 ± 0.07 vs 0.39 ± 0.28, p < 10−4) and lower daughter volume ratio (0.02 ± 0.03 vs 0.06 ± 0.09, p < 10−4) than tendril-stemming bifurcations.
Distinct branch types all dramatically differed in polarity, i.e., their direction of growth relative to the line from the CF origin to the center of mass of the primary tree (Fig. 5D). Primary branches were (expectedly) most aligned with the main axis of growth, while distal branches displayed a more moderate tendency to grow parallel to this direction. Tendril branches were nearly perpendicular, and retrograde fibers had a negative (antiparallel) polarity. Pairwise polarity differences between all branch types were highly significant (p < 10−4). Tendril and distal branches were otherwise morphologically similar, especially compared with primary branches, e.g., in diameter (tendril, 0.42 ± 0.28; distal, 0.41 ± 0.25; primary, 0.71 ± 0.39 μm) and branch path length (tendril, 6.5 ± 7.2; distal, 7.1 ± 7.8; primary, 8.7 ± 8.2 μm). Retrograde branches were also similar to other nonprimary branches except for having the longest branch path lengths (10.5 ± 11.0 μm), which might relate to the demands of their synaptic target.
Tendril and distal branches made up the largest proportion of length, yet primary branches had similar volumetric extent due to their larger diameters (Fig. 5E). Tendril branches concentrated at a more proximal path distance from the origin than distal branches (Fig. 5F), largely explaining the bimodal distribution of CF length (compare Fig. 3C). The mean tendril and distal path distances were not significantly different from the first and second CF modes, respectively (113 ± 39 vs 104 ± 32 μm and 240 ± 54 vs 231 ± 52 μm, respectively). The CVs for the respective distribution pairs were also not statistically different (0.65 ± 0.55 and 0.53 ± 0.19 for tendril and first mode; 0.21 ± 0.16 and 0.23 ± 0.20 for distal and second mode, respectively). Distal branches contributed a smaller proportion of total tree length mode than the second mode (35 ± 10% vs 46 ± 24%, p < 0.01) due to a moderately overlapping contribution of the tendril distribution to the second mode (Fig. 5F). Length proportions were not significantly different for tendril and the first mode (50 ± 10% vs 54 ± 24%, respectively).
Climbing fiber bouton characterization
Boutons are the synaptic transmission sites. Therefore, characterizing their distributions and morphology is critical for understanding CF function. CFs had 268 ± 65 boutons (N = 68), similar to earlier reports (Rossi et al., 1993; Bravin et al., 1999; Sugihara et al., 1999). Bouton Euclidean length (2.34 ± 1.15 μm) and width (0.94 ± 0.34 μm) were also fully consistent with previous electron microscopy measures (Cesa et al., 2011). Tendril, retrograde, and distal bouton morphometrics were essentially equivalent and are jointly referred to as “nonprimary.” Primary branches had a lower volumetric proportion of boutons (p < 10−4) despite their significantly larger bouton surface area (Tables 3 and 4), due to their significantly smaller diameter ratio between boutons and adjacent interbouton segments (p < 10−4). This suggests that primary branches have distinctive bouton properties compared with nonprimary branches, possibly reflecting functional constraints (see Discussion).
Table 3.
CF bouton morphological properties for entire tree
| Tree level | Primary N = 68 | Nonprimary N = 68 |
|---|---|---|
| Number of boutons | 30 ± 11 | 238 ± 65 |
| Terminal/en passant ratio | 0 | 0.46 ± 0.12 |
| Bouton volume proportion (%) | 57 ± 9.3 | 68 ± 7.3 |
| Proportion of terminations with terminal boutons (%) | n/a | 48 ± 12 |
Table 4.
CF bouton morphological properties for individual boutons
| Bouton level | Primary N = 2040 (EP) N = 0 (Term) | Nonprimary N = 11,154 (EP) N = 5033 (Term) |
|---|---|---|
| Bouton/interbouton diameter ratio | 1.5 ± 0.56 | 2.0 ± 0.72 |
| En passant surface area (μm2) | 14 ± 9.3 | 6.8 ± 4.9 |
| Terminal surface area (μm2) | n/a | 5.5 ± 4.1 |
| En passant length (μm) | 3.2 ± 1.6 | 2.4 ± 1.2 |
| Terminal length (μm) | n/a | 1.9 ± 1.0 |
| En passant diameter (μm) | 0.94 ± 0.36 | 0.64 ± 0.24 |
| Terminal diameter (μm) | n/a | 0.68 ± 0.28 |
| En passant length/diameter ratio | 4.4 ± 2.0 | 4.7 ± 2.2 |
| Terminal length/diameter ratio | n/a | 3.8 ± 2.4 |
Number and density of tendril and distal boutons were similar to each other and both significantly higher than other types (Fig. 6A). They are therefore the major signal transmitting branch types for their separate spatial domains. Retrograde boutons constituted 3.0% of the total count, a lower proportion than previously reported (Sugihara et al., 1999). However, this discrepancy only amounts to 1.8% of the total number of boutons per CF, suggesting general consistency with earlier data. Primary branches were significantly less bouton dense than nonprimary branches (Fig. 6B). Moreover, longer CFs had lower nonprimary, but not primary, bouton density (Fig. 6B). The proportions of terminations ending in boutons also decreased with the number of tree branches (r = −0.66, p < 10−4; data not shown). Bouton morphology differed between primary and nonprimary branches and between terminal and en passant (EP). Primary branch boutons (EP only) were longer and wider, while nonprimary EP boutons were longer than but similarly wide to nonprimary terminal boutons (Table 4). The proportionality of terminal bouton length to diameter was shallower (Fig. 6C) and weaker (r = 0.14, N = 5033) than for primary (r = 0.39, N = 2040) and nonprimary EP boutons (r = 0.44, N = 11,154). Terminal boutons were overall more spherical than EP boutons (Fig. 6D). Moreover, for all branch types, wider boutons had wider neighboring boutons (r = 0.43 ± 0.12, p < 10−4).
Figure 6.
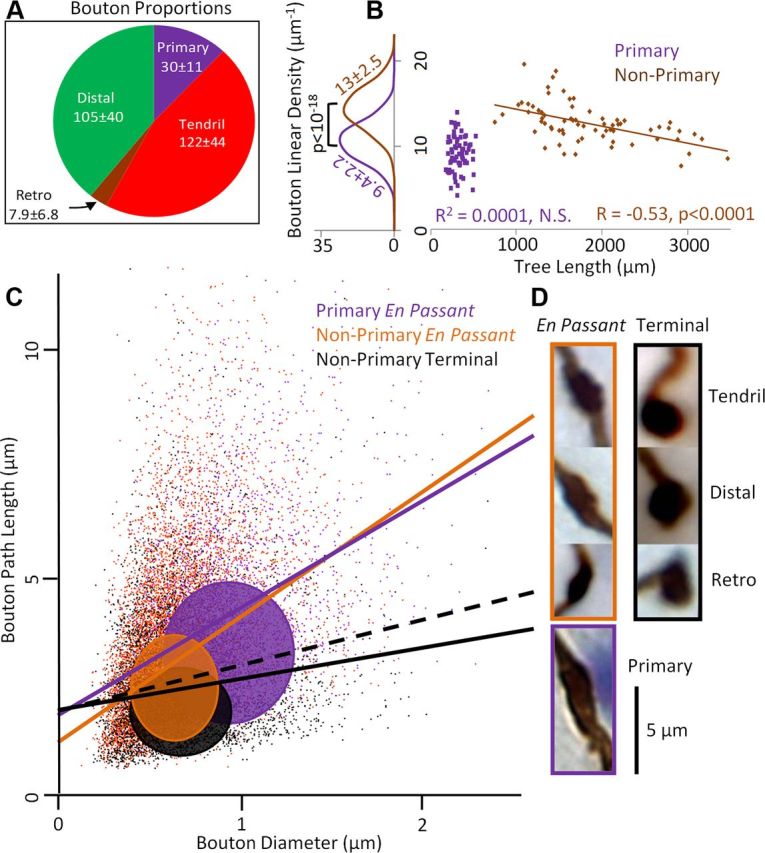
CF boutons differ by branch type and terminal versus en passant position. A, Bouton proportions (wedge sizes) and counts per CF (mean ± SD) by branch type. B, Relationship between linear bouton density (number of boutons per 100 μm) and tree length across CFs. Unlike in primary branches, nonprimary bouton density decreases with increased tree length. C, Scatter plot of bouton path length versus diameter for all boutons (N = 18,227) colored by type. En passant bouton path length strongly correlates with diameter (purple and orange lines). For terminal boutons the correlation is also positive (solid black line) but less than unitary (black dashed line, with Y intercept raised for visual comparison). Colored ovals are SDs for the three bouton types centered at the respective means. Primary boutons (purple) are larger than nonprimary (orange and black) in both diameter and path length. D, Gallery of representative boutons. En passant boutons are distinctly elongated along the path compared with the more spherical terminal boutons.
IBD was measured in all branch types to explore how regularly spaced boutons are along the CF tree. The CV of distances between bouton centers (IBD_center) was significantly smaller compared with randomized boutons (CV = 0.75 ± 0.11 vs 0.93 ± 0.12, N = 68 CFs, p < 10−4), indicating regularity in bouton positions. Randomization that avoided bouton overlaps produced the same variability (CV = 0.93 ± 0.14, p > 0.9). Thus, the constraint bouton length imposes on their minimum proximity cannot explain the observed regular spacing. Distances measured between bouton edges (IBD_edge) had larger CV (1.12 ± 0.14) due to the added variability of bouton length, but still significantly smaller than random (CV = 1.21 ± 0.14, p < 0.01). Therefore, although IBDs vary within CFs, boutons are spaced more regularly than random. Moreover, longer boutons had greater following IBDs (r = 0.14 ± 0.10 vs 0.00 ± 0.09 for randomized boutons, p < 10−4), which partially underlies CF bouton position regularity. Interestingly, the correlation between bouton length and the preceding IBD was not significant, suggesting some functional specificity.
CFs target molecular layer interneurons beyond chance
CFs excite molecular layer interneurons, providing feedforward inhibition to PCs. However, the connectivity of this circuit has yet to be quantified. Cell bodies were counterstained with thionine (Fig. 1) to analyze the number of CF boutons that overlap with interneuron somata (“potential contacts”). Each CF made 44 ± 15 potential contacts (18 ± 6.0% of total boutons), with different contribution by branch and bouton type (Fig. 7A). The proportion of boutons that overlapped with interneuron somata was similar for primary (20 ± 10%), tendril (19 ± 9.0%), and distal EP boutons (16 ± 7.9%), as well as tendril and distal terminal boutons (16 ± 8.4 and 17 ± 10%, respectively). To test whether CF and interneuron somata make targeted potential contacts, the number of overlaps was compared with chance overlaps upon random bouton shuffling (Fig. 7B). CF boutons had significantly more juxtapositions with interneuron cell bodies than randomly expected (p < 0.001), particularly for terminal boutons (p < 10−4), though EP boutons were also significant (Fig. 7C). Broken down by branch type, all boutons except distal EP overlapped with interneurons beyond chance (Fig. 7D). This suggests that CF potential contacts with interneuron somata, especially on terminal boutons, are likely functional. Although most CF–interneuron overlaps occur with dendrites (Nishiyama et al., 2007), somatic overlaps involved nearly one in five CF boutons, potentially providing a substantial contribution to olivocerebellar feedforward inhibition.
Figure 7.
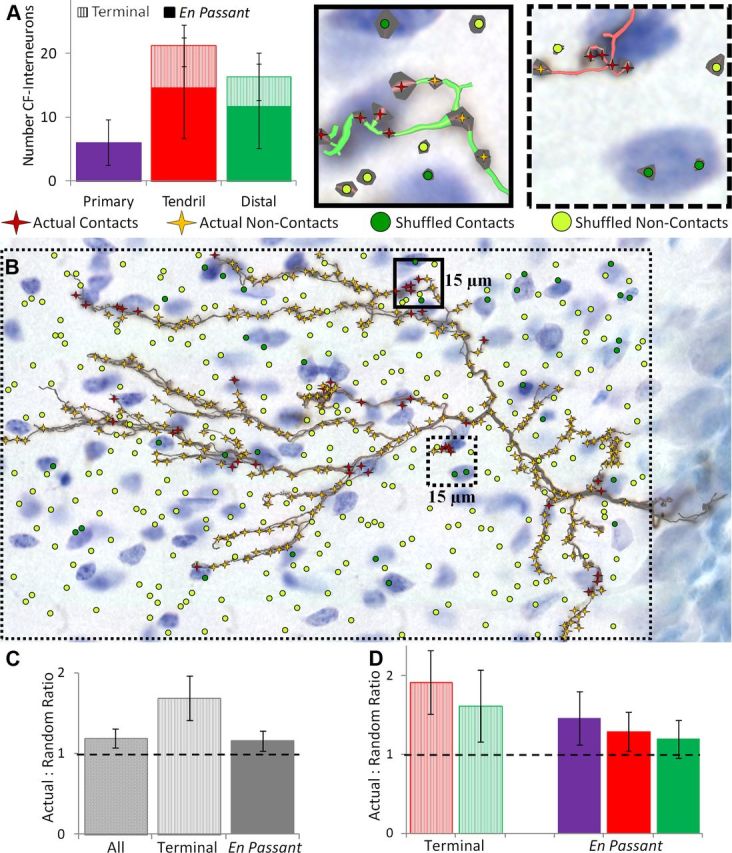
CF boutons systematically overlap with molecular layer interneuron somata. A, Number of overlaps of terminal (hatched) and en passant boutons onto interneuron somata per CF by branch type. B, Representative CF superimposed with both its actual boutons and an equal number of boutons randomly shuffled within the CF bounding box (large rectangular dotted border). Actual boutons that do and do not contact interneurons are colored maroon and gold, respectively. Shuffled boutons that do and do not contact interneurons are colored dark and light green, respectively. Example regions (smaller solid and dashed squares) are enlarged upper right above the figure to appreciate detail. CF and bouton radii are thickened 1.5× for clearer visualization. C, Interneuron overlap ratio between actual and shuffled boutons. Potential contacts between CF boutons and interneuron somata occur significantly more than by chance (horizontal dashed unity line). D, Further distinction by branch type. Only distal en passant boutons do not overlap with interneurons significantly beyond chance. Error bars indicate 95% confidence intervals.
Interneurons are commonly divided into basket cells in the inner third and stellate cells in the outer third of the molecular layer (Palay and Chan-Palay, 1974), though a morphometric classification analysis (Sultan and Bower, 1998) strongly suggests that these cells comprise a single type with continuous morphological differentiation across depth. To examine whether CFs have a greater tendency to overlap with basket- or stellate-like somata, the proportion of CF-somata potential contacts were measured in the inner, middle, and outer third of the molecular layer. The resulting values (45 ± 10, 37 ± 14, and 18 ± 12%, respectively; N = 12 CFs; see Materials and Methods for sample size determination) indicate that CFs overall tend to juxtapose with basket-like interneurons more than with stellate-like interneurons. These findings were branch-type specific. Basket-like proportion was especially high for primary and tendril branches, both having ∼2/3 of their bouton-somata overlaps in the inner third layer. In contrast, the potential contacts of distal boutons with interneuron somata increased in proportion toward the cortical surface (10 ± 21, 39 ± 35, and 51 ± 38 for inner, middle, and outer thirds, respectively). This result was not due to a change in interneuron density across the molecular layer, which was relatively constant (interneuron density = 0.50 ± 0.11, 0.53 ± 0.09, 0.44 ± 0.09; see Materials and Methods).
PC somata were also stained, and could be unambiguously identified as the underlying target (“paired PC”) of 48 of the 68 CFs. We reconstructed these somata to compare their geometry (surface area, perimeter length, and roundness) with the overlying CF morphology. None of these measures significantly correlated with any CF morphometric, either for the entire CF tree or for just the retrograde branches or boutons (data not shown). The proportions of retrograde boutons that did and did not overlap with the paired PC soma were also measured. The former was nearly three times as common as the latter (74 ± 37% vs 26 ± 37%; N = 10 CFs; see Materials and Methods for sample size determination). None of the boutons that did not overlap with the paired soma overlapped with other labeled PC soma; however, the possibility exists that some Purkinje somata were too faintly labeled to observe.
Discussion
CFs have intrigued scientists ever since Ramon y Cajal's time. Unlike typical axons, CFs primarily synapse on single PCs immediately upon entering the principal neuron layer. This one-to-one relationship is accompanied by stereotypical physiology across cerebellar regions, including the signature “complex spike,” low-frequency rhythmic firing, and uniform conduction time from the inferior olive (Sugihara et al., 1993). The present study investigated whether cerebellar stereotypy extends to CF morphology. CF size and shape are considerably diverse both at the tree and branch levels, as well as in the morphometric distribution across distance. Morphological variability of CFs was similar to that of axon types contacting many target cells. Lack of regional differences and morphological clusters suggests that such diversity is an irreducible population characteristic rather than reflecting distinct subclasses.
We found comparable variability in Purkinje dendritic trees, especially isolating the proximal dendrites where CFs synapse based on branch diameter (see Materials and Methods). CFs and PCs may exert a reciprocal morphological influence (Rossi and Strata, 1995; Sotelo and Dusart, 2009). Our finding that PC body size and shape do not correlate with CF morphology suggests that only dendrites might systematically affect CF structure and vice versa. The effect of CFs on PCs is central to all functional models of the cerebellum (Houk et al., 1996). Since the variability found in CFs likely relates to the underlying Purkinje dendritic tree, the CF influence on PC signaling and timing will be best addressed by reconstructing and biophysically modeling paired CF and PCs. The present detailed quantification of CF morphology provides a structural foundation to understand their computational role.
CFs are composed of primary and tendril branches. We introduced a simple and accurate definition to operationally identify these branch types as well as distal and retrograde fibers based on quantitative and intuitive morphological measurements. This method reproducibly and automatically labels all branches, allowing their first comprehensive analysis. Primary branches were thicker than nonprimary branches and had larger, less densely distributed boutons. Primary boutons were also more similar in diameter to adjacent interbouton regions. A consequence of these properties would be lower axial resistance, suggesting that primary branches highly prioritize propagation speed and reliability. Since these branches give rise to the remaining CF tree, propagation failures would have drastic consequences. Primary branches presumably provide the basic CF framework, faithfully tracking the PC principal dendritic trunk. Primary branches are thus like communication highways, ensuring that signals reach distal territories fast and efficiently. Still, over half of the primary branch volume was taken up by boutons which, although less than for other branch types, suggests that primary branches provide considerable signal transmission as well.
Primary branches give rise to the more targeted tendril and distal branches, together supplying the vast majority of CF synapses. Tendril branches often follow similar routes as their primary parents, possibly targeting nearby branches on Purkinje dendrites akin to local roadways. Tendril branches summed up to three times the length and four times the bouton count of primary branches, clearly outnumbering their signaling capacity. Distal branches differed in location along the CF and orientation from both tendril and primary branches, suggesting functionally distinct contacts onto separate dendritic domains of PCs. In contrast to primary branches, the large diameter ratio between boutons and axonal shaft in tendril and distal branches may optimize effective synaptic transmission and plasticity, while possibly providing a mechanism for signal filtering. Retrograde branches accounted for a minor fraction of boutons. However, their location in the PC layer implies distinct synaptic targeting which may enhance, or differentiate altogether, their computational role.
The axonal placement of CF boutons directly maps onto synapses with PC dendrites, therefore bearing straight functional relevance. On average CFs had a bouton every 8.7 μm, which is sparse compared with six other axon types measured by Shepherd et al. (2002), with spacing that ranged from 2.6 to 9.9 μm. Even within the cerebellum, parallel fibers had a bouton every 5.2 μm, nearly twice the density of CFs, with small and similar sample-to-sample variability (CV ≈ 0.2). Boutons were distributed semiregularly along the CF, also similarly to the aforementioned axons (Shepherd et al., 2002). In contrast, axonal boutons on neocortical pyramidal neurons were spaced randomly (Hellwig et al., 1994). Axonal bouton spacing regularity, therefore, is common but not universal. Moreover, longer CF boutons were spaced farther apart. A quantitatively similar correlation was found between spine head diameters and interspine distance (Konur et al., 2003), suggesting a shared presynaptic and postsynaptic homeostatic phenomenon. Optimization of CF IBDs to balance depolarization across the underlying dendrites would constitute an important determinant of signal summation in PCs.
In another example of morphological homeostasis, smaller CFs tended to be bouton denser, partially compensating for their lower synaptic number. This is again analogous to the tendency of hippocampus principal neurons with smaller than average dendrites to have larger than average trees (Samsonovich and Ascoli, 2006). The net result is lesser morphological variation (in CF total bouton number or hippocampal cell total dendritic span), which may increase biophysical stability. The underlying developmental or maintenance mechanism must be specific since it affects some CF branches (distal and tendril) but not others (primary). Morphological homeostasis is nontrivial as the opposite relationship is characteristically typical of biological systems (taller trees have longer branches, etc.). Within CFs, for example, longer boutons had larger diameters.
Length and diameter were more independent in terminal than in EP boutons, possibly due to their postsynaptic locations. While EP boutons typically synapse along Purkinje dendritic shafts, terminal boutons may be more frequent at terminal endings or different cell types. Indeed, while all bouton types except distal EP overlapped with molecular layer interneurons beyond chance, terminal bouton–interneuron potential contacts were statistically most significant. Interneurons contact a large number of other PCs, completing a classic feedforward inhibitory microcircuit. Although we could only visualize bouton overlaps with somata, most CF–interneuron overlaps occur with dendrites. Nishiyama et al. (2007) sampled CF branches to count 9.26 interneuron dendrite appositions per 100 μm CF. Extrapolation to the total size of CFs studied here would provide a figure of 215 potential contacts with interneuron dendrites. Together with our count of somatic overlaps, CFs may average up to 259 bouton–interneuron overlaps. This value must be considered an upper bound since it nearly equals the total number of CF boutons. CF–interneuron overlaps might transmit functional information even without actual contacts, via glutamate spillover presumably from CF-to-PC synapses (Szapiro and Barbour, 2007). Most CF boutons could thus excite both PC and interneurons. Our data suggest that CFs are at least as well suited to excite interneurons as PCs. Definitively associating functional contacts to bouton–interneuron overlaps will require measurement of molecular or biophysical influences. Ultrastructural analysis may reveal synaptic contacts or their absence. Given the possibility of volume transmission, however, even electron microscopy cannot (dis)prove functional axosomatic relationships. The statistical results at the population level of our light-microscopy reconstructions strongly suggest feedforward circuit organization.
Do CF boutons target interneuron somata or vice versa? CFs and interneurons develop in the same period (Altman, 1972; Zhang and Goldman, 1996; Sugihara, 2005, 2006), impeding causal inference. Interneurons also receive synapses from parallel fibers and other interneurons, while CF boutons exciting interneuron somata synapse with PC dendrites. The observed CF–interneuron spatial targeting might result from better survival rates for interneurons or CFs with functional contacts. CF population size is drastically reduced into maturity (Sugihara, 2005; Hashimoto et al., 2009). Purkinje soma inhibition by molecular interneurons may also be necessary to establish one-to-one Purkinje–CF pairing (Nakayama et al., 2012). Fully explaining the observed spatial targeting will require controlling and measuring the relation among CF and interneuron chemical cues, their proximity, and survival rate.
Through deposition in the public NeuroMorpho.org database (Ascoli et al., 2007), these 68 CF reconstructions can be further reanalyzed beyond the present characterization, compared or combined with future CF reconstructions, and loaded into neuron simulation environments (Hines and Carnevale, 2001) to test the influence of morphology on biophysical properties. To the best of our knowledge, these are also the first available CF digital tracings with identified branch types and fully reconstructed boutons. As such, they might serve as essential building blocks for anatomically realistic cerebellar network models. The necessity to include plausible circuit connectivity into simulations of the cerebellar cortex has been recognized for at least 35 years (Pellionisz et al., 1977). Only much more recently, however, have the required computational power and infrastructures become available (Gleeson et al., 2007). The large set of digital CF morphologies described in this study provides both a useful source of data and powerful constraints for large-scale modeling efforts.
This collection might also constitute the first detailed reconstructions of the complete axonal terminal field reported for any neuronal class in the mammalian brain. Their comprehensive morphological analysis could thus reveal insights into basic function that may also apply through other regions of the CNS.
Footnotes
Funding was provided by the National Institutes of Health under Grant R01-39600 (G.A.A.). We are grateful to Wahaj Choudhry for help reconstructing boutons and measuring interneuron overlaps, Darshan Desai who assisted with the digital reconstruction process, and Todd A. Gillette and Dr. Julia Berzhanskaya for providing feedback on an earlier version of the manuscript.
The authors declare no conflicts of interest.
References
- Altman J. Postnatal development of the cerebellar cortex in the rat. I. The external germinal layer and the transitional molecular layer. J Comp Neurol. 1972;145:353–397. doi: 10.1002/cne.901450305. [DOI] [PubMed] [Google Scholar]
- Anderson K, Yamamoto E, Kaplan J, Hannan M, Jacobs B. Neurolucida Lucivid versus Neurolucida camera: A quantitative and qualitative comparison of three-dimensional neuronal reconstructions. J Neurosci Methods. 2010;186:209–214. doi: 10.1016/j.jneumeth.2009.11.024. [DOI] [PubMed] [Google Scholar]
- Aoki H, Sugihara I. Morphology of single olivocerebellar axons in the denervation-reinnervation model produced by subtotal lesion of the rat inferior olive. Brain Res. 2012;1449:24–37. doi: 10.1016/j.brainres.2012.02.040. [DOI] [PubMed] [Google Scholar]
- Ascoli GA, Krichmar JL, Nasuto SJ, Senft SL. Generation, description and storage of dendritic morphology data. Philos Trans R Soc Lond B Biol Sci. 2001;356:1131–1145. doi: 10.1098/rstb.2001.0905. [DOI] [PMC free article] [PubMed] [Google Scholar]
- Ascoli GA, Donohue DE, Halavi M. NeuroMorpho.org: a central resource for neuronal morphologies. J Neurosci. 2007;27:9247–9251. doi: 10.1523/JNEUROSCI.2055-07.2007. [DOI] [PMC free article] [PubMed] [Google Scholar]
- Ascoli GA, Brown KM, Calixto E, Card JP, Galván EJ, Perez-Rosello T, Barrionuevo G. Quantitative morphometry of electrophysiologically identified CA3b interneurons reveals robust local geometry and distinct cell classes. J Comp Neurol. 2009;515:677–695. doi: 10.1002/cne.22082. [DOI] [PMC free article] [PubMed] [Google Scholar]
- Benjamini Y, Hochberg Y. Controlling the false discovery rate: a practical and powerful approach to multiple testing. J R Statist Soc B. 1995;57:289–300. [Google Scholar]
- Berry M, Flinn R. Vertex analysis of Purkinje cell dendritic trees in the cerebellum of the rat. Proc R Soc Lond B Biol Sci. 1984;221:321–348. doi: 10.1098/rspb.1984.0036. [DOI] [PubMed] [Google Scholar]
- Bonferroni CE. Teoria statistica delle classi e calcolo delle probabilità. Pubblicazioni del R Istituto Superiore di Scienze Economiche e Commerciali di Firenze. 1936;8:3–62. [Google Scholar]
- Bravin M, Morando L, Vercelli A, Rossi F, Strata P. Control of spine formation by electrical activity in the adult rat cerebellum. Proc Natl Acad Sci U S A. 1999;96:1704–1709. doi: 10.1073/pnas.96.4.1704. [DOI] [PMC free article] [PubMed] [Google Scholar]
- Brown KM, Donohue DE, D'Alessandro G, Ascoli GA. A cross-platform freeware tool for digital reconstruction of neuronal arborizations from image stacks. Neuroinformatics. 2005;3:343–360. doi: 10.1385/NI:3:4:343. [DOI] [PubMed] [Google Scholar]
- Brown KM, Gillette TA, Ascoli GA. Quantifying neuronal size: summing up trees and splitting the branch difference. Semin Cell Dev Biol. 2008;19:485–493. doi: 10.1016/j.semcdb.2008.08.005. [DOI] [PMC free article] [PubMed] [Google Scholar]
- Callaway JC, Lasser-Ross N, Ross WN. IPSPs strongly inhibit climbing fiber-activated [Ca2+]i increases in the dendrites of cerebellar Purkinje neurons. J Neurosci. 1995;15:2777–2787. doi: 10.1523/JNEUROSCI.15-04-02777.1995. [DOI] [PMC free article] [PubMed] [Google Scholar]
- Cesa R, Premoselli F, Renna A, Ethell IM, Pasquale EB, Strata P. Eph receptors are involved in the activity-dependent synaptic wiring in the mouse cerebellar cortex. PLoS One. 2011;6:e19160. doi: 10.1371/journal.pone.0019160. [DOI] [PMC free article] [PubMed] [Google Scholar]
- Dumitriu D, Cossart R, Huang J, Yuste R. Correlation between axonal morphologies and synaptic input kinetics of interneurons from mouse visual cortex. Cereb Cortex. 2007;17:81–91. doi: 10.1093/cercor/bhj126. [DOI] [PubMed] [Google Scholar]
- Eccles JC, Ito M, Szentágothai J. The cerebellum as a neuronal machine. Berlin: Springer; 1967. [Google Scholar]
- Gleeson P, Steuber V, Silver RA. neuroConstruct: a tool for modeling networks of neurons in 3D space. Neuron. 2007;54:219–235. doi: 10.1016/j.neuron.2007.03.025. [DOI] [PMC free article] [PubMed] [Google Scholar]
- Halavi M, Polavaram S, Donohue DE, Hamilton G, Hoyt J, Smith KP, Ascoli GA. NeuroMorpho.org implementation of digital neuroscience: dense coverage and integration with the NIF. Neuroinformatics. 2008;6:241–252. doi: 10.1007/s12021-008-9030-1. [DOI] [PMC free article] [PubMed] [Google Scholar]
- Hashimoto K, Ichikawa R, Kitamura K, Watanabe M, Kano M. Translocation of a “winner” climbing fiber to the Purkinje cell dendrite and subsequent elimination of “losers” from the soma in developing cerebellum. Neuron. 2009;63:106–118. doi: 10.1016/j.neuron.2009.06.008. [DOI] [PubMed] [Google Scholar]
- Hawkes R, Leclerc N. Antigenic map of the rat cerebellar cortex: the distribution of parasagittal bands as revealed by monoclonal anti-Purkinje cell antibody mabQ113. J Comp Neurol. 1987;256:29–41. doi: 10.1002/cne.902560104. [DOI] [PubMed] [Google Scholar]
- Hellwig B, Schüz A, Aertsen A. Synapses on axon collaterals of pyramidal cells are spaced at random intervals: a Golgi study in the mouse cerebral cortex. Biol Cybern. 1994;71:1–12. doi: 10.1007/BF00198906. [DOI] [PubMed] [Google Scholar]
- Helmstaedter M, Sakmann B, Feldmeyer D. The relation between dendritic geometry, electrical excitability, and axonal projections of L2/3 interneurons in rat barrel cortex. Cereb Cortex. 2009;19:938–950. doi: 10.1093/cercor/bhn138. [DOI] [PubMed] [Google Scholar]
- Hines ML, Carnevale NT. NEURON: a tool for neuroscientists. Neuroscientist. 2001;7:123–135. doi: 10.1177/107385840100700207. [DOI] [PubMed] [Google Scholar]
- Houk JC, Buckingham JT, Barto AG. Models of the cerebellum and motor learning. Behav Brain Sci. 1996;19:368–383. [Google Scholar]
- Ichikawa R, Miyazaki T, Kano M, Hashikawa T, Tatsumi H, Sakimura K, Mishina M, Inoue Y, Watanabe M. Distal extension of climbing fiber territory and multiple innervation caused by aberrant wiring to adjacent spiny branchlets in cerebellar Purkinje cells lacking glutamate receptor delta 2. J Neurosci. 2002;22:8487–8503. doi: 10.1523/JNEUROSCI.22-19-08487.2002. [DOI] [PMC free article] [PubMed] [Google Scholar]
- Ito M. The cerebellum and neural control. New York: Raven; 1984. [Google Scholar]
- Ito M, Sakurai M, Tongroach P. Climbing fibre induced depression of both mossy fibre responsiveness and glutamate sensitivity of cerebellar Purkinje cells. J Physiol. 1982;324:113–134. doi: 10.1113/jphysiol.1982.sp014103. [DOI] [PMC free article] [PubMed] [Google Scholar]
- Itoh K, Konishi A, Nomura S, Mizuno N, Nakamura Y, Sugimoto T. Application of coupled oxidation reaction to electron microscopic demonstration of horseradish peroxidase: cobalt-glucose oxidase method. Brain Res. 1979;175:341–346. doi: 10.1016/0006-8993(79)91013-8. [DOI] [PubMed] [Google Scholar]
- Konur S, Rabinowitz D, Fenstermaker VL, Yuste R. Systematic regulation of spine sizes and densities in pyramidal neurons. J Neurobiol. 2003;56:95–112. doi: 10.1002/neu.10229. [DOI] [PubMed] [Google Scholar]
- Larramendi EM, Victor T. Synapses on the Purkinje cell spines in the mouse. An electronmicroscopic study. Brain Res. 1967;5:15–30. doi: 10.1016/0006-8993(67)90216-8. [DOI] [PubMed] [Google Scholar]
- Lin SC, Huck JH, Roberts JD, Macklin WB, Somogyi P, Bergles DE. Climbing fiber innervation of NG2-expressing glia in the mammalian cerebellum. Neuron. 2005;46:773–785. doi: 10.1016/j.neuron.2005.04.025. [DOI] [PubMed] [Google Scholar]
- Llinás R, Nicholson C. Reversal properties of climbing fiber potential in cat Purkinje cells: an example of a distributed synapse. J Neurophysiol. 1976;39:311–323. doi: 10.1152/jn.1976.39.2.311. [DOI] [PubMed] [Google Scholar]
- Manor Y, Koch C, Segev I. Effect of geometrical irregularities on propagation delay in axonal trees. Biophys J. 1991;60:1424–1437. doi: 10.1016/S0006-3495(91)82179-8. [DOI] [PMC free article] [PubMed] [Google Scholar]
- Martone ME, Zhang S, Gupta A, Qian X, He H, Price DL, Wong M, Santini S, Ellisman MH. The cell-centered database: a database for multiscale structural and protein localization data from light and electron microscopy. Neuroinformatics. 2003;1:379–395. doi: 10.1385/NI:1:4:379. [DOI] [PubMed] [Google Scholar]
- Maruta J, Hensbroek RA, Simpson JI. Intraburst and interburst signaling by climbing fibers. J Neurosci. 2007;27:11263–11270. doi: 10.1523/JNEUROSCI.2559-07.2007. [DOI] [PMC free article] [PubMed] [Google Scholar]
- Mathy A, Ho SS, Davie JT, Duguid IC, Clark BA, Häusser M. Encoding of oscillations by axonal bursts in inferior olive neurons. Neuron. 2009;62:388–399. doi: 10.1016/j.neuron.2009.03.023. [DOI] [PMC free article] [PubMed] [Google Scholar]
- McGarry LM, Packer AM, Fino E, Nikolenko V, Sippy T, Yuste R. Quantitative classification of somatostatin-positive neocortical interneurons identifies three interneuron subtypes. Front Neural Circuits. 2010;4:12. doi: 10.3389/fncir.2010.00012. [DOI] [PMC free article] [PubMed] [Google Scholar]
- Mittmann W, Häusser M. Linking synaptic plasticity and spike output at excitatory and inhibitory synapses onto cerebellar Purkinje cells. J Neurosci. 2007;27:5559–5570. doi: 10.1523/JNEUROSCI.5117-06.2007. [DOI] [PMC free article] [PubMed] [Google Scholar]
- Mott DD, Turner DA, Okazaki MM, Lewis DV. Interneurons of the dentate-hilus border of the rat dentate gyrus: morphological and electrophysiological heterogeneity. J Neurosci. 1997;17:3990–4005. doi: 10.1523/JNEUROSCI.17-11-03990.1997. [DOI] [PMC free article] [PubMed] [Google Scholar]
- Myatt DR, Hadlington T, Ascoli GA, Nasuto SJ. Neuromantic—from semi-manual to semi-automatic reconstruction of neuron morphology. Front Neuroinform. 2012;6:4. doi: 10.3389/fninf.2012.00004. [DOI] [PMC free article] [PubMed] [Google Scholar]
- Nakayama H, Miyazaki T, Kitamura K, Hashimoto K, Yanagawa Y, Obata K, Sakimura K, Watanabe M, Kano M. GABAergic inhibition regulates developmental synapse elimination in the cerebellum. Neuron. 2012;74:384–396. doi: 10.1016/j.neuron.2012.02.032. [DOI] [PubMed] [Google Scholar]
- Nishiyama H, Linden DJ. Differential maturation of climbing fiber innervation in cerebellar vermis. J Neurosci. 2004;24:3926–3932. doi: 10.1523/JNEUROSCI.5610-03.2004. [DOI] [PMC free article] [PubMed] [Google Scholar]
- Nishiyama H, Fukaya M, Watanabe M, Linden DJ. Axonal motility and its modulation by activity are branch-type specific in the intact adult cerebellum. Neuron. 2007;56:472–487. doi: 10.1016/j.neuron.2007.09.010. [DOI] [PMC free article] [PubMed] [Google Scholar]
- Okubo Y, Iino M. Visualization of glutamate as a volume transmitter. J Physiol. 2011;589:481–488. doi: 10.1113/jphysiol.2010.199539. [DOI] [PMC free article] [PubMed] [Google Scholar]
- Palay SL, Chan-Palay V. Cerebellar cortex: cytology and organization. Berlin: Springer; 1974. [Google Scholar]
- Pellionisz A, Llinás R, Perkel DH. A computer model of the cerebellar cortex of the frog. Neuroscience. 1977;2:19–35. doi: 10.1016/0306-4522(77)90065-3. [DOI] [PubMed] [Google Scholar]
- Povysheva NV, Zaitsev AV, Kröner S, Krimer OA, Rotaru DC, Gonzalez-Burgos G, Lewis DA, Krimer LS. Electrophysiological differences between neurogliaform cells from monkey and rat prefrontal cortex. J Neurophysiol. 2007;97:1030–1039. doi: 10.1152/jn.00794.2006. [DOI] [PubMed] [Google Scholar]
- Raastad M, Shepherd GM. Single-axon action potentials in the rat hippocampal cortex. J Physiol. 2003;548:745–752. doi: 10.1113/jphysiol.2002.032706. [DOI] [PMC free article] [PubMed] [Google Scholar]
- Ramon y Cajal S. In: Histologie du systeme nerveux de l'homme et des vertebres. Léon Azoulay., translator. Paris: Masson; 1909–1911. [Google Scholar]
- Rapp M, Segev I, Yarom Y. Physiology, morphology and detailed passive models of guinea-pig cerebellar Purkinje cells. J Physiol. 1994;474:101–118. doi: 10.1113/jphysiol.1994.sp020006. [DOI] [PMC free article] [PubMed] [Google Scholar]
- Raymond JL, Lisberger SG, Mauk MD. The cerebellum: a neuronal learning machine? Science. 1996;272:1126–1131. doi: 10.1126/science.272.5265.1126. [DOI] [PubMed] [Google Scholar]
- Rossi F, Strata P. Reciprocal trophic interactions in the adult climbing fibre-Purkinje cell system. Prog Neurobiol. 1995;47:341–369. [PubMed] [Google Scholar]
- Rossi F, Borsello T, Vaudano E, Strata P. Regressive modifications of climbing fibres following Purkinje cell degeneration in the cerebellar cortex of the adult rat. Neuroscience. 1993;53:759–778. doi: 10.1016/0306-4522(93)90622-m. [DOI] [PubMed] [Google Scholar]
- Roth A, Häusser M. Compartmental models of rat cerebellar Purkinje cells based on simultaneous somatic and dendritic patch-clamp recordings. J Physiol. 2001;535:445–472. doi: 10.1111/j.1469-7793.2001.00445.x. [DOI] [PMC free article] [PubMed] [Google Scholar]
- Rousseeuw PJ. Silhouettes: a graphical aid to the interpretation and validation of cluster analysis. J Comput Appl Math. 1987;20:53–65. [Google Scholar]
- Samsonovich AV, Ascoli GA. Morphological homeostasis in cortical dendrites. Proc Natl Acad Sci U S A. 2006;103:1569–1574. doi: 10.1073/pnas.0510057103. [DOI] [PMC free article] [PubMed] [Google Scholar]
- Sasaki T, Matsuki N, Ikegaya Y. Effects of axonal topology on the somatic modulation of synaptic outputs. J Neurosci. 2012;32:2868–2876. doi: 10.1523/JNEUROSCI.5365-11.2012. [DOI] [PMC free article] [PubMed] [Google Scholar]
- Sawada K, Fukui Y, Hawkes R. Spatial distribution of corticotropin-releasing factor immunopositive climbing fibers in the mouse cerebellum: analysis by whole mount immunohistochemistry. Brain Res. 2008;1222:106–117. doi: 10.1016/j.brainres.2008.05.029. [DOI] [PubMed] [Google Scholar]
- Scheibel ME, Scheibel AB. Observations on the intracortical relations of the climbing fibers of the cerebellum; a Golgi study. J Comp Neurol. 1954;101:733–763. doi: 10.1002/cne.901010305. [DOI] [PubMed] [Google Scholar]
- Scorcioni R, Polavaram S, Ascoli GA. L-Measure: a web-accessible tool for the analysis, comparison and search of digital reconstructions of neuronal morphologies. Nat Protoc. 2008;3:866–876. doi: 10.1038/nprot.2008.51. [DOI] [PMC free article] [PubMed] [Google Scholar]
- Shepherd GM, Raastad M, Andersen P. General and variable features of varicosity spacing along unmyelinated axons in the hippocampus and cerebellum. Proc Natl Acad Sci U S A. 2002;99:6340–6345. doi: 10.1073/pnas.052151299. [DOI] [PMC free article] [PubMed] [Google Scholar]
- Sotelo C, Dusart I. Intrinsic versus extrinsic determinants during the development of Purkinje cell dendrites. Neuroscience. 2009;162:589–600. doi: 10.1016/j.neuroscience.2008.12.035. [DOI] [PubMed] [Google Scholar]
- Staiger JF, Flagmeyer I, Schubert D, Zilles K, Kötter R, Luhmann HJ. Functional diversity of layer IV spiny neurons in rat somatosensory cortex: quantitative morphology of electrophysiologically characterized and biocytin labeled cells. Cereb Cortex. 2004;14:690–701. doi: 10.1093/cercor/bhh029. [DOI] [PubMed] [Google Scholar]
- Sugihara I. Microzonal projection and climbing fiber remodeling in single olivocerebellar axons of newborn rats at postnatal days 4–7. J Comp Neurol. 2005;487:93–106. doi: 10.1002/cne.20531. [DOI] [PubMed] [Google Scholar]
- Sugihara I. Organization and remodeling of the olivocerebellar climbing fiber projection. Cerebellum. 2006;5:15–22. doi: 10.1080/14734220500527385. [DOI] [PubMed] [Google Scholar]
- Sugihara I, Shinoda Y. Molecular, topographic, and functional organization of the cerebellar cortex: a study with combined aldolase C and olivocerebellar labeling. J Neurosci. 2004;24:8771–8785. doi: 10.1523/JNEUROSCI.1961-04.2004. [DOI] [PMC free article] [PubMed] [Google Scholar]
- Sugihara I, Lang EJ, Llinás R. Uniform olivocerebellar conduction time underlies Purkinje cell complex spike synchronicity in the rat cerebellum. J Physiol. 1993;470:243–271. doi: 10.1113/jphysiol.1993.sp019857. [DOI] [PMC free article] [PubMed] [Google Scholar]
- Sugihara I, Wu H, Shinoda Y. Morphology of single olivocerebellar axons labeled with biotinylated dextran amine in the rat. J Comp Neurol. 1999;414:131–148. [PubMed] [Google Scholar]
- Sugihara I, Bailly Y, Mariani J. Olivocerebellar climbing fibers in the granuloprival cerebellum: morphological study of individual axonal projections in the X-irradiated rat. J Neurosci. 2000;20:3745–3760. doi: 10.1523/JNEUROSCI.20-10-03745.2000. [DOI] [PMC free article] [PubMed] [Google Scholar]
- Sugihara I, Wu HS, Shinoda Y. The entire trajectories of single olivocerebellar axons in the cerebellar cortex and their contribution to cerebellar compartmentalization. J Neurosci. 2001;21:7715–7723. doi: 10.1523/JNEUROSCI.21-19-07715.2001. [DOI] [PMC free article] [PubMed] [Google Scholar]
- Sultan F, Bower JM. Quantitative Golgi study of the rat cerebellar molecular layer interneurons using principal component analysis. J Comp Neurol. 1998;393:353–373. [PubMed] [Google Scholar]
- Szapiro G, Barbour B. Multiple climbing fibers signal to molecular layer interneurons exclusively via glutamate spillover. Nat Neurosci. 2007;10:735–742. doi: 10.1038/nn1907. [DOI] [PubMed] [Google Scholar]
- Tsiola A, Hamzei-Sichani F, Peterlin Z, Yuste R. Quantitative morphologic classification of layer 5 neurons from mouse primary visual cortex. J Comp Neurol. 2003;461:415–428. doi: 10.1002/cne.10628. [DOI] [PubMed] [Google Scholar]
- Vetter P, Roth A, Häusser M. Propagation of action potentials in dendrites depends on dendritic morphology. J Neurophysiol. 2001;85:926–937. doi: 10.1152/jn.2001.85.2.926. [DOI] [PubMed] [Google Scholar]
- Wang Y, Gupta A, Toledo-Rodriguez M, Wu CZ, Markram H. Anatomical, physiological, molecular and circuit properties of nest basket cells in the developing somatosensory cortex. Cereb Cortex. 2002;12:395–410. doi: 10.1093/cercor/12.4.395. [DOI] [PubMed] [Google Scholar]
- Wolpert DM, Miall RC, Kawato M. Internal models in the cerebellum. Trends Cogn Sci. 1998;2:338–347. doi: 10.1016/s1364-6613(98)01221-2. [DOI] [PubMed] [Google Scholar]
- Zhang L, Goldman JE. Generation of cerebellar interneurons from dividing progenitors in white matter. Neuron. 1996;16:47–54. doi: 10.1016/s0896-6273(00)80022-7. [DOI] [PubMed] [Google Scholar]