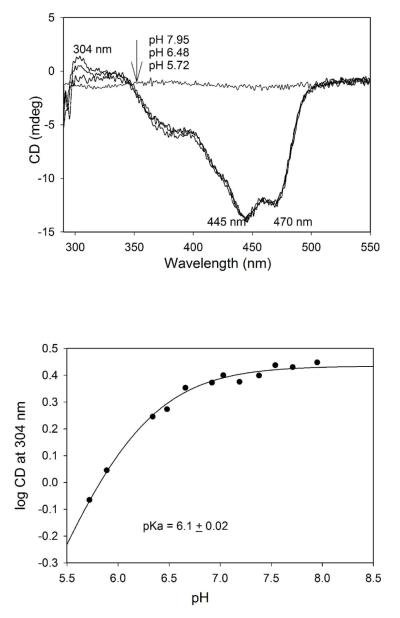
Figure 2.
The effect of pH on CD spectra of V51D GCL. (Top) Near-UV CD spectra of V51D GCL at different pH values. The V51D GCL from stock was diluted to a concentration of 2.6 mg/mL (concentration of active centers = 40 μM) in 0.1 M KH2PO4 containing 0.5 mM ThDP and 2.5 mM MgCl2. CD spectra were recorded after pH was adjusted to the desired value (pH 5.72 – pH 7.95). (Bottom) Dependence of the log CD304 versus pH. Data were fitted to a single ionizing group (eq 1).

